Inulin, a flexible oligosaccharide I: Review of its physicochemical characteristics
Bạn đang xem bản rút gọn của tài liệu. Xem và tải ngay bản đầy đủ của tài liệu tại đây (2.12 MB, 15 trang )
Carbohydrate Polymers 130 (2015) 405–419
Contents lists available at ScienceDirect
Carbohydrate Polymers
journal homepage: www.elsevier.com/locate/carbpol
Review
Inulin, a flexible oligosaccharide I: Review of its physicochemical
characteristics
Maarten A. Mensink a , Henderik W. Frijlink a , Kees van der Voort Maarschalk a,b ,
Wouter L.J. Hinrichs a,∗
a
b
Department of Pharmaceutical Technology and Biopharmacy, University of Groningen, Antonius Deusinglaan 1, 9713 AV Groningen, The Netherlands
Process Technology, Corbion Purac, PO Box 21, 4200 AA Gorinchem, The Netherlands
a r t i c l e
i n f o
Article history:
Received 22 December 2014
Received in revised form 8 May 2015
Accepted 12 May 2015
Available online 20 May 2015
Keywords:
Physical
Chemical
Carbohydrate
Polysaccharide
Oligofructose
Polymer
a b s t r a c t
Inulin, a fructan-type polysaccharide, consists of (2→1) linked -d-fructosyl residues (n = 2–60), usually
with an (1↔2) ␣-d-glucose end group. The applications of inulin and its hydrolyzed form oligofructose
(n = 2–10) are diverse. It is widely used in food industry to modify texture, replace fat or as low-calorie
sweetener. Additionally, it has several applications in other fields like the pharmaceutical arena. Most
notably it is used as a diagnostic agent for kidney function and as a protein stabilizer. This work reviews
the physicochemical characteristics of inulin that make it such a versatile substance. Topics that are
addressed include morphology (crystal morphology, crystal structure, structure in solution); solubility;
rheology (viscosity, hydrodynamic shape, gelling); thermal characteristics and physical stability (glass
transition temperature, vapor sorption, melting temperature) and chemical stability. When using inulin,
the degree of polymerization and processing history should be taken into account, as they have a large
impact on physicochemical behavior of inulin.
© 2015 The Authors. Published by Elsevier Ltd. This is an open access article under the CC BY-NC-ND
license ( />
Contents
1.
2.
Introduction . . . . . . . . . . . . . . . . . . . . . . . . . . . . . . . . . . . . . . . . . . . . . . . . . . . . . . . . . . . . . . . . . . . . . . . . . . . . . . . . . . . . . . . . . . . . . . . . . . . . . . . . . . . . . . . . . . . . . . . . . . . . . . . . . . . . . . . . . . . 406
1.1.
Chemical structure . . . . . . . . . . . . . . . . . . . . . . . . . . . . . . . . . . . . . . . . . . . . . . . . . . . . . . . . . . . . . . . . . . . . . . . . . . . . . . . . . . . . . . . . . . . . . . . . . . . . . . . . . . . . . . . . . . . . . . . . . . . . . 406
1.2.
Isolation and production . . . . . . . . . . . . . . . . . . . . . . . . . . . . . . . . . . . . . . . . . . . . . . . . . . . . . . . . . . . . . . . . . . . . . . . . . . . . . . . . . . . . . . . . . . . . . . . . . . . . . . . . . . . . . . . . . . . . . . . 406
1.3.
Uses . . . . . . . . . . . . . . . . . . . . . . . . . . . . . . . . . . . . . . . . . . . . . . . . . . . . . . . . . . . . . . . . . . . . . . . . . . . . . . . . . . . . . . . . . . . . . . . . . . . . . . . . . . . . . . . . . . . . . . . . . . . . . . . . . . . . . . . . . . . . 408
Physicochemical characteristics . . . . . . . . . . . . . . . . . . . . . . . . . . . . . . . . . . . . . . . . . . . . . . . . . . . . . . . . . . . . . . . . . . . . . . . . . . . . . . . . . . . . . . . . . . . . . . . . . . . . . . . . . . . . . . . . . . . . . . . 408
2.1.
Chain length . . . . . . . . . . . . . . . . . . . . . . . . . . . . . . . . . . . . . . . . . . . . . . . . . . . . . . . . . . . . . . . . . . . . . . . . . . . . . . . . . . . . . . . . . . . . . . . . . . . . . . . . . . . . . . . . . . . . . . . . . . . . . . . . . . . . 408
2.2.
Morphology . . . . . . . . . . . . . . . . . . . . . . . . . . . . . . . . . . . . . . . . . . . . . . . . . . . . . . . . . . . . . . . . . . . . . . . . . . . . . . . . . . . . . . . . . . . . . . . . . . . . . . . . . . . . . . . . . . . . . . . . . . . . . . . . . . . . 409
2.2.1.
Crystal morphology . . . . . . . . . . . . . . . . . . . . . . . . . . . . . . . . . . . . . . . . . . . . . . . . . . . . . . . . . . . . . . . . . . . . . . . . . . . . . . . . . . . . . . . . . . . . . . . . . . . . . . . . . . . . . . . . . . 409
2.2.2.
Crystal structure . . . . . . . . . . . . . . . . . . . . . . . . . . . . . . . . . . . . . . . . . . . . . . . . . . . . . . . . . . . . . . . . . . . . . . . . . . . . . . . . . . . . . . . . . . . . . . . . . . . . . . . . . . . . . . . . . . . . . 410
2.2.3.
Structure in solution . . . . . . . . . . . . . . . . . . . . . . . . . . . . . . . . . . . . . . . . . . . . . . . . . . . . . . . . . . . . . . . . . . . . . . . . . . . . . . . . . . . . . . . . . . . . . . . . . . . . . . . . . . . . . . . . . 410
2.3.
Solubility . . . . . . . . . . . . . . . . . . . . . . . . . . . . . . . . . . . . . . . . . . . . . . . . . . . . . . . . . . . . . . . . . . . . . . . . . . . . . . . . . . . . . . . . . . . . . . . . . . . . . . . . . . . . . . . . . . . . . . . . . . . . . . . . . . . . . . . 410
2.4.
Rheology . . . . . . . . . . . . . . . . . . . . . . . . . . . . . . . . . . . . . . . . . . . . . . . . . . . . . . . . . . . . . . . . . . . . . . . . . . . . . . . . . . . . . . . . . . . . . . . . . . . . . . . . . . . . . . . . . . . . . . . . . . . . . . . . . . . . . . . 411
2.4.1.
Viscosity . . . . . . . . . . . . . . . . . . . . . . . . . . . . . . . . . . . . . . . . . . . . . . . . . . . . . . . . . . . . . . . . . . . . . . . . . . . . . . . . . . . . . . . . . . . . . . . . . . . . . . . . . . . . . . . . . . . . . . . . . . . . . . 411
2.4.2.
Hydrodynamic shape . . . . . . . . . . . . . . . . . . . . . . . . . . . . . . . . . . . . . . . . . . . . . . . . . . . . . . . . . . . . . . . . . . . . . . . . . . . . . . . . . . . . . . . . . . . . . . . . . . . . . . . . . . . . . . . . 411
2.4.3.
Gelling . . . . . . . . . . . . . . . . . . . . . . . . . . . . . . . . . . . . . . . . . . . . . . . . . . . . . . . . . . . . . . . . . . . . . . . . . . . . . . . . . . . . . . . . . . . . . . . . . . . . . . . . . . . . . . . . . . . . . . . . . . . . . . . . 412
2.5.
Thermal characteristics and physical stability . . . . . . . . . . . . . . . . . . . . . . . . . . . . . . . . . . . . . . . . . . . . . . . . . . . . . . . . . . . . . . . . . . . . . . . . . . . . . . . . . . . . . . . . . . . . . . . . 414
2.5.1.
Glass transition temperature (Tg) . . . . . . . . . . . . . . . . . . . . . . . . . . . . . . . . . . . . . . . . . . . . . . . . . . . . . . . . . . . . . . . . . . . . . . . . . . . . . . . . . . . . . . . . . . . . . . . . . . . 414
2.5.2.
Vapor sorption . . . . . . . . . . . . . . . . . . . . . . . . . . . . . . . . . . . . . . . . . . . . . . . . . . . . . . . . . . . . . . . . . . . . . . . . . . . . . . . . . . . . . . . . . . . . . . . . . . . . . . . . . . . . . . . . . . . . . . . 414
2.5.3.
Melting temperature . . . . . . . . . . . . . . . . . . . . . . . . . . . . . . . . . . . . . . . . . . . . . . . . . . . . . . . . . . . . . . . . . . . . . . . . . . . . . . . . . . . . . . . . . . . . . . . . . . . . . . . . . . . . . . . . . 415
∗ Corresponding author. Tel.: +31 50 363 2398; fax: +31 50 363 2500.
E-mail address: (W.L.J. Hinrichs).
/>0144-8617/© 2015 The Authors. Published by Elsevier Ltd. This is an open access article under the CC BY-NC-ND license ( />0/).
406
3.
M.A. Mensink et al. / Carbohydrate Polymers 130 (2015) 405–419
2.6.
Chemical stability . . . . . . . . . . . . . . . . . . . . . . . . . . . . . . . . . . . . . . . . . . . . . . . . . . . . . . . . . . . . . . . . . . . . . . . . . . . . . . . . . . . . . . . . . . . . . . . . . . . . . . . . . . . . . . . . . . . . . . . . . . . . . . 416
Overview . . . . . . . . . . . . . . . . . . . . . . . . . . . . . . . . . . . . . . . . . . . . . . . . . . . . . . . . . . . . . . . . . . . . . . . . . . . . . . . . . . . . . . . . . . . . . . . . . . . . . . . . . . . . . . . . . . . . . . . . . . . . . . . . . . . . . . . . . . . . . . . 416
Acknowledgements . . . . . . . . . . . . . . . . . . . . . . . . . . . . . . . . . . . . . . . . . . . . . . . . . . . . . . . . . . . . . . . . . . . . . . . . . . . . . . . . . . . . . . . . . . . . . . . . . . . . . . . . . . . . . . . . . . . . . . . . . . . . . . . . . . . 417
References . . . . . . . . . . . . . . . . . . . . . . . . . . . . . . . . . . . . . . . . . . . . . . . . . . . . . . . . . . . . . . . . . . . . . . . . . . . . . . . . . . . . . . . . . . . . . . . . . . . . . . . . . . . . . . . . . . . . . . . . . . . . . . . . . . . . . . . . . . . . . 417
1. Introduction
Inulin was discovered over two centuries ago by Rose (Fluckiger
& Hanbury, 1879) and since then its presence in many plants
became apparent (Livingston, Hincha, & Heyer, 2007). Some examples of plants containing large quantities of inulin are Jerusalem
artichoke, chicory root, garlic, asparagus root, salisfy and dandelion
root (Kaur & Gupta, 2002). More commonly consumed vegetables
and fruits containing inulin are onion, leek, garlic, banana, wheat,
rye and barley. Daily intakes have been estimated to range from
1 to 10 g per day in the Western diet (Coussement, 1999; Van
Loo et al., 1995). The average American diet contains between 1.3
and 3.5 g of inulin per day, with an average of 2.6 g (Coussement,
1999). The European consumption of inulin appears to be substantially higher at 3–11 g per day, which is below reported tolerances
of at least 10–20 g per day (Bonnema, Kolberg, Thomas, & Slavin,
2010; Carabin & Flamm, 1999). Inulin has also been used safely in
infant nutrition (Closa-Monasterolo et al., 2013). This has led to
the American Food and Drug Administration to issuing a Generally
Recognized As Safe notification for inulin in 1992 (Kruger, 2002).
Inulin is also used pharmaceutically, most notably as a diagnostic
agent for the determination of kidney function (Orlando, Floreani,
Padrini, & Palatini, 1998; The editors of Encyclopaedia Brittanica,
2015).
Over the past decades, a lot of research has been done showing that inulin is a versatile substance with numerous promising
applications. Several reviews have been published on inulin, its
characteristics and functionality in food (Boeckner, Schnepf, &
Tungland, 2001; Kelly, 2008, 2009; Seifert & Watzl, 2007) and
pharma (Imran, Gillis, Kok, Harding, & Adams, 2012). This review
aims to provide an overview of the relevant physicochemical properties of inulin, which make it such a useful excipient in food and
pharma.
1.1. Chemical structure
Inulin, depending on its chain length, is classified as either
an oligo- or polysaccharide and it belongs to the fructan carbohydrate subgroup. It is composed of -d-fructosyl subgroups
linked together by (2→1) glycosidic bonds and the molecule usually ends with a (1↔2) bonded ␣-d-glucosyl group (Kelly, 2008;
Ronkart, Blecker, et al., 2007). The length of these fructose chains
varies and ranges from 2 to 60 monomers. Inulin containing
maximally 10 fructose units is also referred to as oligofructose
(Flamm, Glinsmann, Kritchevsky, Prosky, & Roberfroid, 2001). In
food, oligofructose is more commonly used a sweet-replacer and
longer chain inulin is used mostly as a fat replacer and texture modifier (Kelly, 2008). Both inulin and oligofructose are used as dietary
fiber and prebiotics in functional foods. Its longer chain length
makes inulin more useful pharmaceutically than oligofructose.
Before processing, the degree of polymerization of inulin
depends on the plant source, time of harvest, and the duration and
conditions of post-harvest storage (Kruger, 2002; Ronkart, Paquot,
et al., 2006; Saengthongpinit & Sajjaanantakul, 2005). Processing
itself also has a great influence on degree of polymerization of the
obtained product as will be discussed in Section 1.2. Table 1 provides an overview of the structure and size of some carbohydrates
frequently used in the pharmaceutical arena. The structures of a
selection of those carbohydrates are shown in Fig. 1.
Like many oligosaccharides, inulin is heterodisperse. High performance anion exchange chromatography (HPAEC) with pulsed
amperometric detection can be used to determine the number
average degree of polymerization (DPn) and the weight average
DP (DPw) of inulin (Timmermans, van Leeuwen, Tournois, Wit, &
Vliegenthart, 1994). Several chromatographic methods have been
described, but HPAEC has a superior sensitivity and resolution
(Barclay, Ginic-Markovic, Cooper, & Petrovsky, 2010; Timmermans
et al., 1994). The ratio between DPw and DPn is a measure of the
molecular weight distribution (polydispersity) of a sample (Stepto,
2009). The DP and polydispersity of an oligo- or polysaccharide
influence the physicochemical properties to a large extent (Blecker
et al., 2003; Kim, Faqih, & Wang, 2001).
Inulin is a unique oligo- or polysaccharide because its backbone does not incorporate any sugar ring, which can be seen in
Fig. 1. The backbone is in essence polyethylene oxide (Barclay et al.,
2010). This translates into a greater freedom to move and thus more
flexibility of the molecule. Furthermore, inulin is built up mostly
from furanose groups, which are more flexible than pyranose rings
(French, 1988; Livingston et al., 2007).
1.2. Isolation and production
Inulin is predominately isolated from chicory root. The isolation process basically consists of three steps: (1) extraction of
water-soluble components, including inulins, from chicory root (2)
purification to remove impurities and optionally low DP inulins
and (3) finally spray drying. Sometimes the extracted product is
partially hydrolyzed to reduce the DP of the final product (Franck,
2007). Here isolation and purification are only discussed briefly, for
further reading on this topic the reader is directed to the review of
Apolinário et al. (2014).
Inulin extracted from chicory root contains up to 10% of sugars
(mono-, di- and small oligosaccharides) (Coussement, 1999). Typically, extraction is done by boiling the cleaned and cut or ground
up roots in water. Process conditions such as pH of the water,
water–root ratio, boiling time, etc., may vary (Panchev, Delchev,
Kovacheva, & Slavov, 2011; Ronkart, Blecker, et al., 2007; Toneli,
Mürr, Martinelli, Dal Fabbro, & Park, 2007). As will be described in
Section 2.6, pH and boiling time could affect the DP of the produced
inulin. After extraction, the obtained mixture is condensed through
evaporation.
Purification of inulin is mostly done by making use of the
solubility difference of the DP fractions present in extracts. Heating and cooling in combination with filtration, decantation and
(ultra)centrifugation have been described to produce different
molecular weight fractions of inulin (European Patent No. EP
120302881, 2001; Leite, Martinelli, Murr, & Jin, 2004; Toneli
et al., 2007; Toneli, Park, Murr, & Martinelli, 2008; U.S. Patent
No. 6,419,978, 2002; World Patent No. WO/2000/011967, 2000).
Alternatively (organic) co-solvents, such as methanol, ethanol and
acetone, can be used to selectively precipitate long chain (DPn
25–40) inulin (Moerman, Van Leeuwen, & Delcour, 2004). Inulin
that has not been precipitated in these processes can be turned
into a solid by (spray) drying. Optimization of the spray drying
process, by varying inlet air, solution temperature and feed pump
speed, based on microstructure of the produced inulin and rheological behavior of concentrated inulin solutions have been described
(Toneli et al., 2008; Toneli, Park, Negreiros, & Murr, 2010).
M.A. Mensink et al. / Carbohydrate Polymers 130 (2015) 405–419
407
Table 1
Some carbohydrates used frequently in food and pharma, their structure and size. Glcp = Glucopyranosyl, Fruf = Fructofurananosyl, Galp = Galactopyranosyl (IUPAC-IUBMB
Joint Commission on Biochemical Nomenclature, 1997).
Carbohydrate
Building blocks and linkages
Molecular weight (Da)
Backbone
Article cited
Glucose
Trehalose
␣-d-Glc
␣-d-Glcp-(1↔1)-␣-d-Glcp
1.8 × 10²
3.4 × 10²
–
Linear
Sucrose
Lactose
Maltodextrin
Amylose (␣-Glucan)
␣-d-Glcp-(1↔2)--d-Fruf
-d-Galp-(1→4)-d-Glc
[4)-␣-d-Glcp-(1→]n
[4)-␣-d-Glcp-(1→]n
3.4 × 10²
3.4 × 10²
1.8 × 10² to 3.2 × 10³
5 × 10⁵ to 2 × 10⁶
Linear
Linear
Linear
Linear
Dextran (␣-Glucan)
[6)-␣-d-Glcp-(1→]n (Main)
␣-d-Glcp-(1→3)-␣-d-Glcp
(also (1→2) and (1→4)
(Branches)
[4)--d-Glcp-(1→]n
[1)--d-Fruf-(2→]n (Main)
␣-d-Glcp-(1↔2)--d-Fruf
(End, usually)
[6)--d-Fruf-(2→]n (Main)
-d-Fruf-(2→1)--d-Fruf
(Branches)
1.0 × 10³ to ∼107
Branched
National Center for Biotechnology Information (2015)
National Center for Biotechnology Information (2015),
Tarantino (2000)
National Center for Biotechnology Information (2015)
National Center for Biotechnology Information (2015)
Council of Europe (2005)
National Center for Biotechnology Information (2015), Potter
and Hassid (1948), Suortti, Gorenstein, and Roger (1998)
Kim, Robyt, Lee, Lee, and Kim (2003), Naessens, Cerdobbel,
Soetaert, and Vandamme (2005), National Center for
Biotechnology Information (2015)
Cellulose (-Glucan)
Inulin (Fructan)
Levan (Fructan)
3 × 10⁵ to 2 × 10⁶
5.0 × 10² to 1.3 × 10⁴
1 × 10⁴ to 1 × 10⁸
a
Linear
Linear
Klemm, Schmauder, and Heinze (2005)
Barclay et al. (2010), Kelly (2008), Ronkart, Blecker, et al.
(2007), Vereyken, Chupin, et al. (2003)
Branched
French and Waterhouse (1993), French (1988), Tanaka, Oi, and
Yamamoto (1980), Vereyken, Chupin, et al. (2003)
a
Bacterially produced inulin has been reported to be branched and have a significantly higher molecular weight than plant derived inulin, see also Table 2 (Wolff et al.,
2000).
Fig. 1. Chemical structures from a selection of the carbohydrates listed in Table 1.
408
M.A. Mensink et al. / Carbohydrate Polymers 130 (2015) 405–419
Ronkart, Deroanne, et al. (2007) investigated several aspects of
the isolation and purification of inulin, with emphasis on the physical characteristics of the produced inulin. They investigated the
influence of several parameters, such as feed and inlet temperature
during spray-drying on the physicochemical characteristics of the
produced inulin. It was found that at a feed temperature of 80 ◦ C and
higher, the produced inulin was completely amorphous. A high air
inlet temperature (230 ◦ C compared to 120–170 ◦ C) also increased
the amount of amorphous inulin produced. Next to that, they characterized oligofructose produced by hydrolysis of inulin from globe
artichoke by endo-inulinase (Ronkart, Blecker, et al., 2007).
Apart from extraction from plants, inulin can also be produced
enzymatically. Inulosucrase type fructosyltransferase can synthesize inulin from sucrose by catalyzing both transglycosylation and
hydrolysis of sucrose (Ozimek, Kralj, van der Maarel, & Dijkhuizen,
2006). Several procedures to do so have been described, these
mostly involve enzymes derived from bacteria. Enzymes from Bacillus species 217 C–11 have been used to produce inulin on a large scale
(Wada, Sugatani, Terada, Ohguchi, & Miwa, 2005) and Escherichia
coli and Streptococcus mutans derived fructosyltransferase can produce very high molecular weight inulins (Heyer et al., 1998). Both
these studies reported remarkably low polydispersity (around 1.1)
of the produced inulin. Inulin producing fructosyltransferases from
several Lactobacillus strains have also been characterized (Anwar
et al., 2010; Ozimek et al., 2006). Inulosucrase from Leuconostoc
citreum CW 28 was shown to produce different molecular weight
inulin when it was cell associated compared to when it was free
in solution. The cell associated enzyme predominately produced
inulin with a molecular weight between 1.35–1.60 × 10⁶ Da and
the free enzyme produced more inulin with a molecular weight
between 2600 and 3400 Da (Ortiz-Soto, Olivares-Illana, & LópezMunga, 2004).
Isolation of two plant derived fructosyltransferases from
Helianthus tuberosus and the production of inulin with those purified enzymes was described by Lüscher et al. (1996). The fungus
Aspergillusi oryzae KB is also able to produce inulin type oligofructoses from sucrose, but additionally possesses another enzyme
which simultaneously hydrolyzes sucrose. The first enzyme
produces 1-kestose, nystose and fructosyl nystose, whereas the
second one produces glucose and fructose (Kurakake et al., 2008).
Oligofructoses can be produced by partial enzymatic hydrolysis of polyfructoses. Enzymes from Aspergillus niger can produce
oligofructose from both hydrolysis of inulin (by inulinase) and
synthesis from sucrose (by -fructosyltransferase) and its inulinases provided higher yields than inulinases from Kluyveromuces
marxianus (Silva et al., 2013). Beghin-Meiji, a commercial supplier of oligofructose, use -fructo-furanosidase from A. niger to
synthesize, rather than to hydrolyze, oligofructose from sucrose
(Beghin-Meiji, 2015). For more information on microbial enzymatic
production of oligofructoses either from synthesis from sucrose or
from hydrolysis of inulin, the reader is directed to a recent review
of Mutanda, Mokoena, Olaniran, Wilhelmi, and Whiteley (2014).
To the best of our knowledge, high molecular weight inulin from
synthetic source is not yet commercially available on a large scale,
most likely because of the high production costs.
Finally, a completely different method of production is the
genetic modification of a potato to make it produce inulin like
globe artichoke. However the inulin yield is low (5%) and inulin
production goes at the cost of starch production (Hellwege, Czapla,
Jahnke, Willmitzer, & Heyer, 2000). Van Arkel et al. (2013) recently
published a review on plants that were genetically modified to
produce inulin. They named modified sugar beet, sugarcane and
rice as potential candidates for production of inulin, with possibilities to control certain characteristics (e.g. chain length) of the
produced inulin by selectively controlling the expression of specific
synthesizing enzymes.
1.3. Uses
Inulin is widely applied in the food industry and it serves many
purposes. It has been used as a (low calorie) sweetener, to form gels,
to increase viscosity, to improve organoleptic properties, and as a
non-digestible fiber. Mostly it is used as a sugar and fat replacer in
dairy products and as a prebiotic (Meyer, Bayarri, Tárrega, & Costell,
2011). Examples of use in dairy are application in cheese, milk,
yogurt and ice cream (Meyer et al., 2011). Some examples of use of
inulin in non-dairy food are use in bread, biscuits, cereal and meat
products (González-Herrera et al., 2015; Karimi, Azizi, Ghasemlou,
& Vaziri, 2015; Kuntz, Fiates, & Teixeira, 2013; Rodriguez Furlán,
Pérez Padilla, & Campderrós, 2015). Previous reports have already
extensively reviewed the food applications of inulin (Barclay et al.,
2010; Boeckner et al., 2001; Franck, 2007; Kelly, 2008, 2009; Kruger,
2002; Meyer et al., 2011; Tungland & Meyer, 2002), as well as its
prebiotic effects (Kelly, 2008, 2009; Kolida, Tuohy, & Gibson, 2007;
Roberfroid & Delzenne, 1998; Seifert & Watzl, 2007).
Applications of inulin as pharmaceutical excipient are even
more diverse and range from stabilization of protein-based
pharmaceuticals (Hinrichs, Prinsen, & Frijlink, 2001), through solid
dispersions to increase dissolution rate (Visser et al., 2010), to targeted colon delivery (Imran et al., 2012). Moreover, as mentioned
earlier, inulin itself is used as a diagnostic tool for measuring the
kidney function (glomerular filtration rate) (Orlando et al., 1998;
The editors of Encyclopaedia Brittanica, 2015). Inulin is injected
intravenously, after which it is excreted renally. As inulin is not naturally present in the body and it is not metabolized in circulation,
the amount of inulin secreted in the urine provides information
on kidney function. Less widespread is the use of inulin for industrial and chemical purposes. Stevens, Meriggi, and Booten (2001)
reviewed the derivatization of inulin and applications of these
chemically modified inulins for a wide range of applications, from
inhibiting calcium carbonate crystallization industrially to use in
hair gel.
Section 2 will address the physicochemical characteristics of
inulin. These characteristics are what make inulin such a versatile
substance. For example, inulin is used in food as a texture modifier and fat replacer because of its DP-dependent gel forming and
viscous behavior (see Section 2.4). The (2→1) glycosidic bonds of
inulin make it indigestible to humans and it can therefore be used
as a low-calorie sweetener, fat replacer and dietary fiber (Barclay
et al., 2010). Colonic microorganisms such as lactobacilli, however,
are capable of breaking down this bond, making inulin suitable for
colonic targeting. The relatively high glass transition temperature
of amorphous inulin (Section 2.5) in combination with its flexible
backbone makes it a good stabilizer of proteins applied both pharmaceutically (Tonnis et al., 2015) and in food (Rodriguez Furlán,
Lecot, Pérez Padilla, Campderrós, & Zaritzky, 2012). Lastly, specific
crystalline morphologies (Section 2.2) make inulin suitable as an
adjuvant for vaccines (Honda-Okubo, Saade, & Petrovsky, 2012).
2. Physicochemical characteristics
2.1. Chain length
As mentioned in the introduction the DP of inulin determines
its physicochemical characteristics to a substantial extent. Table 2
provides an overview of the reported degrees of polymerization
of different types of inulin to serve as a frame of reference. It
is, however, to be noted that the degree of polymerization alone
oversimplifies reality, as it does not take into account the distribution of the different fractions. Also, in many cases no distinction is
made between the DPw and DPn (thus nor between the weight and
number based molecular weights (Mw and Mn)), which are only
M.A. Mensink et al. / Carbohydrate Polymers 130 (2015) 405–419
409
Table 2
Overview of size and origin of different inulins.
Manufacturer
Product name
Source
Size DP
Molecular weight
Orafti
Raftilose P95
Chicory
DPn 4–5
Mn 624–679
Raftiline ST
Chicory
DPn 10–12
Mn 1250
Raftiline HP
Chicory
DPn 21–26,
DPw 31
Mn 2499
RS
Chicory
DPn 14.2; DPw
19.4
Fibrulose F97
Fibruline Instant
Fibruline LCHT
Chicory
Chicory
Chicory
Fibruline XL
Chicory
DPn 5.5
DPn 9
DPn 20–22,
DPw 26.4
DPn 20–23,
DPw 27–30
SC 95
Chicory
Frutafit CLR
Frutafit
Frutafit IQ
Chicory
Chicory
Chicory
Frutafit Tex!, EXL
Chicory
DPn ≥23, DPw
26.2
Inulin
Chicory
DPn 25
Mn 4450,
Mw 4620–6200
Inulin
Jerusalem Artichoke
DPn 29
Mw 3400 ± 150
Inulin
Dahlia
DPn 26–35
N.C.P.*
n/a
Jerusalem Artichoke
N.C.P.*
Beghin-Meiji
n/a
Actilight 950P
Jerusalem Artichoke
Aspergillus niger
DPn 28–33
DPn 3
N.C.P.a
N.C.P.a
N.C.P.a
n/a
n/a
n/a
Bacillus sp. 217C-1
Globe artichoke
Aspergillus sydowi
DPn 16–18
DPn 80
N.C.P.a
N.C.P.a
n/a
n/a
Aspergillus sydowi
Synthetic FTF
Streptococcus mutans
Cosucra
Imperial Sensus
Sigma
a
DPn 5.5, DPw
6.0
DPn 7–9
DPn 9
DPn 8–12
DPw/DPn
Article cited
1.13
Blecker et al. (2002), De
Gennaro et al. (2000)
De Gennaro et al. (2000),
Schaller-Povolny et al. (2000)
Ronkart, Paquot, et al. (2006),
Schaller-Povolny et al. (2000),
Vereyken, van Kuik, et al.
(2003), Wada et al. (2005)
Hinrichs et al. (2001)
1.3
Blecker et al. (2002)
Blecker et al. (2002)
Blecker et al. (2003, 2002)
Ronkart, Paquot, et al. (2006),
Ronkart, Deroanne, et al.
(2007), Ronkart, Paquot, et al.
(2010)
1.09
Mn 832
1.3
Hinrichs et al. (2001)
Gonzalez-Tomás et al. (2008)
Schaller-Povolny et al. (2000)
Bouchard et al. (2008),
Gonzalez-Tomás et al. (2008)
Gonzalez-Tomás et al. (2008),
Hinrichs et al. (2001)
Azis et al. (1999), De Gennaro
et al. (2000), Naskar et al.
(2010b), Wada et al. (2005)
Azis et al. (1999), Wada et al.
(2005)
Vereyken, van Kuik, et al.
(2003), Wada et al. (2005)
Mw 7200 ± 100
Mn 6100 ± 500
Mn 4900–5600 ± 500
Mn 579
1.18
Eigner et al. (1988)
Mw
1.49 × 10⁴ –5.29 × 10⁶
Mw 26–28 × 106
Mw 30–90 × 106
1.13–3.01
Panchev et al. (2011)
Blecker et al. (2002), De
Gennaro et al. (2000)
Wada et al. (2005)
Ronkart, Blecker, et al. (2007)
Kitamura et al. (1994)
1.7
1.1
Wolff et al. (2000)
Heyer et al. (1998), Wolff et al.
(2000)
N.C.P. = non-commercial product, purified or produced by the authors; n/a = does not apply.
identical when the material is monodisperse. Where a degree of
polymerization without further specification was reported, it was
assumed to be the number based variety. For inulin the DPn can be
converted into the average molar mass using the following formula:
Mn = 180 + 162 × (DPn-1), similar can be done for DPw by substituting DPn by DPw and Mn by Mw. Table 2 contains reported DP and
molecular weight values of inulin from various sources as reported
in literature, it was not completed with calculated values for clarity
purposes.
Wada et al. (2005) reported that the main difference between
the inulin they synthesized enzymatically and plant-derived inulin
was the polydispersity. Synthetic inulin had a lower polydispersity, which they illustrated with chromatograms from HPAEC with
pulsed amperometric detection. Unfortunately, however, the polydispersity was not quantified.
2.2. Morphology
2.2.1. Crystal morphology
Lis and Preston (1998) patented the production of obloid and
needle-like shaped crystals of inulin. The needle-like crystals were
1–20 m in length with the other axes being 10–30% of that
(U.S. Patent No. 5,840,884, 1998). The obloid crystals were of the
same length, yet the other axes were sized at 50–80% of the
length. The different types of crystals were produced by cooling an aqueous liquid containing 10–50% of Fibruline Instant (DP
6–12). The crystal transition temperature of the two crystals was
approximately 75–95 ◦ C. If the solution was cooled form a temperature higher than the crystal transition temperature obloid
crystals would be produced, if lower (given all inulin was previously dissolved) needle-like crystals were obtained (U.S. Patent No.
5,840,884, 1998). It was argued that the mouth feel of the obloid
shaped crystals is better than that of the needle shaped crystals.
Viscosity could be altered by varying the ratio and sizes of the
two types of crystals. Needle-like crystals predominately increased
viscosity while obloid ones improved lubricity.
Hébette et al. (1998) investigated the influence of cooling rate,
molecular weight, concentration, and storage time on the crystallization of inulin using Raftiline ST (DP 10–12) and fractions
thereof. The crystallization produced obloid, or more accurately
eight-shaped, crystals which were 5–20 m in size if they started
forming at a high temperature (77 ◦ C) and up to a tenfold smaller if
410
M.A. Mensink et al. / Carbohydrate Polymers 130 (2015) 405–419
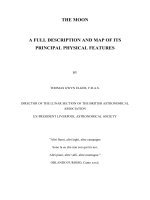
Fig. 3. Differences of aqueous solubility between plant-origin (DPn 10–12 and
23–25) and enzymatically synthesized inulin (DPn 16–18).
Fig. 2. Representation of the atomic labeling scheme for the inulin chain.
Reprinted with permission (André, Mazeau, et al., 1996). Copyright 1996 American
Chemical Society.
they were formed at lower temperatures (65 ◦ C). The thickness and
perfection of the formed crystalline lamellae was inversely related
to the amount of undercooling. By small angle X-ray scattering
(SAXS), they found that the crystal structure was the same as the
monohydrate form (see Section 2.2.2) (André, Putaux, et al., 1996).
The periodicity of the crystals produced at higher temperatures was
˚
110 A˚ and at lower temperatures 90 A.
2.2.2. Crystal structure
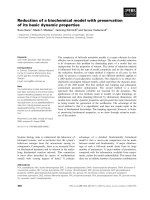
Marchessault, Bleha, Deslandes, and Revol (1980) investigated
the three-dimensional crystal structure of inulin. They reported it to
have a 5-fold helix, being either left- or right-handed with a space
of 2.16 A˚ per monomer and thus 10.8 A˚ per loop. Reported bond
angles were « = 130◦ , ϕ = 75◦ and ω = 60◦ (right-handed) or ω = 180◦
(left-handed), see Fig. 2 for an illustration of which bond-angles
are described. Large differences in crystal structure were shown
between polyethylene glycol and inulin, which were explained by
steric interactions between the substituents and the exo-anomeric
effect.
André, Putaux, et al. (1996) claimed Marchessault’s findings of
an unusual 5-fold helix to be based on limited data and in fact
incorrect and that the crystals they produced actually contained
a 6-fold helix. They reported the formation an orthorhombic hemi˚ b = 9.65 A,
˚ c = 14.4 A˚
hydrate crystal with dimensions of a = 16.70 A,
per 6 units and a pseudo-hexagonal monohydrate crystal with
˚ b = 9.80 A,
˚ c = 14.7 A˚ per loop. The hemi-hydrate cona = 16.70 A,
tained one water molecule per two fructosyl residues while the
mono-hydrate had one per fructosyl residue. The helical conformation of the hemi-hydrate was characterized by ϕ = 66◦ , = 154◦ ,
and ω = −82◦ and the monohydrate’s dimensions were very similar with the following bond angles ϕ = 68◦ , = 159◦ , and ω = −87◦ .
André thus concluded that the progress per loop was 14.4 or 14.7 A˚
as opposed to 10.8 A˚ (André, Mazeau, & Tvaroska, 1996; André,
Putaux, et al., 1996). It should however be noted that the methods used to produce the crystals by André and Marchessault were
not identical and the inulin used was not characterized apart from
crystal structure. As described in Section 2.2.1, the method of production is of influence on the morphology of the produced crystals
and thus it is possible that different isoforms might have been produced. Further down several isoforms of inulin monohydrate will
be discussed based on classifications of solubility and size.
Reprinted with permission (Wada et al., 2005). Copyright 2005 American Chemical
Society.
2.2.3. Structure in solution
French (1988) calculated the theoretically allowed conformations for inulin in solution and concluded that the allowed
conformations were similar to those of dextran. Of course the
reported conformations are merely the allowed conformations
based on specific assumptions, French also noted that there are a
lot of factors influencing the favored structure of oligosaccharides.
Vereyken, van Kuik, Evers, Rijken, and de Kruijff (2003) also found
many possible conformations for inulin in their models, including
a zigzag conformation with the ω angle at 180◦ which stayed stable in their simulations. This multitude of possible conformations
shows the molecular flexibility of inulin.
Several reports have described the behavior of a broad range
of inulins in solution. Models and measurements by Oka, Ota, and
Mino (1992) and Liu, Waterhouse, and Chatterton (1994) indicate
that a helical conformation is possible for oligofructose of DP 5. This
conformation would however not be possible for higher molecular
weight inulins due to steric hindrance. Liu et al. (1994) reported
that for inulins sized up to DP 9 simple helical structures are not the
predominant structure and Oka et al. (1992) found that for a DP of
8 and higher the backbone would reach a more rigid conformation.
It thus seems that an organized three-dimensional structure does
not occur for oligosaccharides with a DP smaller than about 8 or 9.
2.3. Solubility
Wada et al. (2005) investigated the aqueous solubility at various temperatures of three different types of inulin, two Raftiline
inulins which differed in size and an enzymatically produced synthetic inulin. Their results are depicted in Fig. 3, Raftiline HP (DPn
23–25) displays lowest solubility, followed by Raftiline ST (DPn
10–12). What is remarkable, however, is that the enzymatically
produced synthetic inulin (DPn 16–18) had a higher solubility than
Raftiline ST despite its higher DP. Normally the solubility of polymers decreases with increasing DP. As mentioned, the average DP
of a polymer only tells part of the story and it is also relevant
to consider the molecular weight distribution of the different DP
fractions. The reader is directed to the cited article for molecular weight profile chromatograms of these inulins. The absence of
highly polymerized fractions (no fraction with a DP larger than 30)
in the enzymatically produced synthetic inulin could explain the
higher solubility of the synthetic inulin (Wada et al., 2005). Unfortunately, the method by which solubility was established was not
M.A. Mensink et al. / Carbohydrate Polymers 130 (2015) 405–419
411
Table 3
Aqueous solubilities of different sizes of inulin at various temperatures.
DPn or Mw (g/mol)
Solubility
Temperature (◦ C)
Source
4
12
25
4468
8–12
>75% (w/v)
12% (w/v)
2.5% (w/v)
∼10% (w/w)
17.4% (w/w)
25
25
25
30
37
Franck (2007)
Franck (2007)
Franck (2007)
Naskar et al. (2010a)
Bouchard, Hofland, and Witkamp (2007)
described. Kim et al. (2001) also investigated the solubility of Raftiline HP over a temperature range and also found a low solubility
up to 50 ◦ C from where on the solubility drastically increased until
35% at 90 ◦ C. Reported aqueous solubilities of some other inulines
are listed in Table 3.
Bot, Erle, Vreeker, and Agterof (2004) reported hazing when dissolving Raftiline ST inulin in water. This was presumably the result
of a small, high-DP crystalline fraction of inulin which did not dissolve readily. It was found that this fraction did not dissolve at room
temperature, but typically would do so at temperatures of 60 ◦ C and
higher.
Cooper and Carter (1986) and Cooper and Petrovsky (2011) initially identified four polymorphs of crystalline inulin (␣, , ␥ and ␦)
based on their dissolution behavior.  inulin, which was produced
by addition of ethanol or by freeze-thawing, is readily soluble in
water at room temperature. The other polymorphs, which could be
interconverted into more stable versions (in the order , ␣, ␥ to
␦), required higher temperatures to dissolve. All polymorphs could
be interconverted by re-dissolution. The ␥ polymorph was made
up only out of inulin with a molecular weight >8000 g/mol, where
the ␣ and  forms also contained lower molecular weight inulin
fractions (Cooper & Carter, 1986). More recently the list of polymorphs was expanded to seven plus the amorphous form (Cooper,
Barclay, Ginic-Markovic, & Petrovsky, 2013). All the polymorphs,
which differed in chain length, were monohydrate inulin crystals described earlier (André, Putaux, et al., 1996; Cooper, Barclay,
Ginic-Markovic, Gerson, & Petrovsky, 2014). The monohydrate and
hemi-hydrate only differ in the amount of water associated to
the inulin, not in their crystal structures (André, Mazeau, et al.,
1996; Ronkart, Deroanne, Paquot, Fougnies, & Blecker, 2010). As
suggested by André, Putaux, et al. (1996), the fructose units of
inulin formed helices with a 6-unit repeat. Cooper et al. (2014)
found that the different polymorphs increased in size by steps of
6 fructose units and concluded that these units formed additional
helical turns. Surprisingly, these polymorphs were characterized
by a degree of polymerization of 6n + 1, rather than 6n. This additional fructosyl residue was shown to be able to link to glucose of
another molecule through hydrogen bonding, allowing formation
of tertiary structures of inulin (Cooper et al., 2015).
Ronkart et al. (2007b) found that increasing the feed temperature during spray drying reduced crystallinity and increased the
Tg of the produced samples. As a higher Tg is correlated with a
higher molecular weight (see Section 2.5.1), this too indicates that
the crystals that dissolve at higher temperatures are made up out
of higher molecular weight inulins.
In summary, inulin is poorly soluble in water, with decreasing
solubility for higher molecular weight fractions. Solubility
increases at higher temperatures for all different inulins. These
characteristics enable a controlled production of several isomorphs,
allowing modification of product characteristics such as rheology.
Glibowski (2010) however reported difficulties in controlling inulin
crystallization.
Inulin is hardly soluble in ethanol (Bouchard et al., 2008),
explaining the use of ethanol in precipitating inulin (Cooper &
Carter, 1986), it is freely soluble in dimethyl sulfoxide (DMSO) and
very poorly to sparingly soluble in isopropanol (Azis, Chin, Deacon,
Harding, & Pavlov, 1999; Dan, Ghosh, & Moulik, 2009; Naskar,
Dan, Ghosh, & Moulik, 2010a, 2010b). Phelps (1965) reported that
crystals produced using ethanol-recrystallization contained more
low DP inulin compared to water-recrystallized samples. Considering that ethanol reduces the solubility of inulin so drastically,
one would indeed expect that lower DP fractions of inulin are also
affected and separate from solution.
2.4. Rheology
2.4.1. Viscosity
Multiple reports have appeared on the intrinsic viscosity of several inulins in different media, the results of which have been
summarized in Table 4.
The intrinsic viscosity decreases by addition of salts and
increases with increasing DMSO concentration and molecular
weight. The dynamic viscosity of several types of inulin at specific concentrations and temperatures has also been reported, an
overview can be found in Table 5.
Like Table 4, Table 5 also shows an increase in viscosity with
increasing molecular weight. With increasing temperature, the viscosity is reduced. Wada et al. (2005) reported a slightly lower
viscosity for enzymatically produced synthetic inulin (DPn 16–18)
than for two commercial Raftiline samples (ST with a DPn of 10–12
and HP with a DPn of 23–25) despite the fact that it has a higher
average molecular weight than Raftiline ST. However, as explained
in Section 2.3 the average molecular weight does not provide information about the size distribution. The enzymatically produced
synthetic inulin lacks highly polymerized fractions, which could
be an explanation for this difference in viscosity. Wada et al. (2005)
only presented the viscosity data graphically and they were thus
not added to Table 5.
2.4.2. Hydrodynamic shape
The Mark–Houwink equation (Eq. (1)) defines the relationship
between intrinsic viscosity ([Á]) and molecular weight (M) for polymers, with two constants (K and a) (Dan et al., 2009; Wolff et al.,
2000).
[Á] = K × M a
(1)
The constant a in this equation is indicative for the shape of
the polymer in the solution. The a-value for compact spheres is 0,
whereas an a-value below 0.5 indicates branched structures, an avalue between 0.5 and 0.9 is associated with a random coil, and an avalue over 2.0 with a rod structure (Wolff et al., 2000). Intermediate
a values represent intermediate shapes.
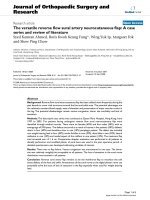
The plots in Fig. 4 from the publication of Wolff et al. (2000) show
linear correlations between Mw and intrinsic viscosities for inulin
species with a Mw > 5.0 × 10⁴ and for species with a Mw < 5.0 × 10⁴ .
They found that a = 0.71 for the ‘small’ inulins, showing a random
coil structure and a = 0.02 for the high molecular weights, indicative
of a compact sphere. Remarkably, these results are similar to those
reported for levan, which does not have a polyethylene glycol-like
flexible backbone. Apparently, these bacterially produced fructans
have similar characteristics, despite differences in their backbone
structure, branching may explain the found similarities (Wolff et al.,
412
M.A. Mensink et al. / Carbohydrate Polymers 130 (2015) 405–419
Table 4
Intrinsic viscosity ([Á]) of inulin in several media at various temperatures (T).
Medium
[Á] (mL/g)
Kh (–)
T (◦ C)
Mw (g/mol)
Source (manufacturer)
Article cited
Water
Water
Water
Water
Water
Water
Water
Water
Water
Water
Water
Water
Water
Water:DMSO (3:1)
Water:DMSO (2:1)
Water:DMSO (1:1)
Water:DMSO (1:2)
Water:DMSO (1:6)
DMSO
DMSO
DMSO
DMSO
0.5 M NH4 SCN (in water)
0.5 M NaCl (in water)
0.5 M Na2 SO4 (in water)
4.92
4.49
5.85
6.97
8.26
10.5
12.8
16.3
16.5
16.5
18.6
19.1
18.0
5.86
6.63
7.96
11.0
14.9
18.8
15.2
9.1 ± 0.2
10.7 ± 0.2
3.65
4.30
4.21
1.13
1.10
n.r.
n.r.
n.r.
n.r.
n.r.
n.r.
n.r.
n.r.
n.r.
n.r.
n.r.
2.12
1.50
1.27
1.09
1.75
1.30
0.48
n.r.
n.r.
2.40
2.16
2.24
30
30
25
25
25
25
25
25
25
25
25
25
25
30
30
30
30
30
30
30
25
25
30
30
30
4450
4478
1.49 × 10⁴
1.87 × 10⁴
2.38 × 10⁴
3.37 × 10⁴
7.52 × 10⁴
16.6 × 10⁴
60.4 × 10⁴
97.4 × 10⁴
178 × 104
529 × 104
54 × 106
4450
4450
4450
4450
4450
4450
4478
3400 ± 150
6200 ± 200
4478
4478
4478
Chicory root (Sigma)
Chicory root (Sigma)
A. sydowi
A. sydowi
A. sydowi
A. sydowi
A. sydowi
A. sydowi
A. sydowi
A. sydowi
A. sydowi
A. sydowi
FTF from S. Mutans
Chicory root (Sigma)
Chicory root (Sigma)
Chicory root (Sigma)
Chicory root (Sigma)
Chicory root (Sigma)
Chicory root (Sigma)
Naskar et al. (2010b)
Dan et al. (2009)
Kitamura et al. (1994)
Kitamura et al. (1994)
Kitamura et al. (1994)
Kitamura et al. (1994)
Kitamura et al. (1994)
Kitamura et al. (1994)
Kitamura et al. (1994)
Kitamura et al. (1994)
Kitamura et al. (1994)
Kitamura et al. (1994)
Wolff et al. (2000)
Naskar et al. (2010b)
Naskar et al. (2010b)
Naskar et al. (2010b)
Naskar et al. (2010b)
Naskar et al. (2010b)
Naskar et al. (2010b)
Dan et al. (2009)
Azis et al. (1999)
Azis et al. (1999)
Dan et al. (2009)
Dan et al. (2009)
Dan et al. (2009)
Jerusalem artichoke (Sigma)
Chicory root (Sigma)
Chicory root (Sigma)
Chicory root (Sigma)
Chicory root (Sigma)
Kh = Huggins constant (if the Huggins formula was used to calculate the intrinsic viscosity), n.r. = not reported.
2000). In addition, it should be noted that levan is still quite flexible
compared to other polysaccharides like amylose, as it is linked via
the C6 carbon (a primary alcohol) and not directly to the ring.
Next to viscosity, static light scattering was also used to determine the influence of molecular weight on the radius of gyration
of the bacterially produced inulins. Those results too indicated a
compact globular shape for high Mw inulin, but more importantly
showed that there might be a difference in branching architecture
for inulins of different origins (Wolff et al., 2000). Using small angle
X-ray scattering, Eigner, Abuja, Beck, and Praznik (1988) showed
that inulin from Jerusalem artichoke with a Mw of 7200 had a rodlike formation in aqueous solution. This is not consistent with the
above-mentioned conclusions for bacterially produced inulins. The
most likely explanations for this are the enormous difference in
molecular weight between bacterially produced and natural inulin
(see Table 2) combined with the amount of branching of the bacterially produced inulins and the lack thereof in natural inulins.
Azis et al. (1999) investigated characteristics of inulin extracted
from Jerusalem artichoke and chicory root (Mw 3400 ± 150 and
6200 ± 200, respectively) in DMSO. They differed significantly in
size, but a lot less in intrinsic viscosity, indicating a conformation
between a random coil and a compact sphere in that solvent. Naskar
et al. (2010b) concluded that inulin forms globular aggregates in
aqueous solutions and rod-like or spindle-like assemblies in DMSO.
In summary hydrodynamic shape and behavior of inulin are influenced by molecular weight, solvent and branching (depending on
the inulin source).
De Gennaro, Birch, Parke, and Stancher (2000) investigated the
hydrodynamic behavior of several inulins (ranging from oligofructose with Mn 579 to inulin with Mn 4620) by looking at apparent
specific volume (ASV), isentropic apparent specific compressibility [K2(s) ] and spin-lattice relaxation times (T1 ). ASV, a measure of
hydrostatic packing with water molecules, was found to increase
with degree of polymerization, indicating that low DP inulin had
better hydrostatic packing and interacted with water more. Isentropic compressibility values can be interpreted as a measure for
the compatibility between water and inulin. K2(s) increased with DP
and concentration, showing reduced solute-water affinity. Inulin
was found to be more water compatible than other tested carbohydrates except at high concentrations (>15% (w/w)) and/or for a DP
of 9 or higher. In the light of the discussion above the latter could
mean that the formation of three-dimensional helical structures
reduces inulin’s water compatibility. Lastly, due to an increased
order of protons and reduced water mobility, T1 values decreased
with increasing Mn and concentration (De Gennaro et al., 2000).
2.4.3. Gelling
In general inulin gels are based on the interactions occurring
between dissolved inulin chains. However, inulin gels may also
still contain undissolved microcrystals. These microcrystals can be
interconnected, forming a network that is able to interact with
both the solvent and other inulin particles thereby increasing gel
strength (Bot et al., 2004; Franck, 2007; Kim et al., 2001; Ronkart,
Paquot, et al., 2010; Van Duynhoven, Kulik, Jonker, & Haverkamp,
Table 5
Reported dynamic viscosities of several sizes of inulin in water.
Viscosity (mPa s)
T (◦ C)
Concentration (%)
DPn
Article cited
<1.0
1.6
2.4
1.21 ± 0.06
1.27 ± 0.08
1.29 ± 0.09
1.31 ± 011
1.12
10
10
10
25
25
25
25
37
5
5
5
5
5
5
5
10
4
12
25
28
30a
30a
33
8–12
Franck (2007)
Franck (2007)
Franck (2007)
Panchev et al. (2011)
Panchev et al. (2011)
Panchev et al. (2011)
Panchev et al. (2011)
Bouchard et al. (2007)
a
Samples are from two different subspecies of Jerusalem artichoke.
M.A. Mensink et al. / Carbohydrate Polymers 130 (2015) 405–419
413
Fig. 4. Molar mass dependence of intrinsic viscosity for high Mw bacterially produced inulin, data from Kitamura, Hirano, and Takeo (1994) and Wolff et al. (2000). Lines
represent the linear regression of the Mark–Houwink equation (Eq. (1)).
1999). As described earlier, temperature and molecular weight
influences the formation of microcrystals and thereby also gel formation. Based on this and their higher viscosities, high molecular
weight inulins are better gel formers than their lower molecular weight counterparts. This also explains why hydrolysis, which
reduces the degree of polymerization, reduces gel formation by disturbance of the network (Kim & Wang, 2001). Using nuclear magnetic resonance spectroscopy, Van Duynhoven et al. (1999) showed
that lower inulin concentrations lead to lower concentrations of
crystalline material. This results in a reduction in the network formation, explaining lower mechanical strength of the gel.
Inulin gels can be formed either thermally, through heating and
cooling, or by applying shear forces (Kim et al., 2001). Kim et al.
(2001) and Kim and Wang (2001) have investigated both methods of gel production extensively. Thermally produced gels were
found to be stronger and smoother than shear induced ones. Gel
production was dependent on temperature, heating time, concentration, pH and addition of other solvents. Addition of other solvents
(ethanol or glycerol) reduced polarity of the solution causing less
solvent–inulin interactions, resulting in faster gel formation but
with similar gel strengths. The minimal concentration of inulin
needed for gel formation differed with temperature. The solution
needed to be heated up to at least 40 ◦ C to achieve gelling. However,
heating to temperatures of 80 ◦ C and higher, and acidic conditions
(pH < 3) lead to substantial hydrolysis of inulin, resulting in reduced
gel formation (Kim et al., 2001). In these studies, only Raftiline
HP (DPn 23–25) was used, the influence of molecular weight was
thus not taken into account. Meyer et al. (2011) did investigate
the influence of DP and concentration on gel strength. They found
that higher molecular weight inulins produce stronger gels and
are able to form gels at lower concentrations as can be seen in
Fig. 5.
Chiavaro, Vittadini, and Corradini (2006) specifically investigated the influence of DP on thermal gelation and found that by
using inulin of different molecular weight gels could be produced
with different characteristics due to a difference in balance between
solid–solid and solid–liquid interactions. Using texture profile analysis, higher molecular weight inulins were found to form gels that
were harder, more adhesive and less cohesive both after production
and after storage at 4 ◦ C for 4 weeks. This means that higher molecular weight gels required more force to be deformed, would stick
to surfaces more and had weaker internal bonds between components (Szczesniak, 1963). The gels prepared from higher molecular
weight inulin had more freezable water than gels prepared from
low molecular weight inulin (Chiavaro et al., 2006). These observations were ascribed to an increase in inulin–inulin interactions and
a decrease in inulin–water interaction with increasing molecular
weight. As solid–solvent interactions were needed for storage stability, lower molecular weight inulin gels maintained their textural
characteristics better during storage. Here too, the average DP does
not tell the complete story and the polydispersity should be taken
into account as well. It seems that for a stable gel a fraction of the
Fig. 5. Gel strength in relation to concentration of different inulin types. The gels
were prepared by heating the solutions at given concentrations to 85 ◦ C and allowing
them to cool overnight at 4 ◦ C (Meyer et al., 2011).
414
M.A. Mensink et al. / Carbohydrate Polymers 130 (2015) 405–419
inulin needs to be of high enough DP for micro-crystallization and
solid–solid interactions to form a network, and another part needs
to be smaller to interact with the solvent (Chiavaro et al., 2006). This
is in line with the findings of Glibowski, Pikus, Jurek, and Kotowoda
(2014) that addition of low concentrations (≥0.02%) of seeding
crystals allowed heated inulin solutions to form gels instead of
precipitating during cooling. At a higher concentration of seeding
crystals (≥0.4%) stronger and more stable gels were obtained.
Shear-induced gels were reported to become smoother when
the applied shear stress was increased (Kim et al., 2001). This is
because low shear caused the formation of larger aggregates; at
higher shear stresses a better dispersion was achieved. In comparison to thermally produced gels, shear gels contain larger particles
with a broader particle size distribution and with that the gels
have a reduced yield stress. Ronkart, Paquot, et al. (2010) found
that repeated application of high shear stress reduced particle size,
facilitating the formation of a finer network of particles and textural modifications. In addition, the reduction in particle size might
have resulted in more inulin dissolving, increasing viscosity and
also modifying gel behavior. Bot et al. (2004) investigated how several methods of crystallization influenced the large deformation
rheology of inulin gels and found that shape and size of the produced crystals play an important role in the formed network and
thus the texture of the produced gel.
Using high-pressure homogenization, Alvarez-Sabatel, de
˜
Maranón,
and Arboleya (2015) related gel characteristics to
pressures used during this process. It is important to note here
that the product temperature increases during processing and
that this temperature increase is much larger for higher processing pressures. Caution should therefore be taken in relating
processing pressures to gel characteristics directly, as this heating
also influences the characteristics of the formed gel (Glibowski,
2010). Nonetheless, by varying this pressure and therewith the
product temperature, inulin gels with specific characteristics can
be produced.
Gelling and texture modifying properties of inulin in more complex systems have been reported. Some reports suggest that inulin
has a synergistic effect on gelation with other gelling agents (e.g.
gelatin, alginate, maltodextrins and starch) and proteins whilst
others actually report inulin competing with them (Franck, 2007;
Gonzalez-Tomás, Coll-Marqués, & Costell, 2008; Meyer et al., 2011;
Tseng, Xiong, & Boatright, 2008). It seems that for some excipients a competition for water occurs whilst with others a combined
network is formed, but it goes beyond the scope of this review to
discuss this behavior in detail here.
Lastly, several reports described the synthesis (Maris et al., 2001;
Vervoort & Van den Mooter, 1997) and behavior of (meth)acrylated
inulin gels for controlled release of drugs in the colon (Castelli
et al., 2008; Fares, Salem, & Khanfar, 2011; Pitarresi, Giacomazza,
Triolo, Giammona, & San Biagio, 2012; Tripodo, Pitarresi, Palumbo,
Craparo, & Giammona, 2005; Van den Mooter, Vervoort, & Kinget,
2003). Gels of these chemically modified inulins were produced by
formation of covalent cross-links between the added side-chains
using free radical polymerization. In terms of rheological behavior,
a higher degree of substitution resulted in a faster gelation process and higher rigidity of the obtained gels for methylacrylated
inulin due to more inter-molecular crosslinking (Vervoort et al.,
1999). Different cross-linkers were investigated and found to modify rate of crosslinking and elasticity of produced gels differently,
allowing for control of mechanical properties of these gels (Pitarresi
et al., 2012). Controlling the amount of swelling of the hydrogels
is critical. High swelling of the gel is needed to allow degradation
in the colon by bacteria (Van den Mooter et al., 2003), however, to
prevent premature drug release before the colonic environment is
reached, low swelling is key (Maris et al., 2001). Recently, chemically crosslinking of inulin molecules using divinyl sulfone was
used to produce microgels intended for controlled release in the
stomach (Sahiner, Sagbas, Yoshida, & Lyon, 2014).
2.5. Thermal characteristics and physical stability
2.5.1. Glass transition temperature (Tg)
Most commercially available types of inulin are amorphous
and can thus be characterized by a glass transition temperature
(Tg ). Above the glass transition temperature molecular mobility is
strongly increased and crystallization can occur. Molecular weight
influences the Tg of anhydrous carbohydrates and the Tg of the
maximally freeze concentrated fraction (Tg ) of carbohydrates.
The Tg is of interest when freeze-drying is used as a production
process. The Tg should not be surpassed during the first part of
freeze-drying (primary drying) in order to achieve an amorphous
product. The Fox–Flory equation (Eq. (2)) describes the relationship
between Tg and molecular weight (Fox & Flory, 1950).
Tg = Tg,∞ −
C
M
(2)
With Tg,∞ being the Tg at infinite molecular weight, M molecular
weight, and C a constant.
The Tg,∞ and constant C were calculated for inulin using data
of Hinrichs et al. (2001) and unpublished data. The maximal Tg
(Tg,∞ ) was 175 ◦ C, with a fitting constant of 75 kDa. The maximal Tg
(Tg,∞ ) was −14 ◦ C with a fitting constant of 11.3 kDa. Compared to
smaller carbohydrates like sucrose and fructose, inulin has a much
higher Tg . At similar molecular weights glucans have even higher
Tg values. For the Tg values the same trends apply (Kawai, Fukami,
Thanatuksorn, Viriyarattanasak, & Kajiwara, 2011).
Water acts as a plasticizer on amorphous carbohydrate samples,
meaning it decreases the Tg . The Gordon–Taylor equation (Eq. (3))
describes Tg of an ideal mixture of two amorphous components, in
this case a mixture of water and inulin. Water has a very low Tg of
approximately 165 K, explaining why even small amounts strongly
decrease the Tg (Giovambattista, Angell, Sciortino, & Stanley, 2004;
Velikov, Borick, & Angell, 2001).
Tg,mix =
fa ∗ Tg,a + K ∗ fb ∗ Tg,b
fa + K ∗ fb
(3)
(Gordon & Taylor, 1952) fx is the weight fraction of component
x (with x either a or b), and K is usually considered as a fitting
parameter.
Several papers have reported measurements of the influence of
the water content on the Tg of inulin. Fig. 6 shows the results of
water uptake of up to 12% on the Tg of inulins of various molecular
weights. The Gordon–Taylor equation was used to fit the curves.
For all inulins, a water content of just 2% decreased the Tg with
around 30 K and at a moisture content of 10% the Tg of the mixture
had gone down by nearly 100 K.
2.5.2. Vapor sorption
Knowing that water can strongly reduce the Tg of a mixture, it
is important to determine the water sorption of inulin in relation
to relative humidity in the atmosphere. Using dynamic vapor sorption, water uptake of several inulins and trehalose was studied as
a function of relative humidity (RH) (Hinrichs et al., 2001). Water
sorption was similar for all sizes of inulin and was similar to that
of other amorphous carbohydrates. Trehalose crystallized at a RH
above 50%, whereas the inulin samples remained amorphous on the
timescale of the dynamic vapor sorption experiments (hours), even
though they all surpassed their Tg during the measurement. This
shows that inulin crystallizes less easily than trehalose. Incidental (short term) exposure to high relative humidity of amorphous
inulin does therefore not necessarily lead to immediate crystallization. In two other studies where inulin was stored at controlled
M.A. Mensink et al. / Carbohydrate Polymers 130 (2015) 405–419
415
Fig. 7. Glass transition temperature-water content relationship for inulin DPn
23/DPw 30 with three regions of different crystallinity (Ronkart et al., 2009).
Fig. 6. Effect of moisture content on Tg of several inulin samples. The low molecular
weight, native and high molecular weight samples had degrees of polymerization
of 7, 13 and 27, respectively. PM denotes pre-melted, meaning the sample had
been heated in solution, quench-cooled and subsequently freeze-dried to make the
sample completely amorphous, NT denotes not treated (Kawai et al., 2011).
relative humidities for weeks, crystallization was found (SchallerPovolny, Smith, & Labuza, 2000; Zimeri & Kokini, 2002).
Ronkart, Blecker, et al. (2006), Ronkart et al. (2008) and Ronkart,
Paquot, Fougnies, Deroanne, and Blecker (2009) described the consequences of moisture sorption for inulin samples with different
degrees of crystallinity. Depending on the molecular weight of
the inulin, the amorphous particles fused at RH of >56% (Ronkart,
Blecker, et al., 2006) or at RH over >75% at 20 ◦ C (Ronkart et al.,
2008) (corresponding to a water uptake of 12–15 g/100 g dry inulin
at >75% RH). This lead to caking, i.e. sticking together of the powder
particles resulting in reduced flowability. The presence of crystals
in the amorphous matrix limited the caking (Ronkart et al., 2008).
This behavior is not uncommon for polysaccharides.
They then defined three regions based on water uptake and crystallinity at 20 ◦ C, as shown in Fig. 7 (Ronkart et al., 2009). In region
I inulin remained completely amorphous, in region III inulin was
completely crystallized (and caked). Region II represents an intermediate region where inulin’s macroscopic and thermal properties
were changing. In region I the Tg of the samples was at least 10 ◦ C
above storage temperature, in region III the Tg was room temperature or lower. This shows that if the Tg drops below storage
temperature +10 ◦ C, mobility will increase and lead to crystallization and caking, which is nearly always undesirable. Therefore,
storage conditions should be carefully chosen and exposure to high
relative humidities and temperatures should be avoided.
Similarly, Schaller-Povolny et al. (2000) defined a critical moisture content (and corresponding critical relative humidity) based
on macroscopic changes to inulin morphology, above which inulin
would be crystalline. These large macroscopic changes are only
truly apparent crystallization is widespread and are therefore not
a good measure for determination of a critical moisture content (Ronkart et al., 2009). The study does however show that
inulins of different molecular weight pass through this critical
point at different amounts of water uptake. Inulins with a higher
molecular weight can withstand more water uptake before they
reach the critical point and thus be stored at higher RH. Higher
molecular weight inulins may therefore be used to improve
processability and storage stability in food or other products
(Schaller-Povolny et al., 2000).
2.5.3. Melting temperature
Melting temperatures of fractions of Fibruline LCHT with different degrees of polymerization were determined and are shown in
Fig. 8 (Blecker et al., 2003). Two groups with different degree of
crystallinity could be distinguished. The higher DP fractions were
insoluble in water (obtained by precipitation in aqueous solutions
at various temperatures), while the low DP fractions were produced
by freeze-drying water soluble fractions (Blecker et al., 2003). Low
DP fractions had a lower melting enthalpy, which is indicative for
crystallinity, of 7–9 J/g and the higher fractions 17–19 J/g (Blecker
et al., 2003). Even higher melting enthalpies ranging up to 47.6 J/g
have also been reported (Zimeri & Kokini, 2002). Melting temperatures reported elsewhere were similar to the ones shown in Fig. 8,
with melting temperatures being reported between 165 and 183 ◦ C
(Dan et al., 2009; Heyer et al., 1998; Panchev et al., 2011; Zimeri
& Kokini, 2002). The melting temperature of a enzymatically produced synthetic inulin as determined by Heyer et al. (1998) was
Fig. 8. Relations between degree of polymerization (DP) and inulin’s melting temperature (Blecker et al., 2003).
416
M.A. Mensink et al. / Carbohydrate Polymers 130 (2015) 405–419
only 183 ◦ C despite its much larger size (70 × 106 g/mol), which is
common for polymers (Flory & Vrij, 1963). Inulin started degrading after melting, when heated above 200–225 ◦ C (Dan et al., 2009;
Heyer et al., 1998; Ronkart, Deroanne, et al., 2010).
The hemi-hydrate of inulin (produced by water sorption
of amorphous inulin) had a melting temperature of around
155–160 ◦ C and the mono-hydrate (seeding crystals) had a melting point between 170 and 180 ◦ C (Ronkart, Deroanne, et al.,
2010). Similar melting temperatures were reported for the different monohydrate polymorphs described in Section 2.3, which
differed from each other in molecular weight (Cooper et al., 2013).
It is therefore likely that the two different fractions shows in Fig. 8
are mono-hydrate and hemihydrate forms of inulin.
2.6. Chemical stability
Inulin with a glucose end group does not have or form any
reactive aldehyde or ketone groups and is therefore non-reducing.
However, inulin molecules lacking this glucose end group, thus
ending with a fructose group, is reducing (BeMiller, Steinheimer,
& Allen, 1967). Furthermore, as discussed previously, inulin is a
polydisperse mixture and can also contain mono- and disaccharides which are more reactive. These inulins without glucose end
group can thus take part in reactions with other components, such
as the amino group of proteins in the Maillard reaction. In the light
of the above, it could be useful to distinguish between inulin with
and without glucose end groups. If reducing groups are present
and the Maillard could potentially occur, formulation modifications
such as the addition of sulfite, or adjusting the pH could be used to
reduce the risk of the Maillard reaction occurring (Martins, Jongen,
& Boekel, 2001; McWeeny, Biltcliffe, Powell, & Spark, 1969).
Several reports discussed the amount of reducing groups of
inulin, some supplied more details than others (De Gennaro et al.,
2000; Hinrichs et al., 2001; Stevens et al., 2001). Stevens et al. (2001)
found a residual reducing activity of 0.5–2.5% after removal of
mono- and disaccharides from ‘native inulin’. Hinrichs et al. (2001)
found that the percentage of carbohydrate units containing reducing groups was much higher for small inulins than for larger inulins.
Oligofructose synthesized from sucrose contains fewer reducing
groups than oligofructose produced by hydrolysis of inulin (De
Gennaro et al., 2000). Hydrolyzed inulin will contain fructose chains
both with and without glucose end group, whereas inulin synthesized from sucrose only contains fructose chains with a glucose end
group. The relative abundance of fructose chains without glucose
can explain the difference in amount of reducing groups between
these two production methods.
Influence of several processing parameters on the amount of
reducing groups of inulin were reported (Kim et al., 2001; Kim &
Wang, 2001). Reducing sugar content of aqueous inulin solutions
increased with increasing temperature and with lower pH due to
hydrolysis of inulin (Kim et al., 2001). At neutral pH, the percentage
of reducing groups increased from <0.1% to only 1.2% after heating a concentrated solution to 100 ◦ C for 5 min. At pH values of 3
or lower the amount of reducing sugars formed increased drastically, up to 25% at pH 1 (Kim et al., 2001). Reducing groups were
formed as a result of hydrolysis, which followed pseudo first-order
kinetics with reducing activity increasing continuously over time
during heating (Kim & Wang, 2001). Since hydrolysis was the cause
of the increase in reducing activity, it was indirectly indicative of a
reduction of DP. This is because hydrolysis cleaves the end fructosyl
group of inulin, reducing its DP. Which, as explained above, in turn
influences several other characteristics of inulin (Kim et al., 2001).
For oligofructose, the influence of various processing parameters on hydrolysis have also been reported (Barclay, GinicMarkovic, Johnston, Cooper, & Petrovsky, 2012; Blecker, Fougnies,
Van Herck, Chevalier, & Paquot, 2002; L’homme, Arbelot,
Puigserver, & Biagini, 2003; Matusek, Merész, Le, & Örsi, 2008;
Vega & Zuniga-Hansen, 2015). Hydrolysis of oligofructose also follows pseudo first-order kinetics (Barclay et al., 2012; Blecker et al.,
2002; L’homme et al., 2003). Little hydrolysis was found up to 60 ◦ C,
this changed at 70 ◦ C and above (Matusek et al., 2008). Hydrolysis
mainly took place at acidic rather than neutral or alkaline conditions, where low molecular weight oligofructose reacted faster
than high molecular weight ones (L’homme et al., 2003). It was
also found that fructose was produced at a higher rate than glucose
(Barclay et al., 2012). Sucrose, containing only a (1↔2) linked d-glucosyl and -d-fructosyl group, reacted more slowly than the
oligofructose carbohydrates. Combined, these results indicate that
the terminal -d-fructosyl-(2→1)--d-fructosyl glycosidic bond is
most susceptible to acidic hydrolysis (Barclay et al., 2012; Blecker
et al., 2002; L’homme et al., 2003). At lower degrees of polymerization this terminal bond is relatively more abundant and they thus
have a lower chemical stability. At a pH of around 3, changes in
pH of 0.3 units were found to have a large impact on hydrolysis
(Matusek et al., 2008). At pH 2.7 and a temperature of 90–100 ◦ C
nearly complete degradation of oligofructose into monomers was
achieved in 30–40 min (Matusek et al., 2008). At a pH ≥ 5, relevant
for food applications, no degradation was found regardless of thermal processing (up to 100 ◦ C for 55 min) (Glibowski & Bukowska,
2011).
Inulin and oligofructose thus show similar trends with respect
to pH, temperature and molecular weight dependent hydrolysis
(Blecker et al., 2002). The kinetics of the reactions are however different (Barclay et al., 2012). For higher molecular weight inulins,
the rate of hydrolysis is initially low, but increases as hydrolysis
progresses (Blecker et al., 2002). An explanation for this could be
the amount of end-chain fructosyl groups. Initially, they are scarce,
meaning hydrolysis of mid-chain glycosidic bonds will be more
pronounced. Mid-chain hydrolysis in turn increases the amount of
more reactive end chain fructosyl groups, resulting in an increase
in reaction rate (Blecker et al., 2002). It was also suggested that
the helical structure of inulin, or the lack thereof for oligosaccharides, influences their reaction rate and how those are influenced
by temperature (Barclay et al., 2012).
3. Overview
Here the physicochemical characteristics of inulin, an oligosaccharide widely used in food and pharma, have been reviewed. The
average DP of inulin is often used when describing the physicochemical properties such as solubility and thermal and rheological
properties. This generally works well but can potentially also be
misleading as the average DP only provides an average and does not
provide information on the actual size distribution. Inulin consists
of a mixture of polymers of different chain length, its physicochemical properties are to a great extent dependent on the size
distribution of this mixture. This means that two different batches
of inulin with the same average DP can have different size distributions and therewith different characteristics. Higher DP inulin
fractions are less soluble in water, possess higher melting temperatures if crystalline or higher glass transition temperatures if
amorphous, are chemically more stable (less sensitive to hydrolysis), form stronger gels and are more viscous when dissolved.
Inulin is used to modify texture or replace fat in food, its DPsensitive gel forming and viscous behavior make it suitable for that
purpose. Additionally, the (2→1) linked fructosyl residues of inulin
are not hydrolyzed by the human digestive enzymes, enabling lowcalorie replacement of fat. The partially hydrolyzed form of inulin,
oligofructose (DP ≤ 10), has this same feature and is more sweet,
and is therefore used as a low-calorie sugar replacer. Their indigestibility makes both inulin and oligofructose suitable as dietary
M.A. Mensink et al. / Carbohydrate Polymers 130 (2015) 405–419
fibers. As microbiota in the colon are capable of breaking down
inulin, it is also used as a prebiotic and to prepare gels for targeted
drug release in the colon.
Inulin’s backbone is relatively flexible compared to other
polysaccharides, as it does not incorporate the sugar ring. This combined with a relatively high Tg makes inulin a suitable stabilizer of
proteins in the dry state for both food and pharma applications.
Some specific pharmaceutical applications are its use as a diagnostic agent for kidney function and as an adjuvant for vaccines. Again,
the size distribution of the inulin is relevant for these applications.
Therefore, regardless of its application both the average DP and the
size distribution of inulin should be taken into account. Information on how the molecular weight of inulin and other factors affect
its characteristics relevant for its various application can be found
in this review.
Acknowledgements
This research was jointly financed by Royal FrieslandCampina, the European Union, European Regional Development Fund
and The Ministry of Economic Affairs, Agriculture and Innovation,
Peaks in the Delta, the Municipality of Groningen, the Provinces of
Groningen, Fryslân and Drenthe as well as the Dutch Carbohydrate
Competence Center.
References
˜
Alvarez-Sabatel, S., de Maranón,
I. M., & Arboleya, J.-C. (2015). Impact of high
pressure homogenisation (HPH) on inulin gelling properties, stability and development during storage. Food Hydrocolloids, 44, 333–344.
André, I., Mazeau, K., & Tvaroska, I. (1996). Molecular and crystal structures of inulin
from electron diffraction data. Macromolecules, 29, 4626–4635.
André, I., Putaux, J. L., Chanzy, H., Taravel, F. R., Timmermans, J. W., & de Wit, D. (1996).
Single crystals of inulin. International Journal of Biological Macromolecules, 18,
195–204.
Anwar, M. A., Kralj, S., Piqué, A. V., Leemhuis, H., van der Maarel, M. J. E. C., &
Dijkhuizen, L. (2010). Inulin and levan synthesis by probiotic Lactobacillus gasseri
strains: Characterization of three novel fructansucrase enzymes and their fructan products. Microbiology, 156, 1264–1274.
Apolinário, A. C., de Lima Damasceno, B. P. G., de Macêdo Beltrão, N. E., Pessoa, A.,
Converti, A., & da Silva, J. A. (2014). Inulin-type fructans: A review on different
aspects of biochemical and pharmaceutical technology. Carbohydrate Polymers,
101, 368–378.
Azis, B. H., Chin, B., Deacon, M. P., Harding, S. E., & Pavlov, G. M. (1999). Size and
shape of inulin in dimethyl sulphoxide solution. Carbohydrate Polymers, 38,
231–234.
Barclay, T., Ginic-Markovic, M., Cooper, P., & Petrovsky, N. (2010). Inulin: A versatile
polysaccharide with multiple pharmaceutical and food chemical uses. Journal of
Excipients and Food Chemicals, 1, 27–50.
Barclay, T., Ginic-Markovic, M., Johnston, M. R., Cooper, P. D., & Petrovsky, N. (2012).
Analysis of the hydrolysis of inulin using real time 1H NMR spectroscopy. Carbohydrate Research, 352, 117–125.
Beghin-Meiji. (2015). Actilight® production process info. hin-meiji.
com/actilight/index.php?id=43&menu=2&rub=2&mere=3. Accessed 03.27.15
BeMiller, J., Steinheimer, T., & Allen, E. (1967). Alkaline degradation of inulin and its
structural implications. Clinical Chemistry, 13, 261–269.
Blecker, C. S., Chevalier, J. P., Deroanne, C., Paquot, M., Razafindralambo, H., &
Wathelet, B. (2001). European Patent No. EP 1203028B1. Paris, France: European
Patent Office.
Blecker, C. S., Chevalier, J.-P., Fougnies, C., Van Herck, J.-C., Deroanne, C., & Paquot,
M. (2003). Characterisation of different inulin samples by DSC: Influence of
polymerisation degree on melting temperature. Journal of Thermal Analysis and
Calorimetry, 71, 215–224.
Blecker, C. S., Fougnies, C., Van Herck, J.-C., Chevalier, J.-P., & Paquot, M. (2002).
Kinetic study of the acid hydrolysis of various oligofructose samples. Journal of
Agricultural and Food Chemistry, 50, 1602–1607.
Boeckner, L. S., Schnepf, M. I., & Tungland, B. C. (2001). Inulin: A review of nutritional
and health implications. Advances in Food and Nutrition Research, 43, 1–63.
Bonnema, A. L., Kolberg, L. W., Thomas, W., & Slavin, J. L. (2010). Gastrointestinal
tolerance of chicory inulin products. Journal of the American Dietetic Association,
110, 865–868.
Bot, A., Erle, U., Vreeker, R., & Agterof, W. G. M. (2004). Influence of crystallisation
conditions on the large deformation rheology of inulin gels. Food Hydrocolloids,
18, 547–556.
Bouchard, A., Hofland, G. W., & Witkamp, G.-J. (2007). Properties of sugar, polyol,
and polysaccharide water−ethanol solutions. Journal of Chemical & Engineering
Data, 52, 1838–1842.
417
´ N., Hofland, G. W., Jiskoot, W., Mendes, E., Crommelin, D.
Bouchard, A., Jovanovic,
J. A., et al. (2008). Supercritical fluid drying of carbohydrates: Selection of suitable excipients and process conditions. European Journal of Pharmaceutics and
Biopharmaceutics, 68, 781–794.
Carabin, I. G., & Flamm, W. G. (1999). Evaluation of safety of inulin and oligofructose
as dietary fiber. Regulatory Toxicology and Pharmacology, 30, 268–282.
Castelli, F., Sarpietro, M. G., Micieli, D., Ottimo, S., Pitarresi, G., Tripodo, G., et al.
(2008). Differential scanning calorimetry study on drug release from an inulinbased hydrogel and its interaction with a biomembrane model: pH and loading
effect. European Journal of Pharmaceutical Sciences, 35, 76–85.
Chiavaro, E., Vittadini, E., & Corradini, C. (2006). Physicochemical characterization and stability of inulin gels. European Food Research and Technology, 225,
85–94.
Closa-Monasterolo, R., Gispert-Llaurado, M., Luque, V., Ferre, N., Rubio-Torrents, C.,
Zaragoza-Jordana, M., et al. (2013). Safety and efficacy of inulin and oligofructose
supplementation in infant formula: Results from a randomized clinical trial.
Clinical Nutrition, 32, 918–927.
Cooper, P. D., Barclay, T. G., Ginic-Markovic, M., Gerson, A. R., & Petrovsky, N. (2014).
Inulin isoforms differ by repeated additions of one crystal unit cell. Carbohydrate
Polymers, 103, 392–397.
Cooper, P. D., Barclay, T. G., Ginic-Markovic, M., & Petrovsky, N. (2013). The polysaccharide inulin is characterized by an extensive series of periodic isoforms with
varying biological actions. Glycobiology, 23, 1164–1174.
Cooper, P. D., & Carter, M. (1986). Anti-complementary action of polymorphic “solubility forms” of particulate inulin. Molecular Immunology, 23, 895–901.
Cooper, P. D., & Petrovsky, N. (2011). Delta inulin: A novel, immunologically active,
stable packing structure comprising -d-[2→1] poly(fructo-furanosyl) ␣-dglucose polymers. Glycobiology, 21, 595–606.
Cooper, P. D., Rajapaksha, K. H., Barclay, T. G., Ginic-Markovic, M., Gerson, A. R.,
& Petrovsky, N. (2015). Inulin crystal initiation via a glucose-fructose crosslink of adjacent polymer chains: Atomic force microscopy and static molecular
modelling. Carbohydrate Polymers, 117, 964–972.
Council of Europe. (2005). Maltodextrin (5th ed., pp. 1970–1971). European Pharmacopoeia 5.0 Strasbourg: Directorate for the Quality of Medicines & Healthcare of
the Council of Europe.
Coussement, P. A. A. (1999). Nutritional and health benefits of inulin and oligofructose inulin and oligofructose: Safe intakes and legal status 1. The Journal of
Nutrition, 129, 1412–1417.
Dan, A., Ghosh, S., & Moulik, S. P. (2009). Physicochemical studies on the biopolymer inulin: A critical evaluation of its self-aggregation, aggregate-morphology,
interaction with water, and thermal stability. Biopolymers, 91, 687–699.
De Gennaro, S., Birch, G. G., Parke, S. a., & Stancher, B. (2000). Studies on the
physicochemical properties of inulin and inulin oligomers. Food Chemistry, 68,
179–183.
Eigner, W., Abuja, P., Beck, R., & Praznik, W. (1988). Physicochemical characterization
of inulin and sinistrin. Carbohydrate Research, 180, 87–95.
Fares, M. M., Salem, M. S., & Khanfar, M. (2011). Inulin and poly(acrylic acid)
grafted inulin for dissolution enhancement and preliminary controlled release
of poorly water-soluble Irbesartan drug. International Journal of Pharmaceutics,
410, 206–211.
Flamm, G., Glinsmann, W., Kritchevsky, D., Prosky, L., & Roberfroid, M. (2001). Inulin
and oligofructose as dietary fiber: A review of the evidence. Critical Reviews in
Food Science and Nutrition, 41, 353–362.
Flory, P., & Vrij, A. (1963). Melting points of linear-chain homologs. The normal paraffin hydrocarbons. Journal of the American Chemical Society, 85, 3548–
3553.
Fluckiger, F. A., & Hanbury, D. (1879). Pharmacographia: A history of the principal drugs
of vegetable origin met with in Great Britain and British India. London: Macmillan
and Co.
Fox, T. G., & Flory, P. J. (1950). Second-order transition temperatures and related
properties of polystyrene. I. Influence of molecular weight. Journal of Applied
Physics, 21, 581–591.
Franck, A. (2007). Technological functionality of inulin and oligofructose. British
Journal of Nutrition, 87, S287–S291.
French, A. D. (1988). Accessible conformations of the B-d-(2–1)-and-(2–6)-linked
d-fructans inulin and levan. Carbohydrate Research, 176, 17–29.
French, A. D., & Waterhouse, A. L. (1993). Chemical structure and characteristics. In
M. Suzuki, & N. J. Chatterton (Eds.), Science and technology of fructans (pp. 41–82).
CRC Press, Inc.
Giovambattista, N., Angell, C. A., Sciortino, F., & Stanley, H. E. (2004). The glass transition temperature of water: A simulation study. Physical Review Letters, 93,
047801.
Glibowski, P. (2010). Effect of thermal and mechanical factors on rheological properties of high performance inulin gels and spreads. Journal of Food Engineering,
99, 106–113.
Glibowski, P., & Bukowska, A. (2011). The effect of pH, temperature and heating time
on inulin chemical stability. Acta Scientiarum Polonorum Technologia Alimentaria,
10, 189–196.
Glibowski, P., Pikus, S., Jurek, J., & Kotowoda, M. (2014). Factors affecting inulin crystallization after its complete dissolution. Carbohydrate Polymers, 110, 107–112.
González-Herrera, S. M., Herrera, R. R., López, M. G., Rutiaga, O. M., Aguilar, C. N.,
Esquivel, J. C. C., et al. (2015). Inulin in food products: Prebiotic and functional
ingredient. British Food Journal, 117, 371–387.
Gonzalez-Tomás, L., Coll-Marqués, J., & Costell, E. (2008). Viscoelasticity of
inulin–starch-based dairy systems. Influence of inulin average chain length. Food
Hydrocolloids, 22, 1372–1380.
418
M.A. Mensink et al. / Carbohydrate Polymers 130 (2015) 405–419
Gordon, M., & Taylor, J. (1952). Ideal copolymers and the second-order transitions
of synthetic rubbers. I. Non-crystalline copolymers. Journal of Applied Chemistry,
2, 493–500.
Hébette, C. L., Delcour, J. A., Koch, M. H., Booten, K., Kleppinger, R., Mischenko, N.,
et al. (1998). Complex melting of semi-crystalline chicory (Cichorium intybus L.)
root inulin. Carbohydrate Research, 310, 65–75.
Hellwege, E. M., Czapla, S., Jahnke, A., Willmitzer, L., & Heyer, a. G. (2000). Transgenic potato (Solanum tuberosum) tubers synthesize the full spectrum of inulin
molecules naturally occurring in globe artichoke (Cynara scolymus) roots.
Proceedings of the National Academy of Sciences, 97, 8699–8704.
Heyer, A. G., Schroeer, B., Radosta, S., Wolff, D., Czapla, S., & Springer, J. (1998). Structure of the enzymatically synthesized fructan inulin. Carbohydrate Research, 313,
165–174.
Hinrichs, W. L., Prinsen, M. G., & Frijlink, H. W. (2001). Inulin glasses for the stabilization of therapeutic proteins. International Journal of Pharmaceutics, 215,
163–174.
Honda-Okubo, Y., Saade, F., & Petrovsky, N. (2012). AdvaxTM , a polysaccharide adjuvant derived from delta inulin, provides improved influenza vaccine protection
through broad-based enhancement of adaptive immune responses. Vaccine, 30,
5373–5381.
Imran, S., Gillis, R. B., Kok, M. S., Harding, S. E., & Adams, G. G. (2012). Application
and use of Inulin as a tool for therapeutic drug delivery. Biotechnology & Genetic
Engineering Reviews, 28, 33–45.
IUPAC-IUBMB Joint Commission on Biochemical Nomenclature. (1997). Nomenclature of carbohydrates. Journal of Carbohydrate Chemistry, 16(8), 1191–1280.
/>Karimi, R., Azizi, M. H., Ghasemlou, M., & Vaziri, M. (2015). Application of inulin in
cheese as prebiotic, fat replacer and texturizer: A review. Carbohydrate Polymers,
119, 85–100.
Kaur, N., & Gupta, A. (2002). Applications of inulin and oligofructose in health and
nutrition. Journal of Biosciences, 27, 703–714.
Kawai, K., Fukami, K., Thanatuksorn, P., Viriyarattanasak, C., & Kajiwara, K. (2011).
Effects of moisture content, molecular weight, and crystallinity on the glass
transition temperature of inulin. Carbohydrate Polymers, 83, 934–939.
Kelly, G. (2008). Inulin-type prebiotics – A review: Part 1. Alternative Medicine
Review, 13, 315–329.
Kelly, G. (2009). Inulin-type prebiotics – A review: Part 2. Alternative Medicine
Review, 14, 36–55.
Kim, D., Robyt, J. F., Lee, S.-Y., Lee, J.-H., & Kim, Y.-M. (2003). Dextran molecular size
and degree of branching as a function of sucrose concentration, pH, and temperature of reaction of Leuconostoc mesenteroides B-512FMCM dextransucrase.
Carbohydrate Research, 338, 1183–1189.
Kim, Y., Faqih, M. N., & Wang, S. S. (2001). Factors affecting gel formation of inulin.
Carbohydrate Polymers, 46, 135–145.
Kim, Y., & Wang, S. S. (2001). Kinetic study of thermally induced inulin gel. Journal
of Food Science, 66, 991–997.
Kitamura, S., Hirano, T., & Takeo, K. (1994). Conformation of (2→1)-beta-d-fructan
in aqueous solution. International Journal of Biological Macromolecules, 16,
313–317.
Klemm, D., Schmauder, H., & Heinze, T. (2005). Cellulose. Biopolymers online Wiley.
Kolida, S., Tuohy, K., & Gibson, G. R. (2007). Prebiotic effects of inulin and oligofructose. British Journal of Nutrition, 87, S193–S197.
Kruger, C. L. (2002). Generally recognised as safe (GRAS) notification for Frutafit® . Silver
Spring, MD: U.S. Food and Drug Administration.
Kuntz, M. G. F., Fiates, G. M. R., & Teixeira, E. (2013). Characteristics of prebiotic food
products containing inulin. British Food Journal, 115, 235–251.
Kurakake, M., Ogawa, K., Sugie, M., Takemura, A., Sugiura, K., & Komaki, T. (2008).
Two types of beta-fructofuranosidases from Aspergillus oryzae KB. Journal of
Agricultural and Food Chemistry, 56, 591–596.
L’homme, C., Arbelot, M., Puigserver, A., & Biagini, A. (2003). Kinetics of hydrolysis of
fructooligosaccharides in mineral-buffered aqueous solutions: Influence of pH
and temperature. Journal of Agricultural and Food Chemistry, 51, 224–228.
Leite, J., Martinelli, P., Murr, F., & Jin, K. (2004). Study of the inulin concentration by
physical methods. Drying, B, 868–875.
Lis, D. G., & Preston, L. A. (1998). U.S. Patent No. 5,840,884. Washington, DC: U.S.
Patent and Trademark Office.
Liu, J., Waterhouse, A. L., & Chatterton, N. J. (1994). Do inulin oligomers adopt a
regular helical form in solution? Journal of Carbohydrate Chemistry, 13, 859–872.
Livingston, D., Hincha, D., & Heyer, A. (2007). S. Norio, B. Noureddine, & O. Shuichi
(Eds.), The relationship of fructan to abiotic stress tolerance in plants (661) (pp.
181–199). Recent Advances in Fructooligosaccharides Research.
Lüscher, M., Erdin, C., Sprenger, N., Hochstrasser, U., Boller, T., & Wiemken, A. (1996).
Inulin synthesis by a combination of purified fructosyltransferases from tubers
of Helianthus tuberosus. FEBS Letters, 385, 39–42.
Marchessault, R. H., Bleha, T., Deslandes, Y., & Revol, J.-F. (1980). Conformation and
crystalline structure of (2→1)--d-fructofuranan (inulin). Canadian Journal of
Chemistry, 58, 2415–2422.
Maris, B., Verheyden, L., Van Reeth, K., Samyn, C., Augustijns, P., & Kinget, R. <ETAL>. (2001). Synthesis and characterisation of inulin-azo hydrogels designed for
colon targeting. International Journal of Pharmaceutics, 213, 143–152.
Martins, S. I. F. S., Jongen, W. M. F., Boekel, & Van, M. A. J. S. (2001). A review of
Maillard reaction in food and implications to kinetic modelling. Trends in Food
Science & Technology, 11, 364–373.
Matusek, A., Merész, P., Le, T. K. D., & Örsi, F. (2008). Effect of temperature and
pH on the degradation of fructo-oligosaccharides. European Food Research and
Technology, 228, 355–365.
McWeeny, D. J., Biltcliffe, D. O., Powell, R. C. T., & Spark, A. A. (1969). The Maillard
reaction and its inhibition by sulfite. Journal of Food Science, 34, 641–643.
Meyer, D., Bayarri, S., Tárrega, A., & Costell, E. (2011). Inulin as texture modifier in
dairy products. Food Hydrocolloids, 25, 1881–1890.
Moerman, F. T., Van Leeuwen, M. B., & Delcour, J. A. (2004). Enrichment of higher
molecular weight fractions in inulin. Journal of Agricultural and Food Chemistry,
52, 3780–3783.
Mutanda, T., Mokoena, M. P., Olaniran, a. O., Wilhelmi, B. S., & Whiteley, C. G. (2014).
Microbial enzymatic production and applications of short-chain fructooligosaccharides and inulooligosaccharides: Recent advances and current perspectives.
Journal of Industrial Microbiology & Biotechnology, 41, 893–906.
Naessens, M., Cerdobbel, A., Soetaert, W., & Vandamme, E. J. (2005). Leuconostoc
dextransucrase and dextran: Production, properties and applications. Journal of
Chemical Technology & Biotechnology, 80, 845–860.
Naskar, B., Dan, A., Ghosh, S., & Moulik, S. P. (2010a). Characteristic physicochemical features of the biopolymer inulin in solvent added and depleted states.
Carbohydrate Polymers, 81, 700–706.
Naskar, B., Dan, A., Ghosh, S., & Moulik, S. P. (2010b). Viscosity and solubility behavior
of the polysaccharide inulin in water, water + dimethyl sulfoxide, and water +
isopropanol media. Journal of Chemical & Engineering Data, 55, 2424–2427.
National Center for Biotechnology Information. (2015). PubChem Database. , pubchem.ncbi.nlm.nih.gov Accessed 03.27.15.
Oka, M., Ota, N., & Mino, Y. (1992). Studies on the conformational aspects of inulin
oligomers. Chemical Pharmaceutical Bulletin, 40, 1203–1207.
Orlando, R., Floreani, M., Padrini, R., & Palatini, P. (1998). Determination of inulin
clearance by bolus intravenous injection in healthy subjects and ascitic patients:
Equivalence of systemic and renal clearances as glomerular filtration markers.
British Journal of Clinical Pharmacology, 46, 605–609.
Ortiz-Soto, M. E., Olivares-Illana, V., & López-Munga, A. (2004). Biochemical properties of inulosucrase from Leuconostoc citreum CW28 used for inulin synthesis.
Biocatalysis and Biotransformation, 22, 275–281.
Ozimek, L. K., Kralj, S., van der Maarel, M. J. E. C., & Dijkhuizen, L. (2006). The levansucrase and inulosucrase enzymes of Lactobacillus reuteri 121 catalyse processive
and non-processive transglycosylation reactions. Microbiology, 152, 1187–1196.
Panchev, I., Delchev, N., Kovacheva, D., & Slavov, A. (2011). Physicochemical characteristics of inulins obtained from Jerusalem artichoke (Helianthus tuberosus L.).
European Food Research and Technology, 233, 889–896.
Phelps, C. F. (1965). The physical properties of inulin solutions. The Biochemical
Journal, 95, 41–47.
Pitarresi, G., Giacomazza, D., Triolo, D., Giammona, G., & San Biagio, P. L. (2012).
Rheological characterization and release properties of inulin-based hydrogels.
Carbohydrate Polymers, 88, 1033–1040.
Potter, A., & Hassid, W. (1948). Starch. II. Molecular weights of amyloses and amylopectins from starches of various plant origins. Journal of the American Chemical
Society, 70, 3774–3777.
Roberfroid, M. B., & Delzenne, N. M. (1998). Dietary fructans. Annual Review of Nutrition, 18, 117–143.
Rodriguez Furlán, L. T., Lecot, J., Pérez Padilla, A., Campderrós, M. E., & Zaritzky, N.
(2012). Stabilizing effect of saccharides on bovine plasma protein: A calorimetric
study. Meat Science, 91, 478–485.
Rodriguez Furlán, L. T., Pérez Padilla, A., & Campderrós, M. E. (2015). Improvement
of gluten-free bread properties by the incorporation of bovine plasma proteins
and different saccharides into the matrix. Food Chemistry, 170, 257–264.
Ronkart, S. N., Blecker, C. S., Fougnies, C., Van Herck, J. C., Wouters, J., & Paquot,
M. (2006). Determination of physical changes of inulin related to sorption
isotherms: An X-ray diffraction, modulated differential scanning calorimetry
and environmental scanning electron microscopy study. Carbohydrate Polymers,
63, 210–217.
Ronkart, S. N., Blecker, C. S., Fourmanoir, H., Fougnies, C., Deroanne, C., Van Herck,
J.-C., et al. (2007). Isolation and identification of inulooligosaccharides resulting
from inulin hydrolysis. Analytica Chimica Acta, 604, 81–87.
Ronkart, S. N., Deroanne, C., Paquot, M., Fougnies, C., & Blecker, C. S. (2010). Impact
of the crystallisation pathway of inulin on its mono-hydrate to hemi-hydrate
thermal transition. Food Chemistry, 119, 317–322.
Ronkart, S. N., Deroanne, C., Paquot, M., Fougnies, C., Lambrechts, J.-C., & Blecker,
C. S. (2007). Characterization of the physical state of spray-dried inulin. Food
Biophysics, 2, 83–92.
Ronkart, S. N., Paquot, M., Blecker, C. S., Fougnies, C., Doran, L., Lambrechts, J. C., et al.
(2008). Impact of the crystallinity on the physical properties of inulin during
water sorption. Food Biophysics, 4, 49–58.
Ronkart, S. N., Paquot, M., Deroanne, C., Fougnies, C., Besbes, S., & Blecker, C. S.
(2010). Development of gelling properties of inulin by microfluidization. Food
Hydrocolloids, 24, 318–324.
Ronkart, S. N., Paquot, M., Fougnies, C., Deroanne, C., & Blecker, C. S. (2009). Effect of
water uptake on amorphous inulin properties. Food Hydrocolloids, 23, 922–927.
Ronkart, S. N., Paquot, M., Fougnies, C., Deroanne, C., Van Herck, J.-C., & Blecker, C. S.
(2006). Determination of total water content in inulin using the volumetric Karl
Fischer titration. Talanta, 70, 1006–1010.
Saengthongpinit, W., & Sajjaanantakul, T. (2005). Influence of harvest time and
storage temperature on characteristics of inulin from Jerusalem artichoke
(Helianthus tuberosus L.) tubers. Postharvest Biology and Technology, 37, 93–100.
Sahiner, N., Sagbas, S., Yoshida, H., & Lyon, L. A. (2014). Synthesis and properties of
inulin based microgels. Colloids and Interface Science Communications, 2, 15–18.
Schaller-Povolny, L. A., Smith, D. E., & Labuza, T. P. (2000). Effect of water content
and molecular weight on the moisture isotherms and glass transition properties
of inulin. International Journal of Food Properties, 3, 173–192.
M.A. Mensink et al. / Carbohydrate Polymers 130 (2015) 405–419
Seifert, S., & Watzl, B. (2007). Inulin and oligofructose: Review of experimental data
on immune modulation. The Journal of Nutrition, 137, 2563S–2567S.
Silva, M. F., Rigo, D., Mossi, V., Golunski, S., Kuhn, G. D. O., Di Luccio, M., et al. (2013).
Enzymatic synthesis of fructooligosaccharides by inulinases from Aspergillus
niger and Kluyveromyces marxianus NRRL Y-7571 in aqueous-organic medium.
Food Chemistry, 138, 148–153.
Silver, B. S. (2000). World Patent No. WO/2000/011967. Geneva, Switzerland: World
Intellectual Property Organization.
Silver, B. S. (2002). U.S. Patent No. US 6,419,978. Washington, DC: U.S. Patent and
Trademark Office.
Stepto, R. F. T. (2009). Dispersity in polymer science (IUPAC Recommendations
2009). Pure and Applied Chemistry, 81, 351–353.
Stevens, C. V., Meriggi, A., & Booten, K. (2001). Chemical modification of inulin, a
valuable renewable resource, and its industrial applications. Biomacromolecules,
2, 1–16.
Suortti, T., Gorenstein, M. V., & Roger, P. (1998). Determination of the molecular
mass of amylose. Journal of Chromatography A, 828, 515–521.
Szczesniak, A. (1963). Classification of textural characteristics. Journal of Food Science,
28, 385–389.
Tanaka, T., Oi, S., & Yamamoto, T. (1980). The molecular structure of low and high
molecular weight levans synthesized by levansucrase. Journal of Biochemistry,
87, 297–303.
Tarantino, L. (2000). GRAS Notification for Hayashibara Trehalose. Silver Spring, MD:
U.S. Food and Drug Administration.
The editors of Encyclopaedia Brittanica. (2015). Inulin clearance. Encyclopaedia Brittanica. />Accessed 03.27.15
Timmermans, J. W., van Leeuwen, M. B., Tournois, H., de Wit, D., & Vliegenthart, J.
F. G. (1994). Quantitative analysis of the molecular weight distribution of inulin
by means of anion exchange HPLC with pulsed amperometric detection. Journal
of Carbohydrate Chemistry, 13, 881–888.
Toneli, J., Mürr, F., Martinelli, P., Dal Fabbro, I., & Park, K. J. (2007). Optimization
of a physical concentration process for inulin. Journal of Food Engineering, 80,
832–838.
Toneli, J., Park, K., Murr, F., & Martinelli, P. (2008). Rheological behavior of
concentrated inulin solution: Influence of soluble solids concentration and temperature. Journal of Texture Studies, 39, 369–392.
Toneli, J., Park, K., Negreiros, A., & Murr, F. (2010). Spray-drying process optimization
of chicory root inulin. Drying Technology, 28, 369–379.
Tonnis, W. F., Mensink, M. A., de Jager, A., van der Voort Maarschalk, K., Frijlink, H. W.,
& Hinrichs, W. L. J. (2015). Size and molecular flexibility of sugars determine the
storage stability of freeze-dried proteins. Molecular Pharmaceutics, 12, 684–694.
Tripodo, G., Pitarresi, G., Palumbo, F. S., Craparo, E. F., & Giammona, G. (2005). UVphotocrosslinking of inulin derivatives to produce hydrogels for drug delivery
application. Macromolecular Bioscience, 5, 1074–1084.
Tseng, Y.-C., Xiong, Y. L., & Boatright, W. L. (2008). Effects of inulin/oligofructose on
the thermal stability and acid-induced gelation of soy proteins. Journal of Food
Science, 73, E44–E50.
419
Tungland, B. C., & Meyer, D. (2002). Nondigsetible oligo- and polysaccharides
(dietary fiber): Their physiology and role in human health and food. Comprehensive Reviews in Food Science and Food Safety, 3, 90–109.
Van Arkel, J., Sévenier, R., Hakkert, J. C., Bouwmeester, H. J., Koops, A. J., & van der
Meer, I. M. (2013). Tailor-made fructan synthesis in plants: A review. Carbohydrate Polymers, 93, 48–56.
Van den Mooter, G., Vervoort, L., & Kinget, R. (2003). Characterization of methacrylated inulin hydrogels designed for colon targeting: In vitro release of BSA.
Pharmaceutical Research, 20, 303–307.
Van Duynhoven, J. P. M., Kulik, A. S., Jonker, H. R. A., & Haverkamp, J. (1999). Solid-like
components in carbohydrate gels probed by NMR spectroscopy. Carbohydrate
Polymers, 40, 211–219.
Van Loo, J., Coussement, P., De Leenheer, L., Hoebregs, H., & Smits, G. (1995).
On the presence of inulin and oligofructose as natural ingredients in
the western diet. Critical Reviews in Food Science and Nutrition, 35, 525–
552.
Vega, R., & Zuniga-Hansen, M. E. (2015). The effect of processing conditions on the
stability of fructooligosaccharides in acidic food products. Food Chemistry, 173,
784–789.
Velikov, V., Borick, S., & Angell, C. A. (2001). The glass transition of water, based on
hyperquenching experiments. Science, 294, 2335–2338.
Vereyken, I. J., Chupin, V., Islamov, A., Kuklin, A., Hincha, D. K., & de Kruijff, B. (2003).
The effect of fructan on the phospholipid organization in the dry state. Biophysical Journal, 85, 3058–3065.
Vereyken, I. J., van Kuik, J. A., Evers, T. H., Rijken, P. J., & de Kruijff, B. (2003).
Structural requirements of the fructan–lipid interaction. Biophysical Journal, 84,
3147–3154.
Vervoort, L., & Van den Mooter, G. (1997). Inulin hydrogels as carriers for colonic drug
targeting: I. Synthesis and characterization methacrylated inulin and hydrogel
formation. Pharmaceutical Research, 14, 1730–1737.
Vervoort, L., Vinckier, I., Moldenaers, P., Van den Mooter, G., Augustijns, P., & Kinget,
R. (1999). Inulin hydrogels as carriers for colonic drug targeting. Rheological
characterization of the hydrogel formation and the hydrogel network. Journal of
Pharmaceutical Sciences, 88, 209–214.
Visser, M. R., Baert, L., Klooster, G. V., Schueller, L., Geldof, M., Vanwelkenhuysen,
I., et al. (2010). Inulin solid dispersion technology to improve the absorption of
the BCS Class IV drug TMC240. European Journal of Pharmaceutics and Biopharmaceutics, 74, 233–238.
Wada, T., Sugatani, J., Terada, E., Ohguchi, M., & Miwa, M. (2005). Physicochemical characterization and biological effects of inulin enzymatically
synthesized from sucrose. Journal of Agricultural and Food Chemistry, 53, 1246–
1253.
Wolff, D., Czapla, S., Heyer, A. G., Radosta, S., Mischnick, P., & Springer, J. (2000).
Globular shape of high molar mass inulin revealed by static light scattering and
viscometry. Polymer, 41, 8009–8016.
Zimeri, J. E., & Kokini, J. L. (2002). The effect of moisture content on the crystallinity and glass transition temperature of inulin. Carbohydrate Polymers, 48,
1998–2003.