Evaluation of the production of exopolysaccharides by two strains of the thermophilic bacterium Rhodothermus marinus
Bạn đang xem bản rút gọn của tài liệu. Xem và tải ngay bản đầy đủ của tài liệu tại đây (940.63 KB, 8 trang )
Carbohydrate Polymers 156 (2017) 1–8
Contents lists available at ScienceDirect
Carbohydrate Polymers
journal homepage: www.elsevier.com/locate/carbpol
Evaluation of the production of exopolysaccharides by two strains of
the thermophilic bacterium Rhodothermus marinus
Roya R.R. Sardari a,∗ , Evelina Kulcinskaja b,1 , Emanuel Y.C. Ron a , Snỉdís Bjưrnsdóttir c ,
Ĩlafur H. Friðjónsson c , Gmundur Ĩli Hreggviðsson c,d , Eva Nordberg Karlsson a
a
Department of Biotechnology, Center for Chemistry and Chemical Engineering, Lund University, P.O. Box 124, 22100 Lund, Sweden
Biochemistryand Structural Biology, Department of Chemistry, Lund University, P.O. Box 124, 22100 Lund, Sweden
c
Matís ohf, Vinlandsleid 12, Reykjavik 113, Iceland
d
Faculty of Life and Environmental Sciences, University of Iceland, Askja, Reykjavik IS-101, Iceland
b
a r t i c l e
i n f o
Article history:
Received 27 May 2016
Received in revised form 18 August 2016
Accepted 18 August 2016
Available online 21 August 2016
Keywords:
Exopolysaccharide
EPS
Rhodothermus marinus
Heteropolymer
a b s t r a c t
The thermophile Rhodothermus marinus produces extracellular polysaccharides (EPSs) that forms a distinct cellular capsule. Here, the first data on EPS production in strains DSM4252T and MAT493 are reported
and compared. Cultures of both strains, supplemented with either glucose, sucrose, lactose or maltose
showed that the EPS were produced both in the exponential and stationary growth phase and that
production in the exponential phase was boosted by maltose supplementation, while stationary phase
production was boosted by lactose. The latter was higher, resulting in 8.8 (DSM4252T ) and 13.7 mg EPS/g
cell dry weight (MAT493) in cultures in marine broth supplemented with 10 g/L lactose. The EPSs were
heteropolymeric with an average molecular weight of 8 × 10⁴ Da and different monosaccharides, including arabinose and xylose. FT-IR spectroscopy revealed presence of hydroxyl, carboxyl, N-acetyl, amine,
and sulfate ester groups, showing that R. marinus produces unusual sulfated EPS with high arabinose and
xylose content.
© 2016 The Authors. Published by Elsevier Ltd. This is an open access article under the CC BY license
( />
1. Introduction
Extracellular polysaccharides (exopolysaccharides, EPSs) are
the major part of extracellular polymeric substances produced by
microorganisms (Jindal, Singh, & Khattar, 2011). They exist in two
main forms; as a capsule associated with the cell surface or secreted
out of the cell, either to the surroundings or remain loosely attached
to the cell surface (Tallon, Bressollier, & Urdaci, 2003). Exopolysaccharides have important ecological and physiological functions and
play special roles in protecting the microorganisms that produce
them. EPSs are believed to protect cells against antimicrobial substances, desiccation, bacteriophages, osmotic stress, and antibodies
(Mata et al., 2006; Tallon et al., 2003).
EPSs can be found as homopolysaccharides or heteropolysaccharides and can be decorated with other residues such as
phosphates, sulfates, N-acetyl-aminosugars, and acetyl groups
(Laws, Gu, & Marshall, 2001). The properties of the EPSs are
∗ Corresponding author.
E-mail address: (R.R.R. Sardari).
1
School of Chemistry, University of Nottingham, University Park, Nottingham,
NG7 2RD, UK.
influenced by their composition which is affected by nutrient availability as well as by other factors such as their molecular mass and
the location of functional groups.
The unique and complex chemical structures of EPSs, which
are natural polymers with different functional properties, make
them interesting for various industrial applications in food, pharmaceutical, petroleum and other industries (Castellane, Lemos,
& deMacedo Lemos, 2014), for example by affecting the fluidity of active compounds. Both prokaryotes (Gram-positive and
Gram-negative bacteria) and eukaryotes (fungi, some algea, and
phytoplankton) are known to produce EPSs and new species are
currently being targeted in the search for EPSs with novel properties. As a result of these screening efforts, marine bacteria are now
widely accepted as the source of EPSs with unique properties that
can be exploited for novel biotechnological processes (Chi & Fang,
2005).
Rhodothermus marinus is a thermophilic, reddish colored aerobic, and Gram-negative bacterium that was first isolated from
shallow marine hot springs in Iceland (Alfredsson, Kristjansson,
Hjörleifsdotter, & Stetter, 1988). The bacterium grows heterotrophically and is known to produce highly thermostable enzymes
(Nordberg Karlsson, Bartonek-Roxå, & Holst, 1998; Blücher,
Nordberg Karlsson, & Holst, 2000). It is of interest as repre-
/>0144-8617/© 2016 The Authors. Published by Elsevier Ltd. This is an open access article under the CC BY license ( />
2
R.R.R. Sardari et al. / Carbohydrate Polymers 156 (2017) 1–8
senting the deepest lineage in the phylum Bacteroidetes (Nolan,
Tindall, Pomrenke, Lapidus, & Copeland, 2009). The complete
genome sequence is available for the type strain and tools have
been developed for genetic manipulation of a second strain,
MAT493 (Bjornsdottir, Fridjonsson, Hreggvidsson, & Eggertsson,
2011; Bjornsdottir, Thorbjarnardottir, & Eggertsson, 2005). The
cells of R. marinus have been shown to form a distinct capsule when
grown on carbohydrate-rich medium (Alfredsson et al., 1988). To
our knowledge, however, no information is available on the production of EPSs by R.marinus, or on their physico-chemical properties.
The aim of this study was the evaluation of EPS production by the
R.marinus type strain (DSM 4252T ) as well as by a strain that is
amenable to engineering (MAT 493). The work involved the examination of the kinetics of EPS production in batch cultures using
shake flasks under varied nutritional conditions. Also, the isolation
and characterization of novel EPS from the two R.marinus strains
has opened possibilities for applying EPSs from R.marinus for industrial purposes.
this, cells were harvested by centrifugation, washed with water,
transferred to aluminum weighing pans and dried in an oven set
at 100 ◦ C. The cell dry weight was measured periodically until a
constant weight was reached.
2.5. Isolation of exopolysaccharides
Strains DSM 4252T and MAT 493 were grown as described in section 2.3, and the capsular EPS (in 0.5 ml samples) were separated as
described in section 2.4. Subsequently, the samples taken at different times from the cultivations were centrifuged at 4000 rpm for
30 min at 4 ◦ C (SigmaPK). The EPSs were precipitated by adding
the threefold volume of ethanol (99.5%) to the cell free supernatants. After mixing and storing overnight at 4 ◦ C, precipitates
were harvested by centrifugation at 4000 rpm for 30 min at 4 ◦ C
(Sigma 3–16PK) and put in a fume hood to evaporate the remaining ethanol. The precipitates then were dissolved in milliQ water
and lyophilized (Labconco freeze dry system) to obtain the crude
EPSs.
2. Materials and methods
2.1. Materials
All materials and reagents were purchased from Sigma-Aldrich
unless otherwise specified.
2.2. Bacterial strains
The R. marinus strains DSM 4252T and MAT 493 obtained from
the Matis culture collection, were used in the present study.
2.3. Culture conditions
R.marinus DSM 4252T was taken from the stock culture and inoculated in ATCC medium 1599: Thermus Enhanced Medium (ATCC
medium 1598) containing agar and 1% NaCl. The plate was incubated at 65 ◦ C for 24 h, after which the cells were transferred from
the plate into Marine broth (Difco 2216, USA) (10 ml) in a 50 ml
falcon tube and incubated in a rotary shaker incubator at 65 ◦ C and
200 rpm for 24 h.
R.marinus MAT 493 was inoculated directly from a stock culture
into Marine broth (10 ml) in a 50 ml falcon tube and incubated in a
rotary shaker incubator at 65 ◦ C and 200 rpm for 24 h.
After the first incubation, 0.25 ml (10%) of the produced cell cultures of both strains were separately inoculated into Marine broth
(2.5 ml) in 50 ml falcon tubes, and were grown for 8 h. The resulting cultures were subsequently used as inoculum for the shake flask
cultivations where EPS production was studied.
The cell cultures used for analysis of EPS production were grown
in marine broth (25 ml in 250 ml baffled shake flasks) containing the
sugars glucose, maltose, lactose, and sucrose, respectively, as additional carbon source at the concentrations 1 and 10 g/l. The cells
were inoculated with 2.5 ml (10%) of the inoculum and grown at
65 ◦ C and 200 rpm for 48 h in a shaking incubator (IKA, KS 4000 i
control). Samples were taken after 0, 6, 15, 24, and 48 h and were
analysed for residual carbon source and total produced EPSs. A
parallel control experiment was carried out using Marine broth
without carbon source supplementation.
2.4. Determination of cell biomass
Bacterial growth was quantitatively determined by measuring
cell dry weight. After centrifugation, cells were washed once in
water and then resuspended in 2 ml of 0.05 M EDTA sodium salt
solution (Horn et al., 2013). The mixture was shaken gently on
a rocking table at 4 ◦ C for 4 h to remove any capsular EPS. After
2.6. Purification and exopolysaccharide fractionation
The purity and size fractions of the crude EPS was examined by
size exclusion chromatography using a column of HiPrep Sephacryl
S-200 HR (16 mm × 600 mm) (HiPrep, GE healthcare life sciences).
Each crude EPS was dissolved in milliQ water (10 g/l) and after
filtration (13 mm syringe filter w/0.2 m PTFE membrane) was
loaded on the Sephacryl S-200 column. and eluted with milliQ
water at the flow rate of 0.3 ml/min. The flow rate was controlled
by a FPLC pumping system (Pharmacia LKB, Pump-500) and fractions were detected using refractive-index monitoring (ERC-7510,
ERMA INC) and collected every 10 min using a fraction collector
(LKB Bromma, 2212 HELIRAC).
2.7. Determination of molecular weight
For determination of molecular weight of the EPS fractions, standard dextrans (1.27, 5, 12, 50, and 80 kDa) (Sigma) were passed
through a Sephacryl S-200 column (16 mm × 600 mm) and the
retention time of each dextran was obtained from the chromatographic data. The retention times of the dextrans were plotted
against the logarithms of their respective molecular weights. The
molecular weights of the produced EPSs were then determined
using their retention time.
2.8. Monosaccharide analysis
The analysis of EPSs monosaccharide composition, produced at
different times during cultivation, and after fractionation by size
exclusion chromatography (Section 2.6) was done according the
hydrolysis method described by Sluiter, Hames, Ruiz, and Scarlata
(2008) with modifications.
Briefly, sulfuric acid (72%) was added to the isolated EPSs
and water was added after 30 min. The samples were heated
at 100 ◦ C for 3 h and neutralized after hydrolysis with 0.1 M
Ba(OH)2 ·H2 O. After centrifugation, the monosaccharide content of
the EPSs in the supernatants was analysed by High Performance
Anion-Exchange Chromatography (HPAEC) (ThermoFisher Scientific, Waltham, USA) using a Dionex CarboPac PA-20 analytical
column which was coupled to a Dionex CarboPac PA-20 guard column. The sugars were separated using NaOH (0.75 mM) as a mobile
phase with the flow rate of 0.5 ml/min and the column was regenerated with 200 mM NaOH for 4 min with the same flow rate at the
end of each cycle. Detection was performed with an ED40 electrochemical detector.
R.R.R. Sardari et al. / Carbohydrate Polymers 156 (2017) 1–8
2.9. Analysis of functional groups
Fourier transformed infrared (FT-IR) spectroscopy was used
to determine the functional groups of the purified EPSs. Infrared
spectra of the purified EPSs fractions were recorded in the
4000–400 cm−1 region using a FT-IR system (Nicolet is5, ThermoFisher Scientific).
The determinations were performed in two independent replicates and are reported as the mean with standard deviations.
3. Results and discussion
3.1. Growth and EPS production by the two R. marinus strains
The two R. marinus strains exhibited a distinct difference in
growth behaviour, with the strain DSM 4252T forming aggregates
while strain MAT 493 did not. Aggregation has been observed for
many R. marinus strains (Bjornsdottir et al., 2005), and it is now
known that bacteria predominantly live within surface-attached
biofilm structures in their natural habitats (Davey & O’Toole, 2000).
Biofilms offer several advantages, including protection from different stress factors (Jagmann, Henke, & Philipp, 2015; Monier
& Lindow, 2003). Bacteria within these structures are encased in
an extracellular matrix composed of secreted proteins, polysaccharides, DNA and other substances. The reason for the observed
difference in strains DSM 4252T and MAT 493 is unknown, as is the
mechanism of aggregation in R. marinus. In fact, the lack of aggregation was one of the reasons for choosing strain MAT 493 for the
development of methods for genetic manipulation, which require
the use of single colonies. The difference in aggregation, could however not be shown to be immediately related to the EPS production
level (Tables 1 and 2), which for both strains was initiated in the
exponential growth phase, but with some differences.
As initial trials with the type strain (DSM 4252T ) showed that
use of disaccharides as carbon source supplementation generally
resulted in higher EPS production than the use of monosaccharides
(data not shown), lactose, maltose and sucrose were selected as
the supplementation of the Marine broth and was used for both
strains. In addition, glucose was chosen as a respresentative of
monosaccharides, and a parallel growth experiment without additional added sugars was run to monitor the background production
of EPS (Figs. 1–4 ). The added carbon sources were supplied at
two concentrations, 1 g/L (Figs. 1 and 3) and 10 g/L (Figs. 2 and 4),
respectively.
Consumption of the monosaccharide glucose, and the disaccharides lactose and maltose was verified for the type strain (Fig. 1). In
all cases, production of EPS was initiated in the exponential growth
phase and was shown to continue in the stationary phase.
At the 1 g/L supplementation level (Fig. 1), the consumption rate
of glucose was determined to 0.13 g/l,h during the first 6 h and after
15h all glucose was consumed and the cell mass was 1.2 ± 0.14 g/l.
After glucose depletion, the change in cell concentration was
marginal during 9 h (reaching 1.25 ± 0.35 g/l after 24 h) but then
increased to 1.68 ± 0.16 g/l at 48 h. The late increase in cell concentration might be due to consumption of produced EPS, as it was
accompanied by a decrease in the ratio of produced EPS per cell dry
weight in the same period of time (from 7.4 × 10⁻⁵ to 6.2 × 10⁻⁵ ),
reaching a final EPS concentration of 1.04 ± 0.15 g/ml (at 48 h).
The experiments using marine broth without added sugar, showed
a slightly lower maximum cell mass (0.87 ± 0.03 g/l, after 24 h, in
principle maintained at the end of the cultivation, 0.85 ± 0.07 g/l
after 48 h) and the final EPS concentration was 0.75 ± 0.24 g/ml
(with a production rate of 0.014 g/ml,h after 48 h). This indicates
that the 1 g/L glucose-addition had a small boosting effect on both
cell mass and EPS production.
3
Addition of lactose did not stimulate cell growth, but resulted in
increased EPS production. The consumption rate of lactose during
the first 6 h was 0.03 g/l,h but increased to 0.095 g/l,h (6–15 h) until
all lactose was consumed (reaching a cell mass of 0.85 ± 0.21 g/l at
24 h). After 48 h the cell mass finally reached 0.95 ± 0.35 g/l, while
production of EPS continued (0.057 g/ml,h during the whole 48 h
of cultivation), reaching a final concentration of 2.75 ± 0.13 g/ml.
The cell mass obtained in maltose supplemented cultivations
resembled that of the glucose supplementation (1.3 ± 0.28 g/l after
15 h, maintained at 24 h as 1.4 ± 0.14 g/l, with an overall maltose
consumption rate of 0.036 g/l,h during 24 h) (Fig. 1). The EPS concentration in this case reached 3.3 ± 0.73 g/ml (after 48 h) which
was the highest observed at 1 g/L supplementation level, reaching a
production rate of 0.22 g/ml,h between 6–15 h, which decreased
to 0.031 g/ml,h in the stationary phase (24–48 h).
Sucrose supplemented cultivations were more difficult to interpret, as this substrate was not consumed by R.marinus DSM 4252T
(sucrose concentration was 0.87 ± 0.03 g/l after 48 h of cultivation).
The maximum cell concentration was 1.15 ± 0.21 g/l and the concentration of produced EPS was 1.98 ± 0.85 g/ml after 48 h. The
above results showed that although the effects on cell mass were
rather small, production of EPS increased upon addition of the disaccharides lactose (stationary phase) and maltose (primarily in the
exponential but also in the stationary phase).
A further increase in the concentration of added sugars to 10 g/l
resulted in a significant increase in the production of EPS (except
for sucrose added cultures), which was most pronounced for cultures with added lactose (Fig. 2, Table 1). No significant increase
in cell mass or growth rate was observed, and cell growth ceased
after 15 h at all conditions tested, which might be the consequence
of either oxygen limitation (which is difficult to control in shake
flasks) or more likely the decrease in pH observed (decreasing
from 7.2 to 5.03, 5.18, and 4.84 in glucose, lactose, and maltose
medium, respectively). At 10 g/L supplementation level it was also
observed that maltose was gradually degraded extracellularly to
glucose (from 6 h of cultivation).
Strain MAT 493 grew without visible aggregation and consumed
glucose, lactose and maltose with similar rates (0.14, 0.14, and
0.135 g/l.h, respectively) in media with 1 g/l supplementation of
the respective carbon source. In addition, strain MAT 493 could
consume sucrose (which was not the case for the type strain) with
a consumption rate of 0.065 g/l.h. All sugars were consumed within
15 h of cultivation.
In accordance with the type strain, production of EPS started
at the beginning of the cultivation and the concentration
of EPS increased during the exponential growth phase. After
24 h, the concentration of EPSs was 0.282 ± 0.03, 0.29 ± 0.08,
and 0.3 ± 0.18 g/ml with corresponding cell concentrations of
0.95 ± 0.07, 1 ± 0.28, and 0.8 ± 0.00 g/l in the presence of glucose,
maltose and sucrose, respectively. This shows that in this strain,
the production of EPS in the exponential growth phase in principle
was independent of the carbon source supplementation.
In the stationary phase, the levels of EPS were, however,
affected differently and depended on carbon source supplementation. In the media supplemented with 1 g/L sucrose and lactose,
respectively, the EPS concentration increased with time in the
stationary phase, in line with the pattern observed in lactose
supplemented cultivations of the type strain. For example, the
concentration of produced EPS in the medium containing lactose
was 0.2 ± 0.15 g/ml after 24 h (at a cell mass of 0.5 ± 0.14 g/l) and
then increased 0.46 ± 0.05 g/ml after 48 h. In cultivations supplemented with maltose, the amount of EPS was almost constant after
24 h, also in line with the general production pattern observed for
the type strain.
In both glucose supplemented and unsupplemented cultivations, there was an apparent decrease in cell mass in the stationary
4
R.R.R. Sardari et al. / Carbohydrate Polymers 156 (2017) 1–8
Table. 1
Evaluation of exopolysaccharide production and cell dry weight for R.marinus DSM 4252T grown in the presence of different sugars.
Type of sugar
Sugar concentration (g/l)
1
10
a
Glucose
Lactose
Maltose
Sucrose
a
b
b
EPS (g/ml)
CDW (g/ml)
EPS/CDW
EPS (g/ml)
CDW (g/ml)
EPS/CDW
1.04
2.75
3.3
1.98
1680
950
920
1150
6.0 × 10⁻⁴
2.8 × 10⁻³
3.5 × 10⁻³
1.7 × 10⁻³
2.56
8.4
5.41
1.04
700
950
1100
1050
3.6 × 10⁻³
8.8 × 10⁻³
4.9 × 10⁻³
9.0 × 10⁻⁴
Exopolysaccharide.
Cell dry weight.
Table 2
Evaluation of exopolysaccharide production and cell dry weight for R. marinus MAT 493 grown in the presence of different sugars.
Type of sugar
Sugar concentration (g/l)
1
10
a
Glucose
Lactose
Maltose
Sucrose
EPS (g/ml)
CDW (g/ml)
EPS/CDW
EPS (g/ml)
CDW (g/ml)
EPS/CDW
0.14
0.46
0.34
0.44
650
600
1050
550
2.0 × 10⁻⁴
7.0 × 10⁻⁴
3.0 × 10⁻⁴
8.0 × 10⁻⁴
0.58
8.21
7.68
0.24
400
600
750
650
1.4 × 10⁻³
1.37 × 10⁻²
1.02 × 10⁻²
3.0 × 10⁻⁴
2
0.5
1
0
0
12
24
36
Time (h)
Sucrose concentration &
cell dry weight (g/l)
1.5
3
2
0.5
1
0
0
12
24
36
Time (h)
48
1
0
0
0
4
1
2
0.5
48
2
0
1
12
24
36
Time (h)
48
3
1
2
0.5
1
0
0
0
12
24
36
Time (h)
48
2
Total EPS concentration
(μg/ml)
0
3
4
1.5
Total EPS concentration
(μg/ml)
1
1.5
2
M altose concentration &
cell dry weight (g/l)
3
4
Total EPS concentration
(μg/ml)
1.5
2
4
Cell dry weight (g/l)
Glucose concentration &
cell dry weight (g/l)
4
Lactose concentration &
cell dry weight (g/l)
2
Total EPS concentration
(μg/ml)
Exopolysaccharide.
Cell dry weight.
Total EPS concentration
(μg/ml)
a
b
b
1.5
3
1
2
0.5
1
0
0
0
12
24
36
Time (h)
48
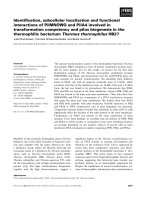
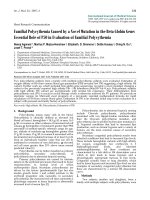
Fig. 1. Growth profile and EPS production of R.marinus DSM 4252T cultivated in marine broth containing (1 g/l) glucose, sucrose, lactose and maltose, separately and marine
broth without additional sugars as a control. Symbols indicate ( ) for cell dry weight, ( ) for total EPS concentration, and () for sugar concentration in the media. Results
are the mean of duplicate measurements.
phase. In the glucose supplemented medium this coincided with
a decrease in EPS concentration, indicating that there might be a
degradation of the EPS by active enzymes produced by the cells,
which may be released upon cell lysis (Mata et al., 2006). No corresponding decrease was however observed in the nonsupplemented
cultures (in that case the monitored EPS was 0.36 ± 0.029 g/ml at
24 h and 0.6 ± 0.12 g/ml at 48 h).
An increase in the amount of added sugar to 10 g/l resulted in
a higher relative production of EPS by strain MAT 493, for all the
tested carbon sources except sucrose (Fig. 4; Table 2), which is in
accordance with the pattern obtained for DSM 4252T (Table 1).
Degradation of the disaccharide to its monosaccharide components
(after 6 h of cultivation) was observed for maltose (in accordance
with the data for the type strain) but also for sucrose (resulting in
detection of both glucose and fructose). The increase in EPS productionin lactose and maltose supplemented cultures was also more
pronounced for MAT 493 (Table 2) than for DSM 4252T , while cell
mass production was approximately in the same range. The pH
value in the cultures containing glucose, lactose, sucrose and maltose was also shown to decrease significantly (to 4.65, 4.39, 4.47,
and 4.54, respectively after 48 h) and may be a reason for stopped
growth in shake flasks.
In conclusion, the relative efficiency of EPS production which is
the ratio of the total EPS to cell dry weight after 48 h, was evaluated
and showed that marine broth supplemented with 10 g/l lactose
resulted in the highest EPS production efficiency in both R.marinus
8
8
6
6
4
4
2
2
0
12
12
10
10
24
36
Time (h)
14
8
8
6
6
4
4
2
2
0
0
0
12
24
36
Time (h)
2
2
0
0
10
10
4
4
0
12
12
6
6
48
Maltose concentration &
cell dry weight (g/ l)
12
8
8
0
0
Sucrose concentration &
cell dry weight (g/ l)
14
12
24
36
Time (h)
48
14
12
12
10
10
8
8
6
6
4
4
2
2
0
0
0
48
Total EPS concentration
(µg/ml)
10
10
5
Total EPS concentration
(µg/ml)
12
Lactose concentration &
cell dry weight (g/ l)
12
Total EPS concentration
(µg/ml)
14
Total EPS concentration
(µg/ml)
Glucose concentration &
cell dry weight (g/ l)
R.R.R. Sardari et al. / Carbohydrate Polymers 156 (2017) 1–8
12
24
36
Time (h)
48
0.5
1
0
0
12
24
Time (h)
36
Sucrose concentration &
cell dry weight (g/l)
2
4
1.5
3
1
2
0.5
1
0
0
0
12
24
36
Time (h)
48
2
0.5
1
0
0
0
48
12
24
Time (h)
36
48
4
1.5
3
1
2
0.5
3
1
2
0.5
1
0
0
0
2
Cell dry weight (g/l)
0
3
1
4
1.5
1
Total EPS concentration
(μg/ml)
2
1.5
2
M altose concentration &
cell dry weight (g/l)
1
4
Lactose concentration &
cell dry weight (g/l)
3
Total EPS concentration
(μg/ml)
Glucose concentration &
cell dry weight (g/l)
1.5
Total EPS concentration
μg( /ml)
2
4
12
24
36
Time (h)
48
Total EPS concentration
(μg/ml)
2
Total EPS concentration
(μg/ml)
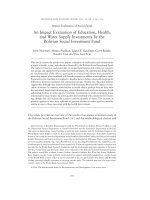
Fig. 2. Growth profile and EPS production by R.marinus DSM 4252T cultivated in marine broth containing (10 g/l) glucose, sucrose, lactose and maltose, separately and marine
broth without additional sugars as a control. Symbols indicate ( ) for cell dry weight, ( ) for total EPS concentration, () for sugar concentration in the medium, and (×) for
glucose concentration. Results are the mean of duplicate measurements.
0
0
0
6 12 18 24 30 36 42 48
Time (h)
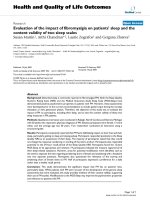
Fig. 3. Growth profile and EPS production by R.marinus MAT 493 cultivated in marine broth containing (1 g/l) glucose, sucrose, lactose and maltose, separately and marine
broth without additional sugars as a control. Symbols indicate ( ) for cell dry weight, ( ) for total produced monosaccharide concentration, and () for sugar concentration
in the media. Results are the mean of duplicate measurements.
DSM 4252T and MAT 493 followed by marine broth containing
10 g/l maltose (Tables 1 and 2) Using these two carbon sources DSM
4252T was shown to produce a higher amount of EPS/CDW at lower
concentration of the carbon source, while strain MAT 493 appeared
to be more dependent on the amount of carbon source supplied for
its EPS production.
3.2. Purification and fractionation of the exopolysaccharide
The crude exopolysaccharides obtained from the different supplemented cultures of R.marinus DSM 4252T and MAT 493 were
fractionated using size exclusion chromatography as described in
section 2.6. Results showed one major peak for each sample, which
corresponded to a high molecular weight fraction. The retention
time of the major peak in the crude EPSs from R.marinus DSM 4252T
in the media containing glucose, lactose, maltose, sucrose, and the
medium without additional sugars was 138.35, 138.56, 134.14, 138,
and 135.41 min, which corresponded to molecular weights of 73.8,
73.5, 80.8, 74.4, and 78.6 kDa, respectively. Also, the retention times
of the major peak in the crude EPSs from R.marinus MAT 493 in
the media containing glucose, lactose, maltose, sucrose, and the
medium without additional sugars was 130.07, 133.33, 131.49,
10
10
8
8
6
6
4
4
2
2
0
0
14
12
12
10
10
6
6
4
4
2
2
0
0
0
12
24
36
Time (h)
48
M altose concentration &
cell dry weight (g/l)
8
8
2
2
0
Total EPS concentration
(μg/ml)
Sucrose concentration &
cell dry weight (g/l)
10
10
4
4
0
0
12
12
6
6
0 6 12 18 24 30 36 42 48
Time (h)
14
8
8
Total EPS concentration
(μg/ml)
12
12
12
24
36
Time (h)
48
14
12
12
10
10
8
8
6
6
4
4
2
2
0
Total EPS concentration
(μg/ml)
Glucose concentration &
cell dry weight(g/l)
14
Lactose concentration &
cell dry weight (g/l)
R.R.R. Sardari et al. / Carbohydrate Polymers 156 (2017) 1–8
Total EPS concentration
(μg/ml)
6
0
0
12
24
36
Time (h)
48
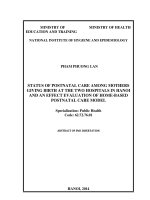
Fig. 4. Growth profile and EPS production by R.marinus MAT 493 cultivated in marine broth containing (10 g/l) glucose, sucrose, lactose and maltose, separately and marine
broth without additional sugars as a control. Symbols indicate ( ) for cell dry weight, ( ) for total produced monosaccharide concentration, () for sugar concentration in
the media, ( × ) for glucose concentration, and (* ) for fructose concentration. Results are the mean of duplicate measurements.
130.01, and 128.81 min corresponding to a molecular weight of
88.1, 82.2, 85.5, 88.2, and 90.5 kDa, respectively (Supplementary
data). Generally, the EPSs produced by marine bacteria are often
linear with an average molecular weight ranging from 1 × 10⁵ to
3 × 10⁵ Da (Poli, Anzelmo, & Nicolaus, 2010) which is compatible
with the molecular weight of our produced EPSs.
3.3. Characterization of EPS monosaccharide content
After hydrolysis, the monosaccharide composition of the purified EPSs was analysed by HPAEC-PAD and the analysis showed that
all the EPSs were heteropolysaccharides (Table 3). The main components of the pure EPSs from R.marinus DSM 4252T were xylose,
arabinose, and glucose. Also, there was a mixture of galactose with
glucosamine, and a mixture of mannose with an amino sugar which
might be N-acetyl-glucosamine or N-acetyl-galactosamine (data
not shown). Quantification of those components was however not
possible due to overlapping peaks.
Analysis of the pure EPSs from MAT 493 allowed quantification
of glucose, arabinose, xylose, and mannose (Table 3). Also in this
strain, there was a small quantity of galactose and galactosamine.
In all EPSs chromatograms there were three unidentified peaks
which needs to be further investigated since the identification of
them with the known monosaccharide standards was not successful (Supplementary data).
Arabinose and xylose are not common sugars in bacterial EPSs
(Ahmed et al., 2013; Nichols et al., 2005). Thus, it can be claimed
that the EPSs produced by the R. marinus strains are unique bacterial EPSs. Interestingly, the ratio of monosaccharides also differs
between the two strains, indicating that EPS from the respective
strains may be useful for different purposes.
3.4. Functional group analysis
In order to investigate the functional groups of the purified EPSs
of R.marinus DSM 4252T and R.marinus MAT 493 FT-IR spectroscopy
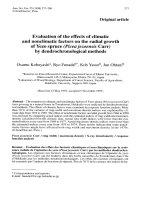
was used (Fig. 5), and band assignments were made according to
literature data.
The IR spectra of the purified EPSs of R.marinus DSM 4252T from
all media showed the same functional groups (Fig. 5A) and exhibited a broad peak at around 3335 cm−1 (range 3600–3200 cm−1 )
for O H stretching vibration of the polysaccharide (Kavita, Singh,
Mishra, & Jha, 2014) and two weak C H stretching bands at
2924 and 2855 cm−1 . The peak at 2359 cm−1 was attributed to
NH stretching absorption band and the peak at 1652 cm−1 corresponded to a C O stretching vibration of the N-acetyl group
or protonated carboxylic acid (Ahluwalia & Goyal, 2005; Lillo,
Cabello, Cespedes, Caro, & Perez, 2014). Also, at 1540 cm−1 a peak
was observed which was assigned to the N H deformation vibration of an amine group (Lillo et al., 2014). The peak at 1521
was assigned to the secondary amid group (Ahluwalia & Goyal,
2005). Another peak at 1418 cm−1 could be attributed to the symmetric stretching of the COO− group (Zhao, Yang, Yang, Jiang,
& Zhang, 2007). The peak at 1217 cm−1 corresponded to an O-SO group that is an evidence of sulfate esters (Na et al., 2010)
and the peak at 1103 cm−1 might be assigned to O-acetyl ester
linked uronic acid (Kavita et al., 2014). The strong absorption at
1039 cm−1 in the range of 1200–1000 cm−1 which is anomeric
region, was attributed to C O C and C O groups in polysaccharides and suggested that the monosaccharide in the EPS has
pyranose ring (Vijayabaskar, Babinastarlin, Shankar, Sivakumar, &
Anandapandian, 2011). The weak absorption at 910 and 890 cm−1
was assigned to the coexistance of ␣ and ß glycosidic bond (Lim
et al., 2005). The peak at 818 cm−1 can determined the exact position of 6- sulfate of D-galactose unit (C6-O-S) (Maciel et al., 2008;
Prado-Fernández, Rodrı´ıguez-Vázquez, Tojo, & Andrade, 2003). The
weak absorption at 845 cm−1 demonstrated the presence of 4sulfate of D-galactose (C4-O-S) (Prado-Fernández et al., 2003). The
peak at 770 cm−1 might be attributed to the (S-F) stretching absorption band (Pretsch, Fernández, Alvarez, 2000) and the absorption
peak at 600 cm−1 was attributed to stretching of alkyl- halides
(Kavita et al., 2014).
According to FT-IR band assignments of the purified EPSs
of R.marinus DSM 4252T from marine broth with and without
added sugars, the EPS contains sulfated polysaccharides of complex structure containing uronic acids. Sulfated exopolysaccharide
derivatives are known to have advantageous properties, in partic-
R.R.R. Sardari et al. / Carbohydrate Polymers 156 (2017) 1–8
7
Table 3
The monosaccharide composition of EPS produced by the R.marinus strains DSM 4252T and MAT 493.
Type of sugar
Marine broth
Marine broth + glucose
Marine broth + sucrose
Marine broth + maltose
Marine broth + lactose
a
R.marinus DSM 4252T
R. marinus MAT 493
Glucose
Arabinose
Xylose
Glucose
Arabinose
Xylose
Mannose
1
1
1
1
1
3.4
2.45
1.57
2.13
1.57
5.76
4.93
3.35
4.11
3.72
4.99
1
1
1
–a
1
1.59
4.71
3.75
–a
1.47
1.51
3.6
3.02
–a
1.24
1.27
3.34
1.87
–a
Quantification of monosaccharide components from MAT 493 grown in marine broth + lactose, not possible due to overlapping peaks.
Fig. 5. FT-IR spectrum of the purified exopolysaccharide from (A) R.marinus DSM 4252T and (B) R.marinus MAT 493.
ular as therapeutic substances. Best known are heparin (extracted
from porcine intestinal mucosa as anticoagulant and antithrombotic agent in the prevention and treatment of venous thrombosis)
and fucoidan from Brown seaweed, which has been reported having
a range of bioactive properties. Sulfated EPS from bacterial origin
are less well known, but mauran, a highly polyanionic sulfated
8
R.R.R. Sardari et al. / Carbohydrate Polymers 156 (2017) 1–8
EPS produced by the halophilic bacterium Halomonas maura, has
been reported to have antioxidant, antihemolytic and antithrombogenic activities (Raveendran et al., 2013). Novel polysaccharides
from bacterial origin offer an alternative to the well-known animal
varieties and will also expand the potential range of activities and
potency of EPS derived health promoting agents.
The FT-IR spectra of the purified EPSs of R.marinus 493 (Fig. 5B)
was in principle similar to FT-IR spectra of R.marinus DSM 4252T .
However, the peak at 910 cm−1 had strong absorption which corresponded to a ß-glycosidic bond and the peak at 818 cm−1 was
absent.
4. Conclusion
In conclusion, both R.marinus DSM 4252T and R.marinus MAT
493 produced exopolysaccharides. Different nutritional conditions
influenced the production of the EPSs. The highest EPS production
efficiency was however for both strains found in marine broth supplemented by lactose followed by a maltose supplemented marine
broth. Monosaccharide analysis showed that the produced EPSs are
heteropolysaccharides mainly consisting of xylose and arabinose.
The FT-IR spectrum of the EPSs showed the presence of sulfate
and carboxyl groups which demonstrated that they contain uronic
acids. It also revealed the presence of amino sugars together with
acetyl group. The unusual functional groups and monosaccharide
composition makes the EPS of R. marinus interesting for further
studies, motivating more detailed analysis of its chemical structure
and such studies are in progress.
Acknowledgment
The authors gratefully acknowledge the EU FP7 program
SEABIOTECH for financial support.
Appendix A. Supplementary data
Supplementary data associated with this article can be found, in
the online version, at />062.
References
Ahluwalia, S. S., & Goyal, D. (2005). Removal of heavy metals by waste tea leaves
from aqueous solution. Engineering in Life Sciences, 5, 158–162.
Ahmed, Z., Wang, Y., Anjum, N., Ahmad, H., Ahmad, A., & Raza, M. (2013).
Characterization of new exopolysaccharides produced by coculturing of L.
kefiranofaciens with yoghurt strains. International Journal of Biological
Macromolecules, 59, 377–383.
Alfredsson, G. A., Kristjansson, J. K., Hjörleifsdotter, S., & Stetter, K. O. (1988).
Rhodothermus marinus, gen. nov., sp. nov., a thermophilic, halophilic bacterium
from submarine hot springs in Iceland. Microbiology, 134, 299–306.
Bjornsdottir, S. H., Thorbjarnardottir, S. H., & Eggertsson, G. (2005). Establishment
of a gene transfer system for Rhodothermus marinus. Applied Microbiology and
Biotechnology, 66, 675–682.
Bjornsdottir, S. H., Fridjonsson, O. H., Hreggvidsson, G. O., & Eggertsson, G. (2011).
Generation of targeted deletions in the genome of Rhodothermus marinus.
Applied and Environmental Microbiology, 77, 5505–5512.
Blücher, A., Nordberg Karlsson, E., & Holst, O. (2000). Substrate-dependent
production and some properties of a thermostable, ␣-galactosidase from
Rhodothermus marinus. Biotechnology Letters, 22, 663–669.
Castellane, T. C. L., Lemos, M. V. F., & deMacedo Lemos, E. G. (2014). Evaluation of
the biotechnological potential of Rhizobium tropici strains for
exopolysaccharide production. Carbohydrate Polymers, 111, 191–197.
Chi, Z., & Fang, Y. (2005). Exopolysaccharides from marine bacteria. Journal of
Ocean University of China, 4, 67–74.
Davey, M. E., & O’Toole, G. A. (2000). Microbial biofilms: From ecology to molecular
genetics. Microbiology and Molecular Biology Reviews, 64, 847–867.
Horn, N., Wegmann, U., Dertli, E., Mulholland, F., Collins, S., & Waldron, K. (2013).
Spontaneous mutation reveals influence of exopolysaccharide on Lactobacillus
johnsonii surface characteristics. PUBLIC LIBRARY OF SCIENCE, 8, e59957.
Jagmann, N., Henke, S., & Philipp, B. (2015). Cells of Escherichia coli are protected
against severe chemical stress by co-habiting cell aggregates formed by
Pseudomonas aeruginosa. Applied Microbiology and Biotechnology, 99,
8285–8294.
Jindal, N., Singh, D. P., & Khattar, J. I. S. (2011). Kinetics and physico-chemical
characterization of exopolysaccharides produced by the cyanobacterium
Oscillatoria formosa. World Journal of Microbiology and Biotechnology, 27,
2139–2146.
Kavita, K., Singh, V. K., Mishra, A., & Jha, B. (2014). Characterisation and anti-biofilm
activity of extracellular polymeric substances from Oceanobacillus iheyensis.
Carbohydrate Polymers, 101, 29–35.
Laws, A., Gu, Y., & Marshall, V. (2001). Biosynthesis, characterisation, and design of
bacterial exopolysaccharides from lactic acid bacteria. Biotechnology Advances,
19, 597–625.
Lillo, L., Cabello, G., Cespedes, C. L., Caro, C. A., & Perez, J. (2014). Structural studies
of the exopolysaccharide produced by a submerged culture of
entomopathogenic fungus Metarhizium anisopliae. Boletín Latinoamericano Y
Del Caribe De Plantas Medicinales Y Aromáticas, 13, 359–365.
Lim, J. M., Joo, J. H., Kim, H. O., Kim, H. M., Kim, S. W., Hwang, H. J., et al. (2005).
Structural analysis and molecular characterization of exopolysaccharides
produced by submerged mycelial culture of Collybia maculata TG-1.
Carbohydrate Polymers, 61, 296–303.
Maciel, J. S., Chaves, L. S., Souza, B. W. S., Teixeira, D. I. A., Freitas, A. L. P., Feitosa, J.
P. A., et al. (2008). Structural characterization of cold extracted fraction of
soluble sulfated polysaccharide from red seaweed Gracilaria birdiae.
Carbohydrate Polymers, 71, 559–565.
Mata, J. A., Béjar, V., Llamas, I., Arias, S., Bressollier, P., Tallon, R., et al. (2006).
Exopolysaccharides produced by the recently described halophilic bacteria
Halomonas ventosae and Halomonas anticariensis. Research in Microbiology, 157,
827–835.
Monier, J. M., & Lindow, S. E. (2003). Differential survival of solitary and aggregated
bacterial cells promotes aggregate formation on leaf surfaces. Proceedings of
the National Academy of Sciences, 100, 15977–15982.
Na, Y. S., Kim, W. J., Kim, S. M., Park, J. K., Lee, S. M., Kim, S. O., et al. (2010).
Purification, characterization and immunostimulating activity of water-soluble
polysaccharide isolated from Capsosiphon fulvescens. International
Immunopharmacology, 10, 364–370.
Nichols, C., Lardière, S., Bowman, J., Nichols, P., & Gibson, J. (2005). Chemical
characterization of exopolysaccharides from antarctic marine bacteria.
Microbial Ecology, 49, 578–589.
Nolan, M., Tindall, B. J., Pomrenke, H., Lapidus, A., & Copeland, A. (2009). Complete
genome sequence of Rhodothermus marinus type strain (R-10T ). Standards in
Genomic Sciences, 1, 283–290.
Nordberg Karlsson, E., Bartonek-Roxå, E., & Holst, O. (1998). Evidence for substrate
binding of a recombinant thermostable xylanase originating from
Rhodothermus marinus. FEMS Microbiology Letters, 168, 1–7.
Poli, A., Anzelmo, G., & Nicolaus, B. (2010). Bacterial exopolysaccharides from
extreme marine habitats: Production, characterization and biological
activities. Marine Drugs, 8, 1779–1802.
Prado-Fernández, J., Rodrı´ıguez-Vázquez, J. A., Tojo, E., & Andrade, J. M. (2003).
Quantitation of -, l- and -carrageenans by mid-infrared spectroscopy and
PLS regression. Analytica Chimica Acta, 480, 23–37.
Pretsch, E., Fernández, A. H., & Alvarez, R. M. (2000). Tablas para la determinación
estructural por métodos espectroscópicos. Springer-Verlag Ibérica.
Raveendran, S., Palaninathan, V., Chauhan, N., Sakamoto, Y., Yoshida, Y., Maekawa,
T., et al. (2013). In vitro evaluation of antioxidant defense mechanism and
hemocompatibility of mauran. Carbohydrate Polymers, 98, 108–115.
Sluiter, A., Hames, B., Ruiz, R., & Scarlata, C. (2008). Determination of structural
carbohydrates and lignin in Biomass. Technical report NREL/TP-510-42618.
Tallon, R., Bressollier, P., & Urdaci, M. C. (2003). Isolation and characterization of
two exopolysaccharides produced by Lactobacillus plantarum EP56. Research in
Microbiology, 154, 705–712.
Vijayabaskar, P., Babinastarlin, S., Shankar, T., Sivakumar, T., & Anandapandian, K.
(2011). Quantification and characterization of exopolysaccharides from
Bacillus subtilis (MTCC 121). Advances in Biological Research, 5, 71–76.
Zhao, M., Yang, N., Yang, B., Jiang, Y., & Zhang, G. (2007). Structural characterization
of water-soluble polysaccharides from Opuntia monacantha cladodes in
relation to their anti-glycated activities. Food Chemistry, 105, 1480–1486.