Interactions between fava bean protein and dextrans produced by Leuconostoc pseudomesenteroides DSM 20193 and Weissella cibaria Sj 1b
Bạn đang xem bản rút gọn của tài liệu. Xem và tải ngay bản đầy đủ của tài liệu tại đây (623.54 KB, 9 trang )
Carbohydrate Polymers 190 (2018) 315–323
Contents lists available at ScienceDirect
Carbohydrate Polymers
journal homepage: www.elsevier.com/locate/carbpol
Interactions between fava bean protein and dextrans produced by
Leuconostoc pseudomesenteroides DSM 20193 and Weissella cibaria Sj 1b
T
⁎
Yan Xu , Leena Pitkänen, Ndegwa Henry Maina, Rossana Coda, Kati Katina, Maija Tenkanen
Department of Food and Nutrition, University of Helsinki, P.O. Box 66, FI-00014, Helsinki, Finland
A R T I C LE I N FO
A B S T R A C T
Keywords:
Dextran
Fava bean protein isolate
Lactic acid bacteria
Interaction
Rheological property
The aim of this study was to study the interactions between dextran and fava bean protein. Two dextrans
produced by Leuconostoc pseudomesenteroides DSM 20193 and Weissella cibaria Sj 1b were purified and mixed
with fava bean protein isolate (FPI) in water or in different buffers. The two isolated dextrans presented a typical
dextran structure, mainly α-(1 → 6) linkages (above 95%) and few α-(1 → 3) branches, but they differed in molar
mass and conformation. Dry-heating incubation of FPI and dextran mixture facilitated the conjugation of dextran
to FPI through the Maillard reaction. Both mixed and conjugated systems were further heat-treated, and different
influences of the formed covalent bonds on rheological properties were observed. The W. cibaria Sj 1b dextran
had a much higher gel-strengthening ability than the Ln. pseudomesenteroides DSM 20193 dextran. The intermolecular FPI-dextran interactions played an important role in stabilizing the mixed systems at different pH.
1. Introduction
Fava bean (Vicia faba L.) is a widely grown crop utilized for food
and animal feed in many countries (Duc, 1997). The seeds contain
protein (29%) and starch (39%), with the remainder comprising vitamins, minerals, and dietary fibers (Jezierny, Mosenthin, & Bauer,
2010). The functionality of fava bean protein for food uses, especially as
a protein isolate, has been studied at the laboratory scale, where it has
shown good solubility, emulsifying, foaming, and gelling properties
(Boye, Zare, & Pletch, 2010; Cai, Klamczynska, & Baik, 2001). However, the utilization of fava bean protein isolate (FPI) in the food industry is still minor, despite of its high nutritional value and the increasing global interest in plant-based proteins (Boye et al., 2010).
Dextrans are α-glucan polymers that contain consecutive α-(1 → 6)
linkages in the main chain and α-(1 → 2), α-(1 → 3), or α-(1 → 4) in the
branch (Bounaix et al., 2009). They have been approved for food use in
Europe since 2001 (European Commission, 2001). Dextrans produced in
situ by lactic acid bacteria (LAB) are drawing increasing attention in the
food industry due to their good performance in increasing bread volume, improving the texture, and retarding the staling of wheat sourdough bread (Katina et al., 2009; Korakli, Rossmann, Gänzle, & Vogel,
2001; Tieking, Korakli, Ehrmann, Gänzle, & Vogel, 2003). Due to their
long history of safe use, LAB are preferable for producing dextrans in
situ during fermentation, which is a potential approach for replacing
hydrocolloid additives in food products (Katina et al., 2009; Wolter,
Hager, Zannini, Czerny, & Arendt, 2014).
The interactions between polysaccharides and proteins are well
known in food related systems (de Kruif & Tuinier, 2001; Turgeon,
Beaulieu, Schmitt, & Sanchez, 2003). Recent investigations into the
interactions between whey proteins and dextrans have revealed that the
formation of covalent bonds between these two polymers through the
Maillard reaction changed the rheological properties of whey proteindextran mixture (Spotti et al., 2014a, 2014b; Spotti et al., 2013).
However, little is known regarding the interactions between legume
proteins and dextrans, although the texture of legume-based doughs can
be considerably modified by dextrans (Xu, Coda et al., 2017; Xu, Wang
et al., 2017). The increasing interest in legume proteins suggests that a
better understanding of legume protein-dextran interactions under
different conditions could increase the application of dextrans in legume-based food products.
The objective of the present study was to investigate the molecular
interactions between FPI and dextran under different conditions.
Leuconostoc pseudomesenteroides DSM 20193 was chosen due to its high
dextran-producing ability, and Weissella cibaria Sj 1b was chosen because of the high gel-strengthening ability of the dextran it produced, as
indicated in our previous study (Xu, Wang et al., 2017). Dextrans from
these two strains were purified, and their structures, molar mass distributions, and rheological behaviors were assessed. The intermolecular
Abbreviations: FPI, fava bean protein isolate; LAB, lactic acid bacteria; NMR, nuclear magnetic resonance; SEC, size-exclusion chromatography; SDS-PAGE, sodium dodecyl sulfatepolyacrylamide gel electrophoresis
⁎
Corresponding author.
E-mail address: xu.z.yan@helsinki.fi (Y. Xu).
/>Received 12 December 2017; Received in revised form 21 January 2018; Accepted 26 February 2018
Available online 01 March 2018
0144-8617/ © 2018 Elsevier Ltd. All rights reserved.
Carbohydrate Polymers 190 (2018) 315–323
Y. Xu et al.
Table 1
Composition of fava bean protein isolate (FPI) solution, dextran solutions from Leuconostoc pseudomesenteroides DSM 20193 (DX_LP) and Weissella cibaria Sj 1b (DX_WC), and FPI/dextran
(FPI/DX) mixtures and conjugates.
Sample code
FPI (g)
Dextran (g)
Dextran producer
Water (ml)
Incubation time (days)
FPI
DX_LP
DX_WC
FPI/DX mixture
FPI/LP_M a
FPI/WC_M
FPI/DX conjugate
FPI/LP_C b
FPI/WC_C
1.2
0
0
0
1.2
1.2
Ln. pseudomesenteroides DSM 20193
W. cibaria Sj 1b
6
6
6
0
0
0
1.2
1.2
1.2
1.2
Ln. pseudomesenteroides DSM 20193
W. cibaria Sj 1b
6
6
0
0
1.2
1.2
1.2
1.2
Ln. pseudomesenteroides DSM 20193
W. cibaria Sj 1b
6
6
6
6
a
b
M indicates a mixture.
C indicates a conjugate formed by dry-heating (Maillard reaction).
twice with D2O, filtered and placed in NMR tubes (Wilmad NMR Tubes,
Aldrich chemical company, USA). All the measurements were performed at 50 °C, and the chemical shifts were referenced to acetone
(1H = 2.225 ppm and 13C = 31.55 ppm).
interactions between dextran and FPI were generated by mixing these
two polymers together, and the intramolecular interactions between
these two were formed through the Maillard reaction. The formation of
FPI/dextran (FPI/DX) conjugates was confirmed by sodium dodecyl
sulfate-polyacrylamide gel electrophoresis (SDS-PAGE). In order to
study the effect of dextran on protein gelation, the FPI/DX mixtures and
conjugates were further heated, and the rheological properties were
evaluated. Finally, the effects of pH on rheological properties of FPI/DX
mixtures were studied. To the best of our knowledge, this is the first
study on legume protein-dextran interactions.
2.4. Size-exclusion chromatography
The molar mass distributions of dextrans were analyzed by sizeexclusion
chromatography
(SEC)
using
a
DMSO-based
(DMSO + 0.01 M LiBr) eluent according to Maina et al. (2014). Dextran
was analyzed at a concentration of 1 mg/ml after four days of dissolution in DMSO. The SEC data were processed with the OmniSEC 4.5
software (Viscotek Corp.), and the dn/dc value of 0.072 ml/g was used
(Basedow, Ebert, & Ruland, 1978).
2. Experimental
2.1. Microbial strains and materials
Leuconostoc pseudomesenteroides DSM 20193 was purchased from
Leibniz Institute DSMZ (Braunschweig, Germany). Weissella cibaria Sj
1b was obtained from the culture collection of the Division of Food
Hygiene and Environmental Health, University of Helsinki. Fava bean
flour (Vicia faba L. var. major) was purchased from CerealVeneta
(Padova, Italy), and the composition was reported earlier (Xu, Wang
et al., 2017).
2.5. Preparation of FPI/DX mixtures and conjugates
Composition of the obtained FPI was: protein (92.0 ± 4.1%), water
(6.6 ± 0.3%), carbohydrate (1.5 ± 0.0%), lipid (1.3 ± 0.0%), and
ash (4.8 ± 0.0%). The purity of dextrans produced by Ln. pseudomesenteroides DSM 20193 and W. cibaria Sj 1b was 92.8 ± 6.1% and
81.9 ± 3.9%, respectively. FPI and dextrans were used as such in this
study. The FPI/DX mixtures and conjugates were prepared with FPI and
dextran at a constant concentration of 20% (w/v) according to Spotti
et al. (2014a). In brief, dextran powder (1.2 g) was dispersed in 6 ml of
Milli-Q water overnight, followed by the addition of FPI powder (1.2 g).
After thoroughly mixing, the FPI/DX mixture was further freeze-dried.
Then, the obtained powder was heated at 60 °C with 63% relative humidity for 6 days in order to facilitate the formation of FPI/DX conjugate. The powders of FPI/DX mixtures and conjugates were dissolved
in 6 ml of Milli-Q water 24 h before further analysis. FPI suspension
(20%) without dextran was prepared as a control. The influence of dry
matter changes after dextran addition was eliminated by mixing sucrose
(1.2 g) with FPI (1.2 g) in 6 ml Milli-Q water as a reference mixture. All
samples were prepared in duplicate. Details about sample preparation
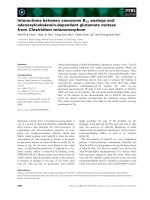
and evaluation are listed in Table 1 and Fig. 1.
2.2. Preparation of FPI
FPI was obtained by isoelectric precipitation (Makri, Papalamprou,
& Doxastakis, 2006) and freeze-drying. The composition of the FPI was
analyzed according to AOAC official methods 925.10 (moisture) and
923.03 (ash). Protein content was measured with the Lowry assay
(Lowry, Rosebrough, Farr, & Randall, 1951) using Bio-Rad DC™ Protein
Assay Kit I (Bio-Rad, USA). Carbohydrate content was calculated by
analyzing free sugars and starch after sulfuric acid hydrolysis (Xu,
Wang et al., 2017). Lipid content was measured according to Lampi
et al. (2015).
2.3. Dextran purification and structure elucidation
2.6. SDS-PAGE
LAB were grown on De Man, Rogosa, and Sharpe (MRS) agar supplemented with 5% sucrose at 30 °C for four days. The produced slimes
were removed carefully from the plates and purified according to a
previously reported method (Maina, Tenkanen, Maaheimo, Juvonen, &
Virkki, 2008). The purity of the isolated dextran was evaluated by
hydrolyzing dextran (10 mg) in 1 M sulfuric acid (2 ml) at 100 °C for
2 h, and quantifying the released glucose according to Xu, Wang et al.
(2017). Dextran purity was calculated as the percentage ratio between
the released glucose amount and the initial dextran amount. The
structure of the purified dextrans was analyzed by nuclear magnetic
resonance (NMR) spectroscopy on a 600 MHz Bruker Avance III NMR
spectrometer (Bruker BioSpin, Germany) using the Bruker 1D NOESY
pulse program (noesygppr1d). Samples (10 mg/ml) were exchanged
FPI, FPI/DX mixtures (FPI/LP_M and FPI/WC_M), and conjugates
(FPI/LP_C and FPI/WC_C) were analyzed by SDS-PAGE with 12% resolving gel using a Mini Protein II dual slab cell system (Bio-Rad
Laboratories, USA) according to Laemmli (1970). FPI/DX mixtures and
conjugates (50 mg) were dissolved in 1 ml of 0.1 M Tris-HCl buffer (pH
6.8) with 10% glycerol, 2% SDS, 1% β-mercaptoethanol, and 0.02%
bromophenol blue, followed by heating in a boiling water bath for
5 min. The loading volume was 15 μl, and the running voltage was
150 V. After this, different staining techniques were performed. Proteins were stained with Coomassie Brilliant Blue solution (0.1%) and
distained with a mixture of methanol (20%) and acetic acid (20%).
316
Carbohydrate Polymers 190 (2018) 315–323
Y. Xu et al.
Fig. 1. Schematic summary of sample preparation and evaluation. FPI and dextran mixtures were also studied at a pH range of 3.0–6.0.
2.9. Dynamic oscillatory rheology
Glycoproteins were stained using Periodic acid-Schiff (PAS) staining
technique (Zacharius, Zell, Morrison, & Woodlock, 1969).
The dynamic moduli (G', G”) were recorded as a function of frequency from 0.1 to 10 Hz by HAAKE RheoStress rheometer at 20 °C,
using a parallel plate system (1 mm gap). Measurements were conducted in duplicate after sample equilibration.
2.7. Browning intensity and glycosylation degree
The brown color development was evaluated by measuring the absorbance at 420 nm with a UV-1800 spectrophotometer (Shimadzu,
Japan). FPI, FPI/DX mixtures, and conjugates were all diluted to a
protein concentration of 5 mg/ml with 0.1 M NaOH. Measurements
were performed in triplicate.
The modification degree of the primary amino groups was determined indirectly by the specific reaction between O-Phthalaldehyde
(OPA, Sigma-Aldrich) and free primary amino groups in proteins, as
described by Spotti et al. (2013). FPI/DX mixtures and conjugates were
diluted to a protein concentration of 3 mg/ml, and measurements were
performed in triplicate. Glycosylation degree (GD) was calculated according to the following equation:
2.10. Heat treatment
FPI, FPI/DX mixtures, and conjugates were incubated in a water
bath at 90 °C for 15 min. After cooling to room temperature, the rheological properties were evaluated as described in Sections 2.8 and 2.9.
2.11. Effect of pH on FPI/DX mixtures
FPI and FPI/DX mixtures were dispersed thoroughly to their original
concentration in 0.1 M sodium citrate buffer at different pH (6.0, 5.0,
4.0, and 3.0). Then, the rheological properties were evaluated as described in Section 2.8 and 2.9.
GD = (Am − Ac)/Ac × 100%
where Am is the absorbance of the mixture and Ac the absorbance of
the conjugate.
2.12. Statistical analysis
Data were analyzed by one-way analysis of variance (ANOVA) using
Origin 8.6 (OriginLab Inc., USA). Means were compared using Tukey’s
test (P < 0.05).
2.8. Viscosity flow curves and hysteresis loops
The viscosity of dextran solutions at different concentrations (up to
22%) were measured under shear rates from 2 to 100 1/s (up and down
sweeps) by a HAAKE RheoStress rheometer (RS 50, HAAKE Rheometer,
Germany), and only the values at 100 1/s were used. Then, the plots of
shear viscosity as a function of dextran concentration were plotted.
The viscosity flow curves of FPI, FPI/DX mixtures, and conjugates were
analyzed by the same method used for dextran solutions. The hysteresis loop
area between the upward and downward flow curves was calculated using
the RheoWin Pro software. Measurements were conducted in duplicate.
3. Results and discussion
3.1. Dextran properties
3.1.1. Structure
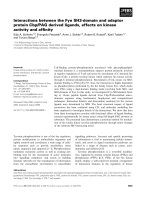
The structures of the isolated dextrans were analyzed by NMR spectroscopy. As shown in Fig. 2A, dextrans from Ln. pseudomesenteroides DSM
317
Carbohydrate Polymers 190 (2018) 315–323
Y. Xu et al.
Fig. 2. The 1D 1H spectra (A) and molar mass distributions (B) of dextrans from Ln. pseudomesenteroides DSM 20193 (DX_LP) and W. cibaria Sj 1b (DX_WC) and the Mark-Houwink plots of
the two dextrans (C). Squares represent molar mass and lines represent detector signals (B).
3.1.2. Macromolecular properties
The chromatograms of DX_LP and DX_WC are overlapped (Fig. 2B),
suggesting a similar hydrodynamic size for both samples (SEC is a sizebased separation technique). A small peak before the main peak was
found in the chromatogram of DX_LP. This pre-peak was clearly visible
in the light-scattering and viscosity signals and might indicate the
presence of aggregates in the solution (Fig. S1, Supplementary data).
The viscometric radius (Rη) across the peaks for both samples are also
very similar, as suggested by the similar elution volumes of the two
samples (Fig. S1). However, despite the similar elution volumes, the
20193 (DX_LP) and W. cibaria Sj 1b (DX_WC) both presented a similar
structure to the commercial dextran produced by Ln. mesenteroides B512F
(Maina et al., 2008). The peak around 4.98 ppm in 1H spectra revealed a
typical α-(1 → 6) chain-extending anomeric signal, and the anomeric signal
around 5.32 ppm indicated the α-(1 → 3) linked branches in dextran
(Maina et al., 2008). The degree of branching determined from the relative
intensities of the 1H anomeric signals was about 5.8% for DX_LP and 4.1%
for DX_WC, which were similar values to those found for dextrans produced
by Leuconostoc spp. and Weissella spp. (Maina et al., 2008; Shukla et al.,
2014).
318
Carbohydrate Polymers 190 (2018) 315–323
Y. Xu et al.
Table 2
Molar mass averages (Mw, Mn), polydispersity indices (Mw/Mn), average intrinsic viscosity [η], average viscometric radius (Rη), Mark-Houwink α values, and critical overlap concentrations (c*) of the dextrans from Ln. pseudomesenteroides DSM 20193 (DX_LP) and W. cibaria Sj 1b (DX_WC).
Sample code
Mw a(103 g/mol)
Mn b(103 g/mol)
Mw/Mn
[η] (ml/g)
Rη (nm)
α
c* (%)
DX_LP
DX_WC
4379
2452
3801
1993
1.15
1.23
109
81
41.00
29.86
0.45
0.58
8
9
a
b
Weight-average molar mass.
Number-average molar mass.
concentration (c*) (Fig. S2), indicating a typical behavior of random
coil polymers in aqueous solution (Morris, Cutler, Ross-Murphy, Rees, &
Price, 1981). In the dilute region below c*, the viscosity-concentration
plot showed a lower slope when compared with the slope above c*,
pronouncing the lesser dependence of viscosity on concentration in this
region. The c* was approximately 8% for DX_LP and was 9% for DX_WC
(Table 2). The slightly higher c* of DX_WC might be because of its lower
molar mass, since higher c* values are normally found in dextran solutions with lower molar mass (Pinder, Swanson, Hebraud, & Hemar,
2006). The dynamic rheological behavior of dextran solutions (22%)
was also studied, with the two solutions showing a liquid-like behavior
(Fig. S3). This agrees with the conclusion that dextrans could not form
gels due to their flexible structures in aqueous solution (McCurdy et al.,
1994).
molar masses across the peaks differed significantly between the two
samples, with DX_LP possessing a higher molar mass than DX_WC
(Fig. 2B). This difference in the relationship between size and molar
mass of the samples reflects differences in molecular density, and DX_LP
was denser than DX_WC. The density difference can also be seen in
Mark-Houwink plots (Fig. 2C), in which intrinsic viscosity ([η]) was
plotted against molar mass. The plot slope is lower for DX_LP than for
DX_WC, indicating a difference in solution conformation between the
two dextrans (Pitkänen, Virkki, Tenkanen, & Tuomainen, 2009). This
difference might be due to the number and the length of branches on
dextran chains. DX_LP contains more branches than DX_WC, as confirmed by NMR analysis. The branches in DX_LP might be also longer, as
suggested by its higher molecular density.
The average values for molar mass, intrinsic viscosity, and viscometric radius of the two dextrans also differed (Table 2). When compared with DX_LP, the weight-average molar mass of DX_WC was approximately two times lower, but in the same order of magnitude. The
two dextrans showed similar polydispersity indices (Mw/Mn). In addition, the intrinsic viscosity values, as well as the Mark-Houwink α values, indicated that both dextrans adopted a compact conformation in
solution (Maina et al., 2014). The sample recovery rates in the SEC
analysis were both below 50%, since dextrans with high molar mass are
not completely soluble in DMSO-based eluent. Therefore, the SEC
analysis only reveals the differences between the soluble parts of the
two dextrans.
3.2. Conjugation of dextran to FPI
3.2.1. SDS-PAGE
As reported by Spotti et al. (2014a), smaller polysaccharides have
easier access to protein amino acid groups, resulting in a higher extent
of the Maillard reaction. Therefore, a high content of dextran (20%)
was used in order to facilitate the Maillard reaction, since the dextrans
used in this study possess a high molar mass (106 Da). The conjugation
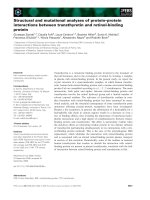
of dextran to FPI was confirmed by SDS-PAGE. Proteins were identified
by Coomassie brilliant blue staining (Fig. 3A) and glycoproteins by PAS
staining (Fig. 3B). The characteristic bands of the proteins in FPI
changed after incubation. In detail, lanes 1, 2 and 4, corresponding to
FPI, FPI/LP_M and FPI/WC_M, respectively, showed the same bands,
whereas these characteristic bands were diminished in lanes 3 and 5,
which correspond to FPI/LP_C and FPI/WC_C, respectively. Furthermore, a broad band was observed near the top of the separating gel in
lanes 3 and 5, indicating the formation of compounds with high molar
3.1.3. Rheological behavior
Consistent with previous studies (McCurdy, Goff, Stanley, & Stone,
1994; Tirtaatmadja, Dunstan, & Boger, 2001), the two dextran solutions
(up to 22%) both showed a Newtonian behavior (Fig. S2). The plots of
shear viscosity as a function of concentration for the purified dextrans
both presented two distinct regions separated by a critical overlap
Fig. 3. SDS-PAGE of protein marker (M), FPI (1), FPI/DX mixtures: FPI/LP_M (2) and FPI/WC_M (4), and FPI/DX conjugates: FPI/LP_C (3) and FPI/WC_C (5). A: Coomassie Brilliant Blue
stain; B: Periodic Acid-Schiff (PAS) stain.
319
Carbohydrate Polymers 190 (2018) 315–323
Y. Xu et al.
Table 3
The browning intensity (A420), Glycosylation degree (GD), viscosity, hysteresis loop area, G' and tan δ of FPI solution, dextran solutions from Ln. pseudomesenteroides DSM 20193 (DX_LP)
and W. cibaria Sj 1b (DX_WC), FPI/DX mixtures, and conjugates with or without heat treatment.
Sample code
A
FPI
FPI_H
DX_LP
FPI/LP_M
FPI/LP_M_H G
FPI/LP_C
FPI/LP_C_H
DX_WC
FPI/WC_M
FPI/WC_M_H
FPI/WC_C
FPI/WC_C_H
Heat
A420
−D
+F
−
−
+
−
+
−
−
+
−
+
0.26
ns
ns
0.42
ns
0.48
ns
ns
0.40
ns
0.43
ns
± 0.02
a
± 0.01
bc
± 0.01
b
± 0.03
c
± 0.02
bc
GD
(%)
Viscosity B(Pa s)
Loop area (104 Pa/s)
G' C(Pa)
tan δ
0
0
0
0
0
7.24
7.24
0
0
0
6.62
6.62
0.11 ± 0.01 a
1.18 ± 0.14 a
2.34 ± 0.03 a
11.10 ± 0.56 b
16.17 ± 1.43 c
11.07 ± 1.32 b
13.83 ± 0.14 bc
2.26 ± 0.12 a
10.34 ± 0.01 b
16.81 ± 0.23 c
10.94 ± 0.81 b
16.57 ± 0.93 c
ns E
0.75 ± 0.09 a
ns
6.79 ± 0.41 b
9.96 ± 0.85 c
6.78 ± 0.89 b
8.27 ± 0.04 bc
ns
6.62 ± 0.01 b
10.66 ± 0.20 c
6.97 ± 0.54 b
10.46 ± 0.61 c
0.82 ± 0.51 a
133.15 ± 31.33 bc
11.09 ± 0.26 a
105.61 ± 4.56 bd
199.43 ± 2.24 ce
130.88 ± 8.99 bc
205.65 ± 32.90 ce
28.37 ± 1.87 ad
238.10 ± 5.3 e
1045.74 ± 11.03 f
177.24 ± 6.07 bce
700.51 ± 21.8 g
2.96
0.44
1.74
1.40
1.14
1.11
0.84
1.48
1.03
0.59
0.96
0.46
±
±
±
±
±
±
±
±
±
±
±
±
1.99
0.06
0.06
0.03
0.01
0.02
0.11
0.01
0.06
0.07
0.02
0.02
a
a
a
a
a
a
a
a
a
a
a
a
a–g
Values in the same column with different letters are significantly different (p < 0.05).
Details about sample code can be found in Table 1.
Values were taken at the shear rate of 100 1/s.
C
Values were taken at the frequency of 1.0 Hz.
D
Without heat treatment.
E
ns = not shown.
F
With heat treatment (90 °C, 15 min).
G
H stands for heat treatment.
A
B
3.3. Interactions between FPI and dextran
mass in the conjugates (Liu, Zhao, Zhao, Ren, & Yang, 2012). However,
molar mass determination of the FPI/DX conjugates was not possible by
SDS-PAGE.
PAS staining revealed the presence of glycoproteins only in lanes 3
and 5, where the featured pink band appeared at the top of the stacking
and separating gel (Fig. 3B). Therefore, the conclusion can be drawn
that FPI/DX conjugates were formed in FPI/LP_C and FPI/WC_C
through the Maillard reaction. Similar electrophoretic patterns have
also been observed in other studies using different protein/polysaccharide mixtures (Liu et al., 2012; Spotti et al., 2014a, 2014b).
3.3.1. Viscosity
The addition of dextran considerably increased the viscosity of FPI,
as shown by the viscosity values of FPI/DX mixtures (Table 3), confirming the viscosity-improving ability of dextrans reported in our
previous studies (Xu, Coda et al., 2017; Xu, Wang et al., 2017). The
addition of the same amount of sucrose, as a reference, did not change
the viscosity of FPI (results not shown). The viscosity was slightly
higher for FPI/LP_M than for FPI/WC_M, pointing to the effect of molar
mass on viscosity. Very similar viscosity values were found between the
mixed and conjugated systems with the same dextran, indicating that
the Maillard reaction between FPI and dextran has no obvious influence
on viscosity.
The influence of heat treatment on FPI/DX mixtures and conjugates
was studied as heat treatment is an important method in food processing, and there is no study on the effect of dextran on protein gelation
during heat treatment. Varying viscosity increases were observed after
heat treatment (Table 3). In detail, the viscosity of the FPI solution
increased from 0.11 Pa s to 1.18 Pa s after heat treatment, indicating a
thickening effect caused by heat-induced gelation of FPI. This thickening effect was more obvious in FPI/DX mixtures and conjugates.
Generally, the viscosity increases were higher in mixed systems than in
conjugated systems, suggesting that the intermolecular interactions
between FPI and dextran play a major role in viscosity improvements.
The covalent bonds formed through the Maillard reaction had a greater
effect on the viscosity increase of FPI/LP_C, since the viscosity of FPI/
LP_C did not significantly increased after heating, unlike FPI/WC_C,
which showed a significantly higher viscosity value after heating. This
difference might be attributable to the differences in molar mass and
conformation between the two dextrans. However, more work is still
needed to study the behavior and function of dextrans in legume protein-based systems during heat treatment.
3.2.2. Browning intensity and glycosylation degree
The browning intensity was measured as an index of the Maillard
reaction process. Among the measured samples, FPI showed the lowest
absorbance at 420 nm (Table 3). With dextran mixed, the absorbance of
FPI/LP_M and FPI/WC_M both increased due to the brown color of the
dextran solution itself. The absorbance was higher for the conjugated
samples (FPI/LP_C and FPI/WC_C) than for the mixed samples (FPI/
LP_M and FPI/WC_M), indicating the appearance of browning compounds in the conjugates. However, no significant difference was found
between the absorbance of mixed and conjugated samples with the
same dextran, indicating a limited occurrence of the Maillard reaction
between FPI and dextran. A limited extent of the Maillard reaction was
also observed previously between a peanut protein isolate and commercial dextrans (Liu et al., 2012).
The glycosylation degree, which was measured indirectly by a
specific reaction between amino acids and OPA, was used to describe
the percentage of amino acids involved in the Maillard reaction.
According to Table 3, the glycosylation degree was slightly higher for
FPI/LP_C (7.24%) than for FPI/WC_C (6.62%), corresponding to its
higher absorbance value at 420 nm. Compared with the glycosylation
degree reported by other researchers using whey protein and commercial dextrans (Spotti et al., 2013; Sun et al., 2011), the glycosylation
degree of FPI in this study is lower. Possible reasons could include
structural differences between whey and fava bean proteins and molar
mass differences among the dextrans used, since smaller polysaccharides have an easier access to amino acid groups, resulting in a
higher extent of the Maillard reaction (Spotti et al., 2014a). The weightaverage molar mass of the dextrans used in this study are much higher
than those used by Spotti et al. (2013) and Sun et al. (2011), which
could explain the lower glycosylation degree.
3.3.2. Hysteresis loop
Hysteresis loops are observed in viscoelastic materials during the
shear rate sweep, and materials with larger hysteresis loop showed
better structural reversibility (Purwandari, Shah, & Vasiljevic, 2007). In
the present study, hysteresis loops were observed in all FPI/DX mixtures and conjugates (Fig. S4), and the loop areas were used to evaluate
the effects of dextran addition on structural reversibility. The loop areas
320
Carbohydrate Polymers 190 (2018) 315–323
Y. Xu et al.
of FPI and dextran solutions are not shown as they remained as Newtonian fluids (Table 3). After heat treatment, the FPI solution showed a
thixotropic behavior and had the lowest loop area compared with
dextran-added samples, revealing a positive effect of dextran on
structural reversibility. Similar to the observations on viscosity, the
Maillard reaction had no obvious influence on hysteresis loop areas of
systems before heat treatment. However, heat treatment promoted the
influence, since FPI/WC_C showed a significantly higher loop area after
heat treatment, while FPI/LP_C did not. This suggested the susceptibility of the system with dextran from Ln. pseudomesenteroides DSM
20193 to interaction changes during heating process, similar to the
phenomenon observed on viscosity increases in this system.
3.3.3. Dynamic oscillatory rheology
The dynamic rheological properties of samples with or without heat
treatment were all evaluated, as these properties are associated with the
functions of food proteins with gelling properties. Heat-induced gelation is frequently observed in globular protein solutions and was also
observed in our study. Without heat treatment, FPI solution showed a
liquid-like behavior (Fig. S5A). However, after heat treatment, it
showed a solid-like behavior (Fig. S5B), and the G' value, as a measure
of gel stiffness, increased considerably from 0.82 Pa to 133.15 Pa
(Table 3). Consistent with the result reported by Spotti et al. (2014b),
the addition of dextran increased the gel stiffness of both mixed systems
(FPI/LP_M and FPI/WC_M), with a higher gel stiffness in FPI/WC_M.
After heat treatment, a significantly higher gel stiffness was observed in
FPI/WC_M_H (1045.74 Pa), when compared with FPI/LP_M_H
(199.43 Pa). Furthermore, FPI/WC_M_H presented a lower dependence
of G' on frequency than FPI/LP_M_H, indicating a more stable gel
structure (Fig. 4).
The value of tan δ, which is an index of relative viscoelasticity, also
indicated different effects of the two dextrans on fava bean protein
gelation (Table 3). Compared to the systems with Ln. pseudomesenteroides DSM 20193 dextran, a lower tan δ was found in systems with W.
cibaria Sj 1b dextran after heat treatment, suggesting a more rigid
character of the gels formed in these systems (Spotti et al., 2014b). This
further confirmed the high gel-strengthening ability of the dextran from
W. cibaria Sj 1b, as first observed in our previous study (Xu, Wang et al.,
2017). The gel-strengthening ability of dextrans in protein solutions
might be due to the microphase separation between protein and dextran
molecules and the low entropy of the mixing process (Spotti et al.,
2014b; Turgeon et al., 2003).
In contrast to the findings of Spotti et al. (2014a) and Sun et al.
(2011), the formation of covalent bonds in FPI/LP_C did not reduce the
gel stability or gel stiffness (Fig. 4 and Table 3). However, the covalent
bonds formed in FPI/WC_C reduced the gel stiffness, especially after
heat treatment, but had no obvious effect on gel stability. This could be
partially explained by the difficulties in forming disulfide bonds by the
conjugates, as these bonds are responsible for the formation of protein
networks. Moreover, in conjugated systems, the steric hindrance generated by the dextran-protein conjugation may also suppress the intermolecular interactions (mostly hydrophobic interactions) between
neighboring proteins in aqueous solution (Spotti et al., 2014a). The
differences in gel stiffness of the mixed and conjugated systems with
different dextrans suggested a possible effect of the molar mass and
conformation of the dextran on gelation of FPI. One hypothesis is that
W. cibaria Sj 1b dextran was a good filler in the protein network, contributing to protein network consolidation. However, further work is
still needed.
Fig. 4. Frequency sweeps of FPI/LP mixtures and conjugates without (FPI/LP_M, FPI/
LP_C) or with heat treatment (FPI/LP_M_H, FPI/LP_C_H) (A) and FPI/WC mixtures and
conjugates without (FPI/WC_M, FPI/WC_C) or with heat treatment (FPI/WC_M_H, FPI/
WC_C_H) (B).
structure. The viscosity of FPI solutions was affected by pH, and in very
acidic buffer, fava bean proteins started to form precipitates, resulting
in inhomogeneous solutions. For this reason, the viscosity, hysteresis
loop areas, G', and tan δ values of FPI solutions at pH of 4.0 and 3.0 are
not shown (Table 4). The addition of dextran considerably increased the
viscosity of the FPI at different pH, with all systems showing a typical
shear-thinning behavior (Fig. S6). In samples with Ln. pseudomesenteroides DSM 20193 dextran (FPI/LP), the viscosity was the highest at pH
6.0 and lowest at pH 4.0, which is close to the isoelectric point of fava
bean protein (Sosulski & McCurdy, 1987). Interestingly, in samples with
W. cibaria Sj 1b dextran (FPI/WC), the viscosity did not change significantly at different pH (Table 4). Previous reports have indicated that
dextrans remain unaffected by changes in pH during acidification
(McCurdy et al., 1994), and the ionic strength and pH only influence
protein self-association in systems with proteins and nonionic polysaccharides, e.g., dextran (Syrbe, Bauer, & Klostermeyer, 1998). This
could explain the low viscosity value of FPI/LP_4, since fava bean
proteins are aggregated at its isoelectric point. However, the minor
viscosity changes in FPI/WC system at different pH indicated a stabilizing ability of the dextran against protein aggregation. The effects of
pH on the hysteresis loop areas of the two systems with different dextrans were similar to those observed for viscosity, with W. cibaria Sj 1b
dextran showing a stabilizing function (Table 4).
3.4. Effects of pH on FPI-dextran interactions
3.4.2. Dynamic oscillatory rheology
The G' values of FPI solutions at pH 6.0 and pH 5.0 were significantly lower when compared with other samples mixed with dextrans (Table 4). In FPI/LP system, the highest gel stiffness was found for
FPI/LP_6 and the lowest for FPI/LP_3. Generally, the G' value was
3.4.1. Viscosity and hysteresis loop
As dextrans are produced by LAB, together with a lowered pH, the
effects of pH on rheology of FPI/DX mixtures were studied, in order to
understand the role of dextran in the maintenance of fermented food
321
Carbohydrate Polymers 190 (2018) 315–323
Y. Xu et al.
Table 4
Viscosity, hysteresis loop area, G', and tan δ of FPI and FPI/DX mixtures at different pH values (6.0, 5.0, 4.0, 3.0).
Sample code
A
FPI_6
FPI_5
FPI_4
FPI_3
FPI/LP_6
FPI/LP_5
FPI/LP_4
FPI/LP_3
FPI/WC_6
FPI/WC_5
FPI/WC_4
FPI/WC_3
Viscosity B(Pa s)
Loop area (104 Pa/s)
G' C(Pa)
tan δ
0.12 ± 0.00 a
0.11 ± 0.02 a
–
–
12.78 ± 0.07 b
8.94 ± 0.72 c
6.23 ± 0.10 d
6.65 ± 0.97 d
8.88 ± 0.08 c
8.19 ± 0.25 cd
8.80 ± 0.14 c
6.97 ± 0.02 cd
–
–
–
–
7.92
5.45
3.93
3.92
5.66
5.02
5.48
4.29
13.65 ± 1.16 a
22.35 ± 4.16 a
–
–
151.04 ± 17.11 bd
109.47 ± 8.84 bc
111.35 ± 8.07 bc
90.31 ± 3.62 c
163.32 ± 2.36 d
128.59 ± 4.12 bcd
148.53 ± 11.33 bd
134.65 ± 7.12 bcd
–
–
–
–
1.19
1.32
1.19
1.35
1.11
1.24
1.18
1.18
±
±
±
±
±
±
±
±
0.18
0.36
0.02
0.57
0.06
0.25
0.12
0.03
a
b
c
c
b
bc
b
bc
±
±
±
±
±
±
±
±
0.01
0.05
0.00
0.05
0.02
0.01
0.00
0.02
abc
ab
ac
b
c
abc
ac
ac
a–d
Values in the same column with different letters are significantly different (p < 0.05).
FPI/LP and FPI/WC stand for mixtures of FPI and dextran from Ln. pseudomesenteroides DSM 20193 and W. cibaria Sj 1b, respectively; numbers at the end indicate the pH value.
B
Values were taken at the shear rate of 100 1/s.
C
Values were taken at the frequency of 1.0 Hz.
A
Appendix A. Supplementary data
higher for the FPI/WC system than for the FPI/LP system at the same
pH. Changes in pH did not considerably affect the gel stiffness, especially in the FPI/WC system, indicating a stronger stabilizing capacity
of W. cibaria Sj 1b dextran. Furthermore, no significant difference was
found among the tan δ values of the FPI/WC system, confirming the
stronger stabilizing ability of W. cibaria Sj 1b dextran.
During acidification, several physicochemical changes occurred in
FPI solution. The acidification progressively destabilized the initial
structure of fava bean proteins, leading to protein aggregation.
However, the addition of dextran induced various interactions between
dextran and fava bean proteins that prevented the proteins from aggregating. This further stabilized the protein network and resulted in a
relatively stable gel stiffness in the pH range of 3.0–6.0. The better
stabilizing ability of W. cibaria Sj 1b dextran might be attributed to its
lower molar mass, making it a better filler in the protein network, but
further evidence is needed. In this study, the addition of dextran significantly affected the gel network of FPI solution, differing from earlier
reports that indicated a small influence of exopolysaccharides on
rheological properties of fermented milk (Gentès, St-Gelais, & Turgeon,
2011; Hassan, Ipsen, Janzen, & Qvist, 2003).
Supplementary data associated with this article can be found, in the
online version, at />References
Basedow, A. M., Ebert, K. H., & Ruland, U. (1978). Specific refractive index increments of
dextran fractions of different molecular weights. Die Makromolekulare Chemie, 179(5),
1351–1353.
Bounaix, M. S., Gabriel, V., Morel, S., Robert, H., Rabier, P., Remaud-Siméon, M., &
Fontagné-Faucher, C. (2009). Biodiversity of exopolysaccharides produced from sucrose by sourdough lactic acid bacteria. Journal of Agricultural and Food Chemistry,
57(22), 10889–10897.
Boye, J., Zare, F., & Pletch, A. (2010). Pulse proteins: Processing, characterization,
functional properties and applications in food and feed. Food Research International,
43(2), 414–431.
Cai, R., Klamczynska, B., & Baik, B. K. (2001). Preparation of bean curds from protein
fractions of six legumes. Journal of Agricultural and Food Chemistry, 49(6), 3068–3073.
de Kruif, C. G., & Tuinier, R. (2001). Polysaccharide protein interactions. Food
Hydrocolloids, 15(4–6), 555–563.
Duc, G. (1997). Faba bean (Vicia faba L.). Field Crops Research, 53(1), 99–109.
European Commission (2001). European Commission. Decision on authorizing the placing on the market of a dextran preparation produced by Leuconostoc mesenteroides
as a novel food ingredient in bakery products. Decision 2001/122/EG. Official Journal
of the European Communities, L44(2001), 46–47.
Gentès, M. C., St Gelais, D., & Turgeon, S. L. (2011). Gel formation and rheological
properties of fermented milk with in situ exopolysaccharide production by lactic acid
bacteria. Dairy Science & Technology, 91(5), 645–661.
Hassan, A. N., Ipsen, R., Janzen, T., & Qvist, K. B. (2003). Microstructure and rheology of
yogurt made with cultures differing only in their ability to produce exopolysaccharides. Journal of Dairy Science, 86(5), 1632–1638.
Jezierny, D., Mosenthin, R., & Bauer, E. (2010). The use of grain legumes as a protein
source in pig nutrition: A review. Animal Feed Science and Technology, 157(3–4),
111–128.
Katina, K., Maina, N. H., Juvonen, R., Flander, L., Johansson, L., Virkki, L., ... Laitila, A.
(2009). In situ production and analysis of Weissella confusa dextran in wheat sourdough. Food Microbiology, 26(7), 734–743.
Korakli, M., Rossmann, A., Gänzle, M. G., & Vogel, R. F. (2001). Sucrose metabolism and
exopolysaccharide production in wheat and rye sourdoughs by lactobacillus sanfranciscensis. Journal of Agricultural and Food Chemistry, 49(11), 5194–5200.
Laemmli, U. K. (1970). Cleavage of structural proteins during the assembly of the head of
bacteriophage T4. Nature, 227(5259), 680–685.
Lampi, A. M., Damerau, A., Li, J., Moisio, T., Partanen, R., Forssell, P., & Piironen, V.
(2015). Changes in lipids and volatile compounds of oat flours and extrudates during
processing and storage. Journal of Cereal Science, 62, 102–109.
Liu, Y., Zhao, G., Zhao, M., Ren, J., & Yang, B. (2012). Improvement of functional
properties of peanut protein isolate by conjugation with dextran through Maillard
reaction. Food Chemistry, 131(3), 901–906.
Lowry, O. H., Rosebrough, N. J., Farr, A. L., & Randall, R. J. (1951). Protein measurement
with the Folin phenol reagent. Journal of Biological Chemistry, 193(1), 265–275.
Maina, N. H., Tenkanen, M., Maaheimo, H., Juvonen, R., & Virkki, L. (2008). NMR
spectroscopic analysis of exopolysaccharides produced by Leuconostoc citreum and
Weissella confusa. Carbohydrate Research, 343(9), 1446–1455.
Maina, N. H., Pitkänen, L., Heikkinen, S., Tuomainen, P., Virkki, L., & Tenkanen, M.
(2014). Challenges in analysis of high-molar mass dextrans: Comparison of HPSEC,
AsFlFFF and DOSY NMR spectroscopy. Carbohydrate Polymers, 99, 199–207.
Makri, E. A., Papalamprou, E. M., & Doxastakis, G. I. (2006). Textural properties of
4. Conclusions
Dextrans produced by Ln. pseudomesenteroides DSM 20193 and W.
cibaria Sj 1b possessed a similar structure, but differed in molar mass,
conformation, and functional interactions with the FPI. The Maillard
reaction between FPI and dextran showed different influences on
rheological properties of the two conjugated systems, especially after
heat treatment, revealing the effect of molar mass and conformation of
dextran on fava bean protein network. Dextran stabilized the FPI/DX
mixtures at different pH by intermolecular interactions with the FPI.
The texture-modifying effect of dextran on fava bean protein illustrates
the great potential of dextran using in legume-based foods. Dextrans
with various properties may further meet some specific requirements
for different foods.
Funding
This work was supported by the China Scholarship Council and the
BIOPROT project (EU SUSFOOD): “Novel multifunctional plant protein
ingredients with bioprocessing”.
Acknowledgement
The authors thank Minnamari Edelmann for her kind help in lipid
content analysis.
322
Carbohydrate Polymers 190 (2018) 315–323
Y. Xu et al.
different reaction times. Food Hydrocolloids, 38(0), 76–84.
Sun, W. W., Yu, S. J., Yang, X. Q., Wang, J. M., Zhang, J. B., Zhang, Y., & Zheng, E. L.
(2011). Study on the rheological properties of heat-induced whey protein isolate–dextran conjugate gel. Food Research International, 44(10), 3259–3263.
Syrbe, A., Bauer, W. J., & Klostermeyer, H. (1998). Polymer science concepts in dairy
systems—an overview of milk protein and food hydrocolloid interaction. International
Dairy Journal, 8(3), 179–193.
Tieking, M., Korakli, M., Ehrmann, M. A., Gänzle, M. G., & Vogel, R. F. (2003). In situ
production of exopolysaccharides during sourdough fermentation by cereal and intestinal isolates of lactic acid bacteria. Applied and Environmental Microbiology, 69(2),
945–952.
Tirtaatmadja, V., Dunstan, D. E., & Boger, D. V. (2001). Rheology of dextran solutions.
Journal of Non-Newtonian Fluid Mechanics, 97(2–3), 295–301.
Turgeon, S. L., Beaulieu, M., Schmitt, C., & Sanchez, C. (2003). Protein?polysaccharide
interactions: Phase-ordering kinetics, thermodynamic and structural aspects. Current
Opinion in Colloid & Interface Science, 8(4–5), 401–414.
Wolter, A., Hager, A. S., Zannini, E., Czerny, M., & Arendt, E. K. (2014). Influence of
dextran-producing Weissella cibaria on baking properties and sensory profile of
gluten-free and wheat breads. International Journal of Food Microbiology, 172, 83–91.
Xu, Y., Coda, R., Shi, Q., Tuomainen, P., Katina, K., & Tenkanen, M. (2017).
Exopolysaccharides production during the fermentation of soybean and fava bean
flours by Leuconostoc mesenteroides DSM 20343. Journal of Agricultural and Food
Chemistry, 65(13), 2805–2815.
Xu, Y., Wang, Y., Coda, R., Säde, E., Tuomainen, P., Tenkanen, M., & Katina, K. (2017). In
situ synthesis of exopolysaccharides by Leuconostoc spp. and Weissella spp. and their
rheological impacts in fava bean flour. International Journal of Food Microbiology, 248,
63–71.
Zacharius, R. M., Zell, T. E., Morrison, J. H., & Woodlock, J. J. (1969). Glycoprotein
staining following electrophoresis on acrylamide gels. Analytical Biochemistry, 30(1),
148–152.
legume protein isolate and polysaccharide gels. Journal of the Science of Food and
Agriculture, 86(12), 1855–1862.
McCurdy, R. D., Goff, H. D., Stanley, D. W., & Stone, A. P. (1994). Rheological properties
of dextran related to food applications. Food Hydrocolloids, 8(6), 609–623.
Morris, E. R., Cutler, A. N., Ross-Murphy, S. B., Rees, D. A., & Price, J. (1981).
Concentration and shear rate dependence of viscosity in random coil polysaccharide
solutions. Carbohydrate Polymers, 1(1), 5–21.
Pinder, D. N., Swanson, A. J., Hebraud, P., & Hemar, Y. (2006). Micro-rheological investigation of dextran solutions using diffusing wave spectroscopy. Food
Hydrocolloids, 20(2–3), 240–244.
Pitkänen, L., Virkki, L., Tenkanen, M., & Tuomainen, P. (2009). Comprehensive multidetector HPSEC study on solution properties of cereal arabinoxylans in aqueous and
DMSO solutions. Biomacromolecules, 10(7), 1962–1969.
Purwandari, U., Shah, N. P., & Vasiljevic, T. (2007). Effects of exopolysaccharide-producing strains of Streptococcus thermophilus on technological and rheological
properties of set-type yoghurt. International Dairy Journal, 17(11), 1344–1352.
Shukla, S., Shi, Q., Maina, N. H., Juvonen, M., & MaijaTenkanen Goyal, A. (2014).
Weissella confusa Cab3 dextransucrase: Properties and in vitro synthesis of dextran
and glucooligosaccharides. Carbohydrate Polymers, 101, 554–564.
Sosulski, F. W., & McCurdy, A. R. (1987). Functionality of flours, protein fractions and
isolates from field peas and faba bean. Journal of Food Science, 52(4), 1010–1014.
Spotti, M. J., Perduca, M. J., Piagentini, A., Santiago, L. G., Rubiolo, A. C., & Carrara, C. R.
(2013). Gel mechanical properties of milk whey protein–dextran conjugates obtained
by Maillard reaction. Food Hydrocolloids, 31(1), 26–32.
Spotti, M. J., Martinez, M. J., Pilosof, A. M. R., Candioti, M., Rubiolo, A. C., & Carrara, C.
R. (2014a). Influence of Maillard conjugation on structural characteristics and
rheological properties of whey protein/dextran systems. Food Hydrocolloids, 39,
223–230.
Spotti, M. J., Martinez, M. J., Pilosof, A. M. R., Candioti, M., Rubiolo, A. C., & Carrara, C.
R. (2014b). Rheological properties of whey protein and dextran conjugates at
323