Migration and proliferation of cancer cells in culture are differentially affected by molecular size of modified citrus pectin
Bạn đang xem bản rút gọn của tài liệu. Xem và tải ngay bản đầy đủ của tài liệu tại đây (3.55 MB, 11 trang )
Carbohydrate Polymers 211 (2019) 141–151
Contents lists available at ScienceDirect
Carbohydrate Polymers
journal homepage: www.elsevier.com/locate/carbpol
Migration and proliferation of cancer cells in culture are differentially
affected by molecular size of modified citrus pectin
T
Samira Bernardino Ramos do Pradoa, Tânia Misuzu Shigaa, Yosuke Harazonob,c,
⁎
Victor A. Hoganb, Avraham Razb, Nicholas C. Carpitad, João Paulo Fabia,e,f,
a
Department of Food Science and Experimental Nutrition, School of Pharmaceutical Sciences, University of São Paulo, São Paulo, SP, Brazil
Departments of Oncology and Pathology, School of Medicine, Wayne State University, and Karmanos Cancer Institute, Detroit, MI, USA
c
Department of Maxillofacial Surgery, Tokyo Medical and Dental University, Bunkyo-ku, Tokyo, Japan
d
Department of Botany & Plant Pathology, Purdue University, West Lafayette, IN, USA
e
Food and Nutrition Research Center (NAPAN), University of São Paulo, São Paulo, SP, Brazil
f
Food Research Center (FoRC), CEPID-FAPESP (Research, Innovation and Dissemination Centers, São Paulo Research Foundation), São Paulo, SP, Brazil
b
A R T I C LE I N FO
A B S T R A C T
Keywords:
Pectin
Modified pectin
Citrus
Cancer cells
While chemically and thermally modified citrus pectin (MCP) has already been studied for health benefits, it is
unknown how size-fractionated oligo- and polysaccharides differentially affect cancer cell behavior. We produced thermally MCP and fractionated it by molecular size to evaluate the effect these polymers have on cancer
cells. MCP30/10 (between 30 and 10 kDa) had more esterified homogalacturonans (HG) and fewer rhamnogalacturonans (RG-I) than MCP and MCP30 (higher than 30 kDa), while MCP10/3 (between 10 and 3 kDa)
showed higher amounts of type I arabinogalactans (AGI) and lower amounts of RG-I. MCP3 (smaller than 3 kDa)
presented less esterified HG and the lowest amount of AGI and RG-I. Our data indicate that the enrichment of deesterified HG oligomers and the AGI and RG-I depletions in MCP3, or the increase of AGI and loss of RGI in
MCP30/10, enhance the anticancer behaviors by inhibiting migration, aggregation, and proliferation of cancer
cells.
1. Introduction
Previous studies have supported an association between a dietary
fiber (DF)-rich diet and a reduced risk of colorectal cancer (O’Keefe,
2016; Vieira et al., 2017). However, the biological mechanism for how
DF acts to reduce the chance of intestinal cells altering to cancerous
phenotypes is not fully understood.
DF is mainly composed of carbohydrates that are resistant to digestion and, therefore, are not absorbed by the small intestine. Thus, DF
can interact directly with cells throughout the gastrointestinal tract
before reaching the colon. DF can be largely metabolized by the gut
microbiota in the colon, thereby reducing the size of these carbohydrates and producing short chain fatty acids (SCFA) (Tremaroli &
Bäckhed, 2012). This SCFA release is one of the main mechanisms for
the beneficial effects associated with a DF-rich diet. However, although
the anticancer effects of SCFA are well known (Louis, Hold, & Flint,
2014), the mechanisms through which DF can directly interact with
cancer cells is poorly understood.
Plant DF is mainly comprised of cell wall polysaccharides that are a
complex network of cellulose, hemicellulose and pectin (Mohnen,
2008). Pectin is comprised of two types of polysaccharides: homogalacturonan (HG) and rhamnogalacturonan-I (RG-I). HG is composed
of α-1,4-D-galacturonic acid (GalpA) residues with varying degrees of
acetyl and methyl esterification (Maxwell, Belshaw, Waldron, & Morris,
2012; Mohnen, 2008), and it can be further modified by xylosylation
into xylogalacturonans (XGA) or the highly complex rhamnogalacturonan-II (RG-II; Mohnen, 2008). The RG-I backbone is made of repeating
units of [→4)-α-D-GalpA-(1→2)-α-L-Rhap-(1→] that have side groups
of arabinan, galactan, and type I arabinogalactan (AGI) at the O-4 position of the rhamnose (Rhap) residues (Maxwell et al., 2012; Mohnen,
2008). The molecular size, monosaccharide composition, and linkage
pattern of HG and RG-I vary substantially during the development of
any plant species and organ, which results in a large degree of pectin
heterogeneity in fruits and vegetables (Naqash, Masoodi, Ahmad
Rather, Wani, & Gani, 2017). This structural diversity within a single
pectin fraction makes it challenging to establish a structure-function
⁎
Corresponding author at: Avenida Professor Lineu Prestes, 580, bloco 14, 05588-000, São Paulo, SP, Brazil.
E-mail addresses: (S.B.R. do Prado), (T.M. Shiga), (Y. Harazono),
(V.A. Hogan), (A. Raz), (N.C. Carpita), (J.P. Fabi).
/>Received 30 July 2018; Received in revised form 17 January 2019; Accepted 2 February 2019
Available online 04 February 2019
0144-8617/ © 2019 Elsevier Ltd. All rights reserved.
Carbohydrate Polymers 211 (2019) 141–151
S.B.R. do Prado et al.
purity 99% - ash, starch, proteins and phenolic compounds analysis)
was thermally treated to produce MCP. Briefly, CP (20 g in 1.5 L in
water, pH ˜ 5.0, triplicate) was autoclaved (121 °C; 1 h) and MCP was
recovered from solution after precipitation with cold ethanol (80% v/v
final solution) overnight. MCP precipitate was extensively washed with
80% ethanol and washed twice with acetone. After acetone evaporation
at 50 °C, MCP was left on a desiccator for further analysis. The MCP
samples (triplicate) were water-solubilized and fractionated according
to different molecular size by sequential ultrafiltration using 30, 10 and
3 kDa MWCO Amicon Ultra-4 Centrifugal Filters (Millipore). Then, extracts were lyophilized resulting in four MCP fractions: (1) MCP higher
than 30 kDa (MCP30); (2) MCP between 30 and 10 kDa (MCP30/10);
(3) MCP between 10 and 3 kDa (MCP10/3); and (4) MCP lower than
3 kDa (MCP3).
relationship between pectin and intestinal cells.
Water-soluble citrus pectin (CP), which is mainly formed by HG
(˜65%) and RG-I (˜35%), is the most studied DF from plant food sources
with respect to anticancer effects (Maxwell et al., 2012). Previous studies have shown that CP exhibits no or low inhibitory effects on cancer
cell proliferation and migration unless it is modified thermally, in
which case stronger effects are observed (Hao et al., 2013; Jackson,
Dreaden, Theobald, Tran, Beal, Eid, Stoffel et al., 2007, 2007b; Leclere,
Cutsem, & Michiels, 2013, 2015; Platt & Raz, 1992). This thermal
modification normally involves autoclaving CP at 121 °C for 30 min to
1 h (Jackson, Dreaden, Theobald, Tran, Beal, Eid, Stoffel et al., 2007,
2007b). Modified citrus pectin (MCP) altered through this thermal
process has been demonstrated to induce apoptosis of prostate cancer
cells, while the effects of CP have been minimal or absent. Lung and
liver cell death have also been induced by MCP (Leclere et al., 2015), as
has the inhibition of colon cancer cell proliferation (Hao et al., 2013).
Other studies have found that MCP inhibits cancer cell aggregation
through interaction with galectin-3, where galectin-3-mediated interactions are reduced between cells and between cells and the extracellular matrix (ECM) (Glinsky & Raz, 2009; Morris, Belshaw, Waldron,
& Maxwell, 2013). The enhanced anticancer effects of CP that has been
thermally modified have mostly been attributed to a reduction in molecular size, which allows the MCP to access and bind galectin-3 (Morris
et al., 2013). This enhances the apoptotic activity (Jackson, Dreaden,
Theobald, Tran, Beal, Eid, Stoffel et al., 2007, 2007b). While thermal
modification of CP represents an inexpensive method to produce these
biologically active molecules, the structural modifications and the explanation of a possible structure-function relationship still need to be
elucidated. The characterization of MCP fractions will provide new
insights into the relationship between the structure of MCP fragments
and their effects on different cancer cells.
In the present study, thermally generated MCPs were separated into
four fractions with a range of molecular size from greater than 30 kDa
to less than 3 kDa. We ascertained the linkage structure of each fraction
to determine the relative enrichment of HG, RG-I, and AGI. We then
investigated each fraction for its anticancer properties through cell
proliferation, migration and aggregation inhibitions. These different
fractions have different anticancer properties, and structure- and celldependent effects.
2.3. Structural characterization
2.3.1. Monosaccharide analysis
MCP fractions were carboxyl-reduced with NaBD4 after carbodiimide activation (Carpita & McCann, 1996; Kim & Carpita, 1992). Then,
alditol acetates were prepared (Gibeaut & Carpita, 1991) and analyzed
in a gas-chromatography mass-spectrometry (GC–MS) system (HewlettPackard, Palo Alto, CA) equipped with a SP-2330 column
(0.25 mm × 30 m; 0.20 μm; Supelco, Bellefonte, PA). After injection
(splitless mode), the oven temperature was held at 80 °C (1 min), then
increased to 170 °C at 25 °C/min, and then to 240 °C at 5 °C/min with a
10 min hold at the upper temperature. Helium was used as the carrier
gas (1 mL/min). The electron impact-MS was performed at 70 eV with
the temperature source at 250 °C. Pairs of diagnostic fragments (m/z
187/189, 217/219 and 289/291) were used to calculate the proportion
of 6,6-dideuteriogalactosyl as described previously (Kim & Carpita,
1992). MCP values were achieved by all MCP fractions values corrected
by their total yield in percentage.
2.3.2. Linkage analysis
MCP fractions were per-O-methylated as described previously
(Gibeaut & Carpita, 1991). The same GC–MS system and column used
for monosaccharide analysis were used for the analysis of partially
methylated alditol acetates (PMAA). After injection (splitless mode),
the oven temperature was held at 80 °C (1 min), then increased to
160 °C at 25 °C/min, to 210 °C at 2 °C/min and then to 240 °C at 5 °C/
min with a 5 min hold at the upper temperature. PMAA structures were
confirmed by their MS fragmentation pattern and relative retention
time based on the retention time of myo-inositol (internal standard)
(Kim & Carpita, 1992). MCP monosaccharide percentages were based
on the relative amounts of material collected in each fraction. MCP
values were achieved by all MCP fractions values corrected by their
total yield in percentage.
2. Material and methods
2.1. Chemicals and reagents
Heat-inactivated fetal bovine serum (FBS), trypsin/EDTA and
Dulbecco’s modified Eagle’s medium (DMEM) containing penicillin
(100 UI/mL) and streptomycin (100 μg/mL) were from Gibco (Grand
Island, NY) or Cultilab (Campinas, Brazil). Earle’s Minimal Essential
Medium (EMEM) was purchased from Invitrogen (Carlsbad, CA).
Vybrant DiO and DiI Cell-Labeling Solution were purchased from
Thermo Scientific (Waltham, MA). Antibodies for p-Akt (sc-7985-R), pErk (sc-7383) and Erk 1/2 (sc - 135900) were purchased from Santa
Cruz Biotechnology (Santa Cruz, CA). Antibodies for Akt (#9272), p21
(2946S), PARP (#9542), cleaved caspase-3 (#9661) and p-JNK
(#9255S) were purchased from Cell Signaling Technology (Beverly,
MA). Rat monoclonal anti-Gal-3 antibody was obtained from the hybridoma cell line TIB-166 of the American Type Culture Collection
(ATCC, Manassas, VA). Water was collected from a Milli-Q purification
system from EMD Millipore (Bedford, USA). Unless stated otherwise,
remaining reagents and chemicals were purchased from Sigma-Aldrich
(St. Louis, USA).
2.3.3. Homogeneity and average molecular size
MCP and MCP fractions were analyzed by high performance size
exclusion chromatography coupled to a refractive index detector
(HPSEC-RID) using a 1250 Infinity system (Agilent, Santa Clara, CA)
equipped with four PL-aquagel-OH columns (60, 50, 40 and 30;
300 × 7.5 mm; Agilent) connected in tandem. The eluent was 0.2 M
NaNO3/0.02% NaN3 (0.6 mL/min) and the RID temperature was set at
30 °C. Dextran equivalent average molecular size was calculated using a
standard curve of dextrans (MW 5–1800 kDa). The void volume (Vo)
was the elution time of the heavier molecule (blue dextran; ˜1800 kDa),
and the elution volume (Ve) was the release time of lighter molecule
(glucose).
2.2. Preparation of modified citrus pectin (MCP)
2.3.4. Determination of the degree of O-methyl esterification
Fourier Transform Infrared (FTIR) spectroscopy was applied to determine the degree of O-methyl esterification (Manrique & Lajolo,
2002). MCP and MCP fractions were analyzed using an Alpha FTIR
Pectin from citrus peel (CP; P9561 Sigma-Aldrich; ≥ 85% esterified;
≥ 74% of GalA; dextran equivalent molecular size 184.6 ± 3.1 kDa;
142
Carbohydrate Polymers 211 (2019) 141–151
S.B.R. do Prado et al.
2.4.5. Wound healing assay
Wound healing assay was performed as described previously
(Moreno-Bueno et al., 2009). Cancer cells were plated (2 × 10⁵ cells/
35-mm cell culture plate) and a wound was made by scratching the
monolayer culture with a sterile micropipette tip. Then, cells were
washed with PBS to remove floating cells and treated or not with MCP,
MCP fractions or lactose for 24 h. Migration of cells towards gap closing
was observed after 24 h using an inverted microscope (Carl Zeiss) and
compared to the wound before treatment (0 h).
spectrometer (Bruker Optic, Ettlingen, Germany) equipped with a
deuterated triglycine sulfate (DTGS) detector and a single bounce attenuated total reflectance (ATR) accessory (diamond crystal).
FTIR–ATR spectra were obtained with a resolution of 4 cm−1 and 50
scans. GRAMS/AI 9.1 software (Thermo Scientific) was used for spectra
analysis. Methyl esterified and free uronic acids correspond to bands at
1749 cm−1 and 1630 cm−1, respectively, and the degree of O-methyl
esterification was calculated using a standard curve of commercially
available pectin with known degrees of O-methyl esterification (28%,
64%, 91%) and their mixtures (14%, 46%, 78%).
2.4.6. Extracellular matrix proteins (ECM) assay
ECM interaction was performed according to Nangia-Makker et al.
(2012). Firstly, 96-well plates were coated with serially diluted laminin
from mouse Engelbreth-Holm-Swarm (EHS) sarcoma, collagen type IV
or fibronectin (10 - 0 μg) and incubated for 1 h at 37 °C. Then cell
culture plates were blocked with 1% bovine serum albumin (BSA) and
washed with PBS. Then, cancer cells were transferred and incubated
(4.0 × 10⁴ cells/well) in the plates containing the ECM for 16 h. Then,
plates were washed to remove non-adherent cells and fluorescence levels obtained after incubation with Alamar blue (3 h) was used to define
the concentration of each ECM that retained the highest number of
cancer cells. After define the best concentration of each ECM (1 μg EHS
laminin, 0.5 μg collagen IV and 2.5 μg fibronectin), the same experiment described above was done, but using media containing or not
MCP, MCP fractions or lactose. Cells treated or not with MCP, MCP
fractions or lactose were also incubated in non-coated plates (positive
control) and 0.1% BSA-coated plates (negative control).
2.4. Cancer cell lines
HCT116 and HT29 colon and PC3 prostate cancer cell lines were
purchased from ATCC and were cultured according ATCC guidelines.
Briefly, cells were cultured in DMEM containing penicillin and streptomycin with 10% FBS at 37 °C in a humidified atmosphere of 5% CO2.
Cells were passed to new culture plates by using by using trypsin/EDTA
when they reached 70–90% of confluence. Before treatments, cells were
added to the culture plates at the desired concentration and left overnight on the incubator. After incubation, culture media was replaced by
DMEM containing MCP/MCP fractions at 0.2, 0.5 or 1.0% or lactose
(galetin-3 binding sugar) or sucrose (galectin-3 non-binding sugar; osmolality control) at 10, 33 or 100 mM. Cells were continuous tested for
mycoplasma contamination. Cancer cells were treated with citrus
pectin at a higher concentration to evaluate a cytotoxicity effect and no
differences in cell proliferation were observed compared to the control
(non-treated - results not shown).
2.4.1. MTT assay
Cells (1 × 10⁴ cells/well; 96-well plate) were treated or not with
MCP, MCP fractions, lactose, sucrose or 0.02% Triton X-100 (cell death
control) for 24, 48, 72 and 96 h. After incubation, MTT solution in
DMEM (0.5 mg/mL) was added and cells were incubated for further 3 h.
Then, the supernatant was removed, formazan crystals were solubilized
with DMSO and the absorbance was read at 490 nm using a Benchmark
Plus Microplate Reader (Bio-Rad, Hercules, CA). Cell viability (%) was
expressed in relation to the control (untreated cells).
2.4.7. Apoptosis assay
Apoptosis was evaluated by flow cytometry using PE Annexin V
Apoptosis Detection Kit I (BD Biosciences, San Diego, CA) according to
the manufacturer’s instructions. Briefly, cells (2.0 × 10⁵ cells/well; 24well plate) were treated or not with MCP, MCP fractions or lactose for
24 h. After incubation, cells were washed with 2% BSA in PBS and
suspended in the Binding Buffer (1.0 × 10⁶ cells /mL). Then, cell suspension (100 μL) was incubated with FITC Annexin V and 7AAD for
15 min protected from light. Finally, analysis was performed using a
FACSVerse flow cytometer (BD Biosciences, San Diego, CA). Controls of
unstained cells and staining only with FITC Annexin V or 7AAD were
used. Data analysis was performed with FlowJo software (BD
Biosciences).
2.4.2. LDH assay
The lactate dehydrogenase (LDH) was evaluated using the
“Cytotoxicity Detection Kit” (Roche, Mannheim, Germany) following
the manufacturer’s instructions and accordingly to Prado et al. (2017).
2.5. Western blot
2.4.3. Homotypic aggregation assay
Cells were detached from monolayer of culture plates by using
0.02% EDTA in Calcium-Magnesium free PBS (CMF-PBS) and suspended (1 × 10⁶ cells/ mL) in CMF-PBS containing or not 20 g/mL
asialofetuin and treatments. Aggregation inhibition was done accordingly to Nangia-Makker et al. (2012) and Prado et al. (2017).
Cells (5.0 × 10⁵ cells/well; 6-well plate) were treated or not with
MCP, MCP fractions or lactose and incubated for 24 h. Then, cells were
washed with PBS and lysed with RIPA buffer (50 mM Tris-HCl pH 7.4,
1% NP-40, 0.5% Na-deoxycholate, 0.1% SDS, 150 mM NaCl, 2 mM
EDTA, 50 mM NaF and 0.2 mM Na3VO4) containing protease and
phosphate inhibitors (Roche). Proteins were quantified using the Pierce
BCA Protein Assay Kit (Thermo Scientific). Protein separation, transfer
and detection were performed accordingly to Prado et al (2017).
2.4.4. Migration assay
Migration assay was performed as previously described (NangiaMakker, Vitaly, & Avraham, 2012; do Prado et al., 2017). Briefly, bovine adrenal medullary endothelial cells (BAMEC) maintained in EMEM
containing 10% FBS were pre-labeled with DiL (green) and incubated in
one well of a 2-well culture-insert chamber (2.4 × 10⁴ cells/well).
HCT116, HT29 or PC3 cells prelabeled with DiO (red) were incubated
in the other wells of the culture-insert chamber (2.4 × 10⁴ cells/well).
After 12 h, the cells were washed with PBS and the culture-insert
chamber was removed. Cells were treated or not with MCP, MCP
fractions or lactose for 24 h. Migration of co-cultures toward each other
was observed after 24 h using a LSM 510 META LNO Laser Scanning
Microscope (Carl Zeiss, Oberkochen, Germany; The Wayne State University Microscopy and Imaging Core Facility) and migration was
compared to the co-culture before treatment (0 h).
2.6. Hemagglutination assay inhibition with galectin-3
Recombinant galectin-3 was produced as described Nangia-Makker
et al. (2012). The inhibition of hemagglutination was done as described
previously (Nowak, Haywood, & Barondes, 1976; Ochieng et al., 1993).
Briefly, erythrocyte was isolated from rabbit blood and a final suspension of 4% was used in experiment. In each well of a V plate was add
50 μL of 1% bovine serum albumin (BSA), 50 μL of PBS 1× or the
sample diluted in PBS 1× and/or 10 μg/mL galectin-3, and 25 μL of
rabbit erythrocyte. After, the plate was incubated on room temperature
for 90 min.
143
Carbohydrate Polymers 211 (2019) 141–151
S.B.R. do Prado et al.
probable polysaccharide structures, HG (4-GalA and t-GalA) fragments
become the dominant ones with a decrease in MCP10/3 due to AGI
increase (4-Gal, 3,4-Gal, 4,6-Gal and t-Araf). Minor changes between
MCP fractions were observed for: RG-I (2-Rha, 2,4-Rha, 3,4-GalA and 4GalA), type II arabinogalactan (AGII - 3-Gal, 6-Gal, 2-Ara, 3,6-Gal,
3,4,6-Gal, t-Rha, t-Ara), heteroxylan (e.g. glucuronoarabinoxylan; 4Xyl, 2,4-Xyl, 3,4-Xyl, 2,3,4-Xyl, t-GlcA, t-Ara), heteromannan (e.g.
glucomannan; 4-Man, 4,6-Man, 4-Glc, 4,6-Glc, t-Gal), arabinan (5-Ara,
2,5-Ara, 3,5-Ara, t-Ara) and xyloglucan (4,6-Glc, 4-Glc, 2-Xyl, 2-Gal, tFuc, t-Xyl). Others partially methylated alditol acetate residues did not
change between MCP fractions (t-Arap, 3-Araf, Ara(OAc)5, Xyl(OAc)5,
Man(OAc)6, 2,4-Gal, 2,4,6-Gal, Gal(OAc)6, 4,6-GalA, 2,4-GalA, 3,4-Glc,
Glc(OAc)6) (Pettolino, Walsh, Fincher, & Bacic, 2012).
MCP, MCP30 and MCP30/10 are mainly composed of highly esterified HG and similar proportions of RG-I and AGI. The MCP10/3
fraction was also characterized by highly esterified HG, but with higher
quantities of AGI, while MCP3 had fewer branched structures (RG-I and
AGI) with lesser degree of esterification and a smaller molecular size.
The characteristics of smaller but high-methylated MCP10/3 fraction
and the smaller but low-methylated MCP3 fraction may result in differences in biological effects (Chen et al., 2006). MCP10/3 fraction
possesses promising biologically active structures since methylated
structures, the HG:RG-I ratio and the higher AGI quantity are requisites
in enhancing the anticancer effects (Maxwell et al., 2016).
2.7. Statistical analysis
The results were expressed as the mean ± standard deviation (SD)
and the images were representative of at least three independent experiments, except for WB analysis, which were performed in duplicate.
Data were analyzed using GraphPad Prism 6.0 software (GraphPad
Software, San Diego, CA). One-way ANOVA with Tukey’s (to assess
differences between all groups) or Dunnett’s (to assess differences between the control and two or more groups) were used as post hoc tests,
and Least Significant Difference (LSD) was used to compare means at
0.0001. Significance was set at p < 0.05.
3. Results and discussion
3.1. Thermal modification leads to structural differences among MCP
fractions
The yield of MCP fractions was based on the total MCP that was
separated. The MCP30 fraction was the most abundant (68 ± 1% w/
w), followed by MCP 30/10 (15 ± 1% w/w), MCP10/3 (10 ± 0% w/
w), and MCP3 (7 ± 0% w/w). HPSEC-RID confirmed sequential ultrafiltration of the separated MCP fractions according to their molecular
size (Table 1). The dextran equivalent average molecular sizes were
calculated using three replicates of MCP30, MCP30/10, MCP10/3 and
MCP3 fractions and the results of the main peaks were 35.2 kDa,
27.5 kDa, 10.2 kDa, and 5.1 kDa, respectively (Table 1). We also calculated the maximum and minimum values at half height for each
analysis (Supplemental Figure S1).
Monosaccharide analysis showed that galacturonic acid GalA was
the most abundant monosaccharide in all the MCP fractions, followed
by galactose (Gal; Table 1). Among the MCP fractions, MCP10/3 had
the highest level of Gal and the lowest level of GalA. Degrees of esterification were similar for fractions of larger molecular size, ranging
from 79 to 85%, whereas degree of esterification was 54% in MCP3
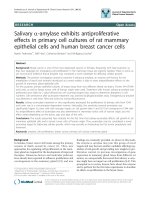
(Table 1). Linkage analysis showed that the most prevalent form of
GalA in all the fractions was 4-GalA (Fig. 1; Supplemental Table S1),
indicating that all MCP was mostly HG. The presence of a small amount
of 3,4-GalA and the corresponding t-Xyl residues demonstrated that
XGA was also part of the HG fraction. Smaller amounts of 2-Rha, 2,4Rha and an equal amount of 4-GalA indicated the presence of RG-I. The
4-Gal and 3,4-Gal, and a corresponding amount of t-Araf equal to the
branch points were taken as evidence for the presence of AGI. Similar
results between the monosaccharide composition and linkage patterns
of MCP, MCP30 and MCP30/10 were found. Notably, MCP10/3 and
MCP3 showed a strong decrease in GalA : t-GalA, consistent with a
decreased molecular size (Supplemental Table S2). MCP10/3 had
higher proportions of 4-Gal, 3,4-Gal, and the corresponding t-Araf, as
well as enrichment of Gal, indicating higher amounts of AGI compared
to the other MCP fractions. When some linkages were gathered into the
3.2. MCP fractions differentially regulate cancer cells proliferation,
migration, and aggregation
Three cell lines were used to observe how different cancer cell
mutations responded to treatment with MCP fractions with respect to
necrosis, necroptosis, apoptosis, viability, and cytotoxicity. HCT116
and HT29 are colon cancer cell lines, while PC3 is a prostate cancer cell
line. Initial screening was made to investigate the effects of MCP and
MCP fractions on cell viability using sucrose, lactose and CP as controls
(Supplemental Figure S2). Viability was measured by 3-(4,5-Dimethyl2-thiazolyl)-2,5-diphenyl-2H-tetrazolium bromide (MTT) and sucrose
and lactose were used as a control of galectin-3 non-binding and galectin-3 binding carbohydrates, respectively (Barondes, Cooper, Gitt, &
Leffler, 1994). The screening for a loss in cancer cell viability (compared with a control without treatment) showed that after a 24 h-incubation with sucrose and lactose at 100 mM, a loss of cancer cell
viability was observed (Supplemental Figure S2). No loss in cell viability was seen with a treatment of CP. Lactose at 100 mM is widely used
for galectin-3 inhibition since it is non-cytotoxic (Inohara & Raz, 1995;
Mina-Osorio, Soto-Cruz, & Ortega, 2007). In the same manner as the
simpler carbohydrates, cells treated with MCP and MCP fractions at
1.0% also exhibited reduced cell viability (Fig. 2).
Thus, for comparison experiments, a 24 h-incubation period was
used with 1.0% MCP and MCP fractions and 100 mM of lactose and
Table 1
Molecular size, degree of esterification (DE) and monosaccharide composition of MCP and MCP fractions.
Monosaccharide composition (g/100 g)a
MCP
MCP30
MCP30/10
MCP10/3
MCP3
Molecular sizeb
DEc
22.2
35.2
27.5
10.2
5.1
79.8
84.2
85.0
78.9
53.7
Rha
±
±
±
±
±
4.3
4.8
5.6
2.1
6.0
3.1
3.5
2.7
2.0
1.7
Fuc
±
±
±
±
±
0.2
0.2
0.0
0.0
0.0
0.1
0.1
0.0
0.0
0.1
Ara
±
±
±
±
±
0.0
0.1
0.0
0.0
0.0
2.5
3.2
1.1
0.9
0.8
Xyl
±
±
±
±
±
0.6
0.8
0.0
0.1
0.0
a
1.5
1.9
0.5
1.1
0.6
Man
±
±
±
±
±
0.4
0.5
0.0
0.1
0.3
0.9
0.9
0.5
1.4
1.2
±
±
±
±
±
0.2
0.2
0.0
0.1
0.1
Gal
GalA
11.5 ± 1.4
10.8 ± 0.9
11.2 ± 0.0
20.7 ± 7.8
5.5 ± 0.1
75.8
74.7
80.0
69.7
86.0
Glc
±
±
±
±
±
2.5
2.5
0.2
7.3
0.1
1.5
1.7
1.6
0.7
1.0
GlcA
±
±
±
±
±
0.4
0.5
0.2
0.2
0.2
3.1
3.2
2.4
3.5
3.2
±
±
±
±
±
0.2
0.3
0.1
0.4
0.0
Results represents mean ± SD (n≥7).
Molecular size is dextran equivalent. The maximum and minimum values at half height for each analysis are represented in Figure S1.
c
DE: degree of esterification. DE values were calculated using the calibration curve (R2 = 0.9798) and results are expressed in mean ± SD (n = 3). GlcA:
glucuronic acid; Glc: glucose; GalA: galacturonic acid; Gal: galactose; Man: mannose; Xyl: xylose; Ara: arabinose; Fuc: fucose; Rha: rhamnose. MCP: modified citrus
pectin.
b
144
Carbohydrate Polymers 211 (2019) 141–151
S.B.R. do Prado et al.
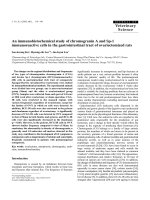
Fig. 1. Linkage analysis of MCP and MCP fractions. The table of linkage results is presented in Supplemental Table 1. Rhamnose (Rha); fucose (Fuc); arabinose (Ara);
xylose (Xyl); mannose (Man); galactose (Gal); Galacturonic acid (GalA); glucose (Glc); glucuronic acid (GlcA); terminal (t); pyranose (p); furanose (f). MCP: modified
citrus pectin.
MCP fractions may have distinct effects in different cancer cells with
respect to cell death, but these mechanisms need to be further investigated.
Annexin V is a protein that binds to the negative heads of
sucrose. To determine if the reduction in cell viability was a result of
cytotoxicity, the lactate dehydrogenase (LDH) assay was performed.
Results showed that a significant cytotoxicity was observed only for
HCT116 cells after treatment with MCP10/3 (Fig. 3), highlighting that
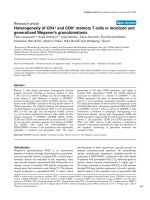
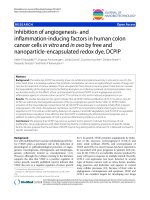
Fig. 2. Cell viability loss after MCP and MCP fractions treatment. The loss of viability was calculated based on control (without treatment) as 100%. Cells were
treated with MCP and MCP fractions at different concentrations (0.2%, 0.5% and 1%) and the higher concentrations and the lower fractions precluded cells growth.
Data were shown as mean values. One-way ANOVA with the Least Significant Difference (LSD) test was used to compare means at 0.0001. Significant mean values are
those with differences larger than the LSD value showed in each graphic. The results were from three independent experiments, with each performed in triplicate. The
complete data are presented in Table S3.
145
Carbohydrate Polymers 211 (2019) 141–151
S.B.R. do Prado et al.
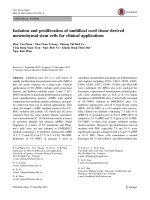
Fig. 3. Cell viability by MTT assay (left x axis) and cells cytotoxicity after 24 h of treatment by LDH assay (right x axis). Effects on cell viability of the higher
concentration of MCP and MCP fractions (1%) at t = 24 h are shown on lower graphic. Data are shown as mean ± SD. Tukey’s test (*p < 0.05) was performed.
Different letters represent significant differences between the treatments. Cytotoxicity by LDH assay after 24 h of incubation is shown in upper graphic. Data are
expressed as percentage of cell viability compared to control (no treatment) of each time. Results are represented as mean ± SD of three independent experiments,
with each performed in triplicate. *p < 0.05 vs control, according to Dunnetts’s test.
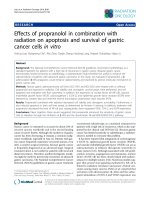
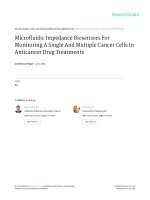
Fig. 4. Effects of MCP and MCP fractions in HCT116, HT29 and PC3 apoptosis by flow cytometry. Cancer cells were induced to late apoptosis/necroptosis after MCP
and MCP fractions treatment for 24 h. A) Q1: necrosis quadrant; Q2: necroptosis quadrant; Q3: apoptopsis quadrant; Q4: viable cells quadrant. The most significant
differences in graphics are shown in the figure (HCT116 and PC3 cells treatment). B) The results were expressed in percentage of cells in comparison with control (no
treatment). Results were represented as mean ± SD of two independent experiments, with each performed in triplicate.
and MCP10/3 fractions induced necrosis (Q1) and necroptosis (Q2) in
HCT116 and PC3 cells but not in HT29 cells (Fig. 4; Supplemental
Figure S3). It has been suggested that MCP30/10 and MCP10/3 have
the same esterification degree and the lowest molecular size of the
other fractions except for MCP3.
These chemical and structural differences could explain why
MCP30/10 and MCP10/3 increased necroptosis in HCT116 cells while
MCP3 did not, since the higher the degree of esterification the better
the programmed cell death activation on cancer cells (Jackson,
Dreaden, Theobald, Tran, Beal, Eid, Stoffel et al., 2007, 2007b).
Because the size and number of cancer cell aggregates have been
phosphatidylserine in the external monolayer of the membrane. When
this protein is conjugated with a fluorochrome, the cellular fraction that
increases the translocation of negative phospholipids to the outer
monolayer of the membrane can be determined. The fluorescent DNA
marker 7-AAD intercalates within DNA, and it requires a prior permeabilization of the plasma membrane. The translocation of phospholipids in the outer monolayer of the membrane is considered an early
event in the triggering of cell death by apoptosis (quadrant Q1). The
permeabilization of the membrane only occurs during necrotic processes (quadrant Q3), and when both events happen it could be indicative of late apoptosis/necroptosis (quadrant Q2). The MCP30/10
146
Carbohydrate Polymers 211 (2019) 141–151
S.B.R. do Prado et al.
Fig. 5. Inhibition of homotypic cell aggregation. Data are shown as mean ± SD and the results were expressed in percentage of cells relative to control (with
asialofetuin and no treatment). *p < 0.05 vs lactose, according to Dunnett’s test.
for the identification of bioactive carbohydrates derived from fruit.
The effects of MCP and MCP fractions on the protein levels normally
associated with cancer cell death, survival, and migration were evaluated to yield clues on the biochemical mechanisms of why cancer cells
are affected by these treatments. While pAKT (phosphorylated protein
kinase B) is normally related to cell survival (Brunet et al., 1999),
higher concentrations cause excessive cell stress leading to necroptosis
(Buchheit, Rayavarapu, & Schafer, 2012; Zhao et al., 2017). Increased
pERK levels are normally linked to cell migration and survival (Han,
Khuri, & Roman, 2006; More, Chiplunkar, & Kalraiya, 2016; Xue &
Hemmings, 2013), but pERK up-regulation can also induce cell necrosis
by necroptosis or autophagy (He et al., 2013). Protein p21 can cause
cell cycle arrest and cell death (Masgras et al., 2012), and PARP has a
role in DNA repair and promotion of cell survival (D’Arcangelo, Drew,
& Plummer, 2011). Caspase-3 plays an important role in apoptosis
(Nicholson, 1999), and pJNK can be involved in cancer cell growth,
survival, and metastasis (Dhanasekaran, 2013). Immuno-gel blot analysis demonstrated that the MCP and MCP fractions differentially
regulated the expression of these proteins in cancer cells (Fig. 8; Supplemental Figure S6). MCP and MCP30 reduced pAKT levels in
HCT116, HT29, and PC3 cells; however, only MCP increased pERK1/2
and p21 levels in HCT116 and PC3 cells, respectively. MCP30/10 increased pAKT and p21 levels in HCT116 and PC3 cells, whereas
MCP10/3 increased only p21 levels, but not those of pAKT. The MCP3
fraction had differential effects on protein levels in HCT116, HT29, and
PC3 cell lines; this fraction increased p21 levels and induced caspase-3
expression in HCT116 cells, but reduced pERK levels in HT29 cells.
MCP3 enhanced p21 expression and reduced pJNK levels in HT29 and
PC3 cells, but PARP and Galectin-3 levels did not change throughout
the treatments.
It seems that higher AGI levels and lower RG-I levels are required to
activate p21, as MCP30/10, MCP10/3, and MCP3 treatments increased
this protein level in HCT116, with an activation of p21 being related to
cell cycle arrest that induces cell death (Masgras et al., 2012). Apoptosis
in MCP3 treatment in HCT116 could be triggered by caspase-3 activation, but the higher levels of p21 and the lowest quantity of dead cells
when compared to MCP30/10 and MCP10/3 are indicators that other
biochemical pathways that lead to cell death might have been activated
or repressed. MCP10/3 promoted the reduction of pAKT levels in
HCT116, and since increased levels of pAKT are normally related to cell
survival (Brunet et al., 1999), this could explain the reduction in cell
proliferation and the inhibitory effects on cell migration that were
observed. On the other hand, the MCP30/10 induced pAKT expression
found to correlate with cell survival (Zhang, Lu, Dazin, & Kapila, 2004)
and because cancer cells that form aggregates in suspension cultures
have been found to exhibit significantly lower levels of death than
single cells (Zhang, Xu, & Yu, 2010), MCP and MCP fractions were
evaluated for the inhibition of cancer cell aggregation. In the aggregation assay, asialofetuin was used to induce cell aggregation, and
lactose, which inhibits lectins-dependent aggregation, was used as a
positive control. The inhibition of aggregation induced by MCP3 was
similar to lactose in all three cell lines (Fig. 5). Similar effects compared
to lactose were also found for MCP30/10 and MCP10/3 in HT29 cells
(Supplemental Figure S4).
Cell migration and attachment to the ECM are crucial steps to
cancer development and metastasis. Thus, the effects of MCP and MCP
fractions on cancer cell migration towards endothelial cells and cell
attachment to proteins of the ECM were evaluated by migration assay.
MCP3 strongly inhibited cancer cell migration in all three cell lines, but
the effects were strongest for HCT116 cells (Fig. 6). MCP30/10 and
MCP10/3 also strongly inhibited migration of HCT116 cells, but MCP
and MCP30 did not. The inhibitory effects of MCP3 as well as the absence of effects for both MCP and MCP30 on cancer cell migration were
confirmed by the wound healing assay (Supplemental Figure S5).
MCP3 gap closing was 27.5 ± 0.3% compared to 63.5 ± 0.7% for
the control for HCT116, 14.5 ± 0.3% compared to 22.6 ± 1.3% for
the control for HT29, and 51.6 ± 4.2% compared to 77.4 ± 3.8% for
the control (Supplemental Figure S5).
The ECM-protein assay evaluated the effects of MCP and MCP
fractions on inhibiting the interactions between cancer cells and several
target ECM proteins (laminin, collagen IV, and fibronectin).
Polysaccharides that are chemically similar to some glycoproteins could
interfere with cancer cell adhesion to ECM proteins and the inhibition
of galectin-3. ECM proteins, such as laminin, collagen IV, and fibronectin are required for cancer cell growth and invasion as previously
shown (Pickup, Mouw, & Weaver, 2014). As lactose inhibits lectin-dependent interaction between cells and ECM proteins, it was used as a
positive control. MCP10/3 and MCP3 reduced HCT116, HT29, and PC3
cell density in laminin-coated plates, reduced HCT116 cell density in
collagen IV-coated plates, and also reduced HT29 cell density in fibronectin-coated plates (Fig. 7). In contrast, MCP30/10 only reduced
HT29 and HCT116 cell density in laminin-coated plates, whereas
MCP30 had a similar effect to that of lactose only in PC3 cell density in
laminin-coated plates. The interference of MCP fractions on the adhesion of cancer cells to ECM proteins may be representative of a positive
effect against cancer cell spread and metastasis, opening new avenues
147
Carbohydrate Polymers 211 (2019) 141–151
S.B.R. do Prado et al.
Fig. 6. Migration assay using endothelial cells (BAMEC) dyed with Dil (red) and cancer cells dyed with DiO (green). Endothelial cells (BAMEC) dyed with DiO (green)
and cancer cells dyed with DiI (red). Lower molecular size fractions from MCP had lessen the interaction between cancer cells and BAMEC. Scale bar: 50 μm (For
interpretation of the references to colour in this figure legend, the reader is referred to the web version of this article.).
for pAKT expression and/or AKT phosphorylation and could cause an
excessive stress to cells leading to necroptosis (Buchheit, Rayavarapu, &
Schafer, 2012; Zhao et al., 2017). Our results demonstrate that the
smaller MCP fractions (MCP30/10, MCP10/3, and MCP3) were more
in PC3 cells could have led to the observed cell proliferation reduction
and cell migration inhibition. This could be due to the higher HG
fractions in MCP30/10. Since MCP30/10 has the lesser amount of tGalA of all the fractions, it is possible to speculate that HG is important
148
Carbohydrate Polymers 211 (2019) 141–151
S.B.R. do Prado et al.
Fig. 7. MCP and MCP fractions interaction with extracellular matrix proteins (laminin, collagen IV and fibronectin) and cancer cells lines. Data are shown as
mean ± SD. All treatments are significant different from control (Dunnett’s test). All samples are compared with lactose (#) by Dunnett’s test and significant
differences (p < 0.05) are marked with an asterisk.
3.3. Galectin-3 inhibition is dependent on MCP structure rather than
molecular size
effective in reducing cancer cell proliferation, migration, and adhesion
to ECM proteins. All MCP fractions showed some biological effects in at
least one of the three cell lines tested. Thus, the underlying mechanisms
of MCP fractions in cancer cells seem to be both structure- and cell linedependent. The three cell lines used have different characteristics.
HT29 is a colon adenocarcinoma cell line, while HCT116 is a colon
carcinoma cell line. HT29 cells are differentiated, while HCT116 cells
are poorly differentiated and highly metastatic. And PC3 is a highly
metastatic adenocarcinoma cell line (American Type Culture
Collection, 2013; Tai et al., 2011).
Galectin-3 is a member of the carbohydrate-binding protein family
that exhibits an affinity for β-galactoside sugars in a conserved sequence of the carbohydrate-binding site (Barondes et al., 1994). The
overexpression of galectin-3 might induce cancer cells to become more
aggressive by increasing their proliferation and metastasis (Dumic,
Dabelic, & Flögel, 2006). Therefore, the interaction of pectin fractions
with galectin-3 could prevent this increased activity in cancer cells.
Fig. 8. Western blotting analysis. Cell lysates were prepared and processed for immunogel blot assay after 24 h of treatment. After BCA assay, equal amounts of
proteins were separated using SDS-PAGE. β-Actin was used as the loading control.
149
Carbohydrate Polymers 211 (2019) 141–151
S.B.R. do Prado et al.
Appendix A. Supplementary data
Because at least part of the anticancer effects of MCP were related to the
inhibition of galectin-3, the hemagglutination assay was performed to
evaluate the possible interaction between MCP fractions and galectin-3.
High concentrations of CP (negative control) did not inhibit galectin-3mediated hemagglutination (Supplemental Figure S7). In contrast, MCP
and MCP30 inhibited galectin-3-mediated hemagglutination at 400 μg/
mL. Notably, MCP30/10 did not inhibit galectin-3-mediated hemagglutination even at higher concentrations (500 μg/mL), and
MCP10/3 and MCP3 had inhibitory effects at lower concentrations
(300 μg/mL). As all fractions possessed high amounts of GalA, the
greater activity of the smaller fractions in binding to galectin-3 may
explain why the minimum inhibitory concentration was much higher
than that of lactose. Gao et al. (2012) fractioned a chemically MCP and
demonstrated that neutral fractions showed less galectin-3 binding than
did acidic fractions. In our study, thermally MCP fractionated by size
showed different galectin-3 binding powers, with the smaller sizes resulting in more inhibition, probably enhancing the observed anticancer
activity due to a better penetration in cancer cells because of their
smaller molecular sizes.
A concern about thermally modified pectin is the production of
cytotoxic molecules and β-elimination with a consequent production of
unsaturated sugar residues (Leclere et al., 2016; Zhang, Xu, & Zhang,
2015). Using the same HPLC-UV protocol described in Leclere et al.
(2016), we did not find any cyclic compounds in our thermally MCP or
in the fractionated samples (data not shown). One explanation for not
detecting the low molecular size compounds produced by Maillard reactions, differing from the results of Leclere et al. (2016), is that we
precipitated our pectin with ethanol and exhaustively washed the
precipitate with 80% ethanol and with acetone. This protocol might
have removed any cytotoxic compounds. Moreover, the measurement
of UV absorbance (from 210 nm to 260 nm) did not reveal any conjugated dienes produced by β-elimination, possibly because the pH had
not been adjusted to 7.0 prior to the heat treatment. Another consequence of β-elimination would be a reduced esterification of the HG
backbone, which was not observed in our samples despite the smaller
one (with low quantity also). Therefore, the effects observed in our
study did not seem to be related to the cytotoxic molecules reported
elsewhere (Leclere et al., 2016).
Supplementary material related to this article can be found, in the
online version, at doi: />References
American Type Culture Collection (2013). Colon cancer and normal cell lines. ATCC
Retrieved from and Normal cell lines
tables/Colon cancer and normal cell lines.ashx.
Barondes, S. H., Cooper, D. N. W., Gitt, M. A., & Leffler, H. (1994). Galectins: Structure
and function of a large family of animal lectins. Journal of Biological Chemistry,
269(33), 20807–20810. />Brunet, A., Bonni, A., Zigmond, M. J., Lin, M. Z., Juo, P., Hu, L. S., ... Greenberg, M. E.
(1999). Akt promotes cell survival by phosphorylating and inhibiting a forkhead
transcription factor. Cell, 96(6), 857–868. />80595-4.
Buchheit, C. L., Rayavarapu, R. R., & Schafer, Z. T. (2012a). The regulation of cancer cell
death and metabolism by extracellular matrix attachment. Seminars in Cell &
Developmental Biology, 23(1096–3634 (Electronic)), 402–411. />1016/j.semcdb.2012.04.007.
Buchheit, C. L., Rayavarapu, R. R., & Schafer, Z. T. (2012b). The regulation of cancer cell
death and metabolism by extracellular matrix attachment. Seminars in Cell &
Developmental Biology, 23(1096–3634 (Electronic)), 402–411. />1016/j.semcdb.2012.04.007.
Carpita, N. C., & McCann, M. C. (1996). Some new methods to study plant polyuronic
acids and their esters. In R. Townsend, & A. Hotchkiss (Eds.). Progress in glycobiology
(pp. 595–661). New York, NY: Marcel Dekker.
Chen, C. H., Sheu, M. T., Chen, T. F., Wang, Y. C., Hou, W. C., Liu, D. Z., ... Liang, Y. C.
(2006). Suppression of endotoxin-induced proinflammatory responses by citrus
pectin through blocking LPS signaling pathways. Biochemical Pharmacology, 72(8),
1001–1009. />D’Arcangelo, M., Drew, Y., & Plummer, R. (2011). The role of PARP in DNA repair and its
therapeutic exploitation. British Journal of Cancer, 105, 1114–1122. />10.1016/B978-0-12-803582-5.00004-8.
Dhanasekaran, D. N. (2013). JNK signaling network and cancer. Genes & Cancer, 4(9–10),
332–333. />do Prado, S. B. R., Ferreira, G. F., Harazono, Y., Shiga, T. M., Raz, A., Carpita, N. C., et al.
(2017). Ripening-induced chemical modifications of papaya pectin inhibit cancer cell
proliferation. Sci. Rep. 7, 16564. />Dumic, J., Dabelic, S., & Flögel, M. (2006). Galectin-3: An open-ended story. Biochimica et
Biophysica Acta, 1760(4), 616–635. />Gao, X., Zhi, Y., Zhang, T., Xue, H., Wang, X., Foday, A. D., ... Zhou, Y. (2012). Analysis of
the neutral polysaccharide fraction of MCP and its inhibitory activity on galectin-3.
Glycoconjugate Journal, 29(4), 159–165. />Gibeaut, D. M., & Carpita, N. C. (1991). Clean-up procedure for partially methylated
alditol acetate derivatives of polysaccharides. Journal of Chromatography, 587,
284–287 />Glinsky, V. V., & Raz, A. (2009). Modified citrus pectin anti-metastatic properties: One
bullet, multiple targets. Carbohydrate Research, 344(14), 1788–1791. />10.1016/j.carres.2008.08.038.
Han, S., Khuri, F. R., & Roman, J. (2006). Fibronectin stimulates non-small cell lung
carcinoma cell growth through activation of Akt/mammalian target of rapamycin/S6
kinase and inactivation of LKB1/AMP-activated protein kinase signal pathways.
Cancer Research, 66(1), 315–323. />Hao, M., Yuan, X., Cheng, H., Xue, H., Zhang, T., Zhou, Y., ... Tai, G. (2013). Comparative
studies on the anti-tumor activities of high temperature- and pH-modified citrus
pectins. Food & Function, 4(6), 960–971. />He, W., Wang, Q., Srinivasan, B., Xu, J., Padilla, M. T., Li, Z., ... Lin, Y. (2013). A JNKmediated autophagy pathway that triggers c-IAP degradation and necroptosis for
anticancer chemotherapy. Oncogene, 33(23), 3004–3013. Retrieved from http://
www.ncbi.nlm.nih.gov/pubmed/23831571.
Inohara, H., & Raz, A. (1995). Functional evidence that cell surface galectin-3 mediates
homotypic cell adhesion. Cancer Research, 55(15), 3267–3271.
Jackson, C. L., Dreaden, T. M., Theobald, L. K., Tran, N. M., Beal, T. L., Eid, M., ...
Mohnen, D. (2007). Pectin induces apoptosis in human prostate cancer cells:
Correlation of apoptotic function with pectin structure. Glycobiology, 17(8), 805–819.
/>Jackson, C. L., Dreaden, T. M., Theobald, K., Tran, N. M., Beal, T. L., Eid, M., ... Stoffel, T.
(2007). Pectin induces apoptosis in human prostate cancer cells: Correlation of
apoptotic function with pectin structure. Glycobiology, 17(8), 805–819. https://doi.
org/10.1093/glycob/cwm054.
Kim, J. B., & Carpita, N. C. (1992). Changes in esterification of the uronic acid groups of
cell wall polysaccharides during elongation of maize coleoptiles. Plant Physiology,
98(2), 646–653. />Leclere, L., Cutsem, P. V., & Michiels, C. (2013). Anti-cancer activities of pH- or heatmodified pectin. Frontiers in Pharmacology, 4, 128. />2013.00128.
Leclere, L., Fransolet, M., Cambier, P., El Bkassiny, S., Tikad, A., Dieu, M., ... Michiels, C.
(2016). Identification of a cytotoxic molecule in heat-modified citrus pectin.
Carbohydrate Polymers, 137, 39–51. />Leclere, L., Fransolet, M., Cote, F., Cambier, P., Arnould, T., Van Cutsem, P., ... Michiels,
C. (2015). Heat-modified citrus pectin induces apoptosis-like cell death and
4. Conclusions
This study demonstrates that treatment with MCP fractions that are
fractionated by molecular size results in diverse effects on cancer cell
proliferation, migration, and aggregation. These effects were size-,
structure-, and cell line-dependent. Beside the smaller sizes, the enrichment of AGI in MCP10/3 and MCP3 with fewer branched structures
(RG-I and AGI) and more de-esterified HG oligomers enhances anticancer effects by inhibiting cancer cell migration, aggregation, and
proliferation. Furthermore, MCP fractions differentially interact with
ECM proteins and galectin-3. Thus, MCP fractionation is an important
tool to define possible structure-function relationships. Furthermore,
we predict that MCP fractionation will be useful in the development of
functional MCP-derived products and food supplements.
Acknowledgements
Authors thank Dhong Hyo Kho and Pratima Nangia-Makker for their
valuable scientific instructions and discussion. This research was financially supported by grants #2012/23970-2 and #2013/07914-8,
São Paulo Research Foundation (FAPESP). A multiuser equipment was
used (#2015/01004-5, São Paulo Research Foundation (FAPESP)).
Scholarships were awarded to SBRP by the National Council for
Scientific and Technological Development (CNPq; 167934/2014-7) and
to TMS (CAPES Process BEX-10734/13-9).
150
Carbohydrate Polymers 211 (2019) 141–151
S.B.R. do Prado et al.
10.1038/sj.cdd.4400598.
Nowak, T. P., Haywood, P. L., & Barondes, S. H. (1976). Developmentally regulated lectin
in embryonic chick muscle and a myogenic cell line. Biochemical and Biophysical
Research Communications, 68(3), 650–657.
O’Keefe, S. J. D. (2016). Diet, microorganisms and their metabolites, and colon cancer.
Nature Reviews Gastroenterology and Hepatology, 13(12), 691–706. />1038/nrgastro.2016.165.
Ochieng, J., Platt, D., Tait, L., Hogan, V., Raz, T., Carmi, P., ... Raz, A. (1993). Structurefunction relationship of a recombinant human galactoside-binding protein.
Biochemistry, 32(16), 4455–4460. Retrieved from />pubmed/8476870.
Pettolino, F., Walsh, C., Fincher, G. B., & Bacic, A. (2012). Determining the polysaccharide composition of plant cell walls. Nature Protocols, 7(9), 1590–1607.
/>Pickup, M. W., Mouw, J. K., & Weaver, V. M. (2014). The extracellular matrix modulates
the hallmarks of cancer. EMBO Report, 15(12), 1243–1253. />15252/embr.201439246.
Platt, D., & Raz, A. (1992). Modulation of the lung colonization of b16-f1 melanoma cells
by citrus pectin. Journal of the National Cancer Institute, 84, 438–442.
Tai, S., Sun, Y., Squires, J. M., Zhang, H., Oh, W. K., Liang, C. Z., ... Huang, J. (2011). PC3
is a cell line characteristic of prostatic small cell carcinoma. Prostate, 71(15),
1668–1679. />Tremaroli, V., & Bäckhed, F. (2012). Functional interactions between the gut microbiota
and host metabolism. Nature, 489(7415), 242–249. />nature11552.
Vieira, A. R., Abar, L., Chan, D. S. M., Vingeliene, S., Polemiti, E., Stevens, C., ... Norat, T.
(2017). Foods and beverages and colorectal cancer risk: A systematic review and
meta-analysis of cohort studies, an update of the evidence of the WCRF-AICR
Continuous Update Project. Annals of Oncology, 28(8), 1788–1802. />10.1093/annonc/mdx171.
Xue, G., & Hemmings, B. A. (2013). PKB/akt-dependent regulation of cell motility.
Journal of the National Cancer Institute, 105(6), 393–404. />jnci/djs648.
Zhang, W., Xu, P., & Zhang, H. (2015). Pectin in cancer therapy: A review. Trends in Food
Science & Technology, 44(2), 258–271. />Zhang, X., Xu, L. H., & Yu, Q. (2010). Cell aggregation induces phosphorylation of
PECAM-1 and Pyk2 and promotes tumor cell anchorage-independent growth.
Molecular Cancer, 9, 1–11. />Zhang, Y., Lu, H., Dazin, P., & Kapila, Y. (2004). Squamous cell carcinoma cell aggregates
escape suspension-induced, p53-mediated anoikis: Fibronectin and integrin αv
mediate survival signals through focal adhesion kinase. Journal of Biological
Chemistry, 279(46), 48342–48349. />Zhao, Y., Hu, X., Liu, Y., Dong, S., Wen, Z., He, W., ... Huang, Q. (2017). ROS signaling
under metabolic stress: Cross-talk between AMPK and AKT pathway. Molecular
Cancer, 16(1), 79. />
autophagy in HepG2 and A549 cancer cells. PloS One, 10(3), e0115831. https://doi.
org/10.1371/journal.pone.0115831.
Louis, P., Hold, G. L., & Flint, H. J. (2014). The gut microbiota, bacterial metabolites and
colorectal cancer. Nature Reviews Microbiology, 12(10), 661–672. />1038/nrmicro3344.
Manrique, G. D., & Lajolo, F. M. (2002). FT-IR spectroscopy as a tool for measuring degree
of methyl esterification in pectins isolated from ripening papaya fruit. Postharvest
Biology and Technology, 25(1), 99–107. />00160-0.
Masgras, I., Carrera, S., De Verdier, P. J., Brennan, P., Majid, A., Makhtar, W., ... Macip, S.
(2012). Reactive oxygen species and mitochondrial sensitivity to oxidative stress
determine induction of cancer cell death by p21. Journal of Biological Chemistry,
287(13), 9845–9854. />Maxwell, E. G., Belshaw, N. J., Waldron, K. W., & Morris, V. J. (2012). Pectin – An
emerging new bioactive food polysaccharide. Trends in Food Science & Technology,
24(2), 64–73. />Maxwell, E. G., Colquhoun, I. J., Chau, H. K., Hotchkiss, A. T., Waldron, K. W., Morris, V.
J., ... Belshaw, N. J. (2016). Modified sugar beet pectin induces apoptosis of colon
cancer cells via an interaction with the neutral sugar side-chains. Carbohydrate
Polymers, 136, 923–929. />Mina-Osorio, P., Soto-Cruz, I., & Ortega, E. (2007). A role for galectin-3 in CD13-mediated
homotypic aggregation of monocytes. Biochemical and Biophysical Research
Communications, 353(3), 605–610. />Mohnen, D. (2008). Pectin structure and biosynthesis. Current Opinion in Plant Biology,
11(3), 266–277. />More, S. K., Chiplunkar, S. V., & Kalraiya, R. D. (2016). Galectin-3-induced cell spreading
and motility relies on distinct signaling mechanisms compared to fibronectin.
Molecular and Cellular Biochemistry, 416(1–2), 179–191. />s11010-016-2706-1.
Moreno-Bueno, G., Peinado, H., Molina, P., Olmeda, D., Cubillo, E., Santos, V., ... Cano, A.
(2009). The morphological and molecular features of the epithelial-to-mesenchymal
transition. Nature Protocols, 4(11), 1591–1613. />152.
Morris, V. J., Belshaw, N. J., Waldron, K. W., & Maxwell, E. G. (2013). The bioactivity of
modified pectin fragments. Bioactive Carbohydrates and Dietary Fibre, 1(1), 21–37.
/>Nangia-Makker, P., Vitaly, B., & Avraham, R. (2012). Galectin-3-binding and metastasis.
Methods in Molecular Biology, 878(18), 241–250. />Naqash, F., Masoodi, F. A., Ahmad Rather, S., Wani, S. M., & Gani, A. (2017). Emerging
concepts in the nutraceutical and functional properties of pectin - a review.
Carbohydrate Polymers, 168, 227–239. />058.
Nicholson, D. (1999). Caspase structure, proteolytic substrates and function during
apoptotic cell death. Cell Death & Differentiation, 6(11), 1028–1042. />
151