LAB REPORT SENSORIAL EVALUATION BF4522E (724580)
Bạn đang xem bản rút gọn của tài liệu. Xem và tải ngay bản đầy đủ của tài liệu tại đây (1.11 MB, 13 trang )
HANOI UNIVERSITY OF SCIENCE AND TECHNOLOGY
SCHOOL OF BIOLOGY & FOOD TECHNOLOGY
LAB REPORT
SENSORIAL EVALUATION BF4522E
(724580)
Group: 3
No. Student name Student ID
HANOI, 12/2022
TABLE OF CONTENTS
Practice 3: Descriptive test (profile)
1. Purpose
2. Principle
3. Procedure
●
●
3.1 Milk Biscuit
3.2 Milk Candy
4. Result
Practice 4: Food sensory analysis by rating method based on TCVN
3215-79
1. Purpose
2. Principle
3. Procedure
●
●
3.1 Milk Biscuit
3.2 Milk Candy
4. Result
PRACTICE 3
2
DESCRIPTIVE TESTS (PROFILE)
1.Purpose
●
Determine the nature and intensity of the products’ differences
2.Principle
Descriptive tests (or profiles) include 2 or more samples and panelists are required to
identify whether there is a difference in a specific sensory property between these
samples and how is the magnitude of this difference. This test is used after we know
the samples are different and we want to know the character of this difference. This
test requires 3 steps:
● Select the properties that need to evaluate;
● Conduct preliminary tests so that we can agree on how to use the given
intensity scale.
● Evaluate the intensity of selected properties.
The person in charge of the experiment or the leader of each experimental group
records the scores given by each member and calculates the average value for each
sample for each criterion.This average value is then presented on the line chart or
spider web chart. The results table is used to calculate the significant difference
between 2 samples: by t-test (in case of 1 criterion) or F-test (in case of all criteria)
3.Procedure
3.1 Materials:
(15 panelists)
-30 dishes
-30 biscuits (15 type A and 15 type B)
-30 candies (15 type A and 15 type B)
-30 cups of water
3.2 Milk biscuit
- Prepare 30 dishes including (15 dishes coded A and 15 dishes coded B)
3
-There are 2 types of milk biscuit from different brands, biscuit’s packages need to be
removed in oder to avoid supposing from participants
-Participants are guilded to know the test procedure and how to fill in the answer sheet.
Criteria includes:
A. Apperance and condition: Color, Shape, Brittleness, Elasticity
B. Aroma: Characteristics candy smell, Caramel smell, Sour smell
C. Flavour: Crispness,Melting in the mouth, Burning taste, Rancidity taste, Musty
taste, Sweetness, Dusty taste
-Each participant receives a set including a dish of sample A and a dish of sample B,
and a cup of water to refresh their taste
-Participants try each sample, then evaluate the score (1-9) and fill in the answer sheet.
-Answer sheet are collected to be analysed.
3.3 Milk candy
- Prepare 30 dishes including (15 dishes coded A and 15 dishes coded B)
-There are 2 types of milk candy from different brands, candy’s packages need to be
removed in oder to avoid supposing from participants
-Participants are guilded to know the test procedure and how to fill in the answer sheet.
The criteria includes:
A. Apperance and condition: Color, Shape, Brittleness, Elasticity
B. Aroma: Characteristics candy smell, Caramel smell, Sour smell
C. Flavour: Crispness,Melting in the mouth, Burning taste, Rancidity taste, Musty
taste, Sweetness, Dusty taste
-Each participant has a set including a dish of sample A and a dish of sample B, and a
cup of water to refresh their taste
-Participants try each sample, then evaluate the score (1-9) and fill in the answer sheet.
-Answer sheet are collected to be analysed.
4.Result
4
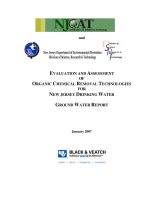
Product: Milk biscuit
Data processing
- Number of panelists: 15
a. Results for sample A
T
T
T
T4
1
2
3
A. Appearance and condition
Color
3
5
6
7
T
5
T6
7
6
Shape
3
7
8
8
Crispness
4
7
8
8.
5
7
4.
5
6
6
6
9
9
7
7
5
6
Criterion
B. Aroma
Characteristi
5
c biscuit
smell
Buttery smell 4
7
Scores of each member
T7 T
T9 T1
T1
8
0
1
4.
5
7.
5
5.
5
8
5.
5
6.
5
5.
5
5.
5
5.
5
5.
5
Burning
smell
Floury smell
2
3
7
1
5
4
6
4
1
7
Musty smell
1
2
2
1
1
C. Flavor
Crispness
4
7
8
7
6
6
T1
2
T1
3
T1
4
T1
5
Av
g
5.
4
5.
2
4.
8
4.4
5.4
7
5.4
4.4
6.4
5.7
4.2
6.4
7
8.5
6.4
7.2
6.5
3.8
7
7
5.5
6.5
7
6.3
8
6.
2
5.4
6.2
8
6.6
7.4
8.4
6.9
5.
5
1.
5
1.
5
1.
5
7
7
5.5
3.5
7
5
6.4
8.8
6.0
1
6
5.4
3.5
3
4
6.4
1
3.7
7
4.
2
3.
8
3.5
4.5
4
7
6.4
2.4
4.5
3.4
1
1
2
1
1
1.9
6.
5
1.
5
4.
5
1
8
4.4
6
6
6
5
9
6.2
5.4
7.5
7
5
6.8
6.2
5.1
5.4
1
6
7
1
1
3.4
1
4.
2
5.
8
5.
2
3.
5
6.
5
5.
4
5.
4
3.5
1
1
3
1
1
1.6
6.6
7
4
8
4.2
5
5.7
6.2
3
2
5
1
2
2.8
6
1
1
4
4.2
5
2.4
T1
2
T1
3
T1
4
T1
5
Av
g
6
9
1
Melting in
the mouth
Stickiness
4
6
2
5
5
5
4
1
3
1
1
8
5
Rancidity
taste
Sweetness
1
1
1
1
1
4
6
5
6
6
3.
2
4
7
6
Saltiness
2
1
5
1
3
3
1
2
Dusty taste
1
1
2
1
1
2
1
1
T
5
T6
1
b. Results for sample B
T
T
T
T4
1
2
3
A. Appearance and condition
Color
8
6
7
6.
5
Shape
8
7
8
9
8
7
6
Crispness
4.
5
8
Criterion
8
B. Aroma
Characteristi
4
c biscuit
smell
8
8
9
8
7
8
7.
5
6
2.
5
Scores of each member
T7 T8 T9 T1
T1
0
1
6.
5
8.
5
8.
5
6
5.
5
8
7
7.
2
5
6.
8
3.
8
6
4.
8
6.2
7.2
5
6.5
7.4
7.6
6.8
3.5
5.5
8
7.2
5.4
7.8
6.6
5.5
7.2
8
8.5
7.4
7.5
7.7
4.8
5.2
6
4.6
5.4
6.2
5.7
Buttery smell
3
7
6
5
6
2.
5
2.
5
2.
5
2.
5
6.
5
2.
5
2.
5
2.
5
6
Burning
smell
Floury smell
3
3
7
1
4
3
6
4
1
5
Musty smell
1
2
2
1
1
C. Flavor
Crispness
8
7
8
9
8
8
7.
5
1
8
Melting in
the mouth
Stickiness
5
7
2
5
3
3
1
3
1
1
8
5
Rancidity
taste
Sweetness
1
1
1
1
1
3
8
6
4
Saltiness
2
1
4
Dusty taste
1
1
2
1
7
1
4
1
3.
5
1
1
1
4
7
6
6
1
4
1
3
1
1
1.
8
3
1
1
Result performance
1. Line graph
2. Spider web graph
6
3.
5
3.
8
5.
2
2.
5
3.5
2.5
6
6
5.4
5.4
5.0
3.8
2.5
2
2
4.4
3.2
3.0
5.2
3.4
5
7
5.2
2.4
4.3
2.2
1
1
2
1
1
1.6
5.
5
3.
4
3.
1
4
5
7.5
7
8
6
8
7.4
3.6
6.4
6
4
5.5
7
4.4
3.2
1
5
5
1
1
2.9
4
1
1
2.8
1
1
1.5
4.2
7.5
4
6
6.4
6.5
5.5
4
3
2
5
1
2
2.6
7
1
1
3
5.4
4
2.6
4.
2
3.
6
6
7
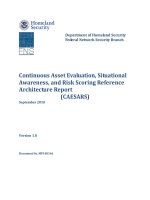
Product: Milk candy
Data processing
- Number of panelists: 15
a. Results for sample A
Scores of each member
Criterion
T
1
T
2
T
3
T
4
T
5
T6
T
7
T8
T9
T1
0
T1
1
T1
2
T1
3
T1
4
T1
5
Av
g
6.
6
7.
5
8
6
6
4.4
6.4
7
7.4
4
6.6
6
8
7.
5
7.
5
7
4.4
5.4
7.4
6
4.2
6.4
5.
5
1.
5
1
4.8
7.4
7
7
4.8
4.8
6
3.5
7.4
8.5
6
4
4.9
A. Appearance and condition
Color
7
6
8
9
5
Shape
7
7
5
7
6
Brittleness
8
5
1
8
1
8
1
Elasticity
5
6
3
2
2
4
7
2.
5
8
Characteristi
c candy
smell
6
4
4
3
2
4
7
4
4.
5
5
3.1
5.4
3
6.5
3.7
4.3
Caramel
smell
5
4
2
5
3
2
6
2
3.
2
2
3
4.2
6.5
3
3.5
3.6
Burning
smell
2
1
3
1
1
1
1
1
1.
5
1
3.5
3.5
1
3
4
1.9
Sour smell
1
1
1
1
1
2
2
1
1
1
4.5
1.8
1
2
5
1.8
B. Aroma
C.
Flavor
Crispness
1
3
6
1
1
7
2
1
1.
5
1
1.8
1
1.3
2
3.2
2.3
Melting in
the mouth
6
4
2
6
5
3
3
5
1.
5
2
4.2
2.2
6
6
4.8
4.0
Burning taste
2
1
4
1
1
2
1
1
1.
5
1
3.8
1
1
1
4.6
1.8
Rancidity
taste
1
1
1
2
1
4
3
1
1
1
3.2
1
1
1
3.4
1.7
Sweetness
7
7
8
8
3
5
4
9
4.
8
7
5.5
7.4
7
7
5.4
6.3
Musty taste
Dusty taste
1
1
1
1
1
2
3
1
1
1
2
6
3
1
1
1
1
1
1
1
3.5
2.6
1
1
1
4
1
1
3.8
3.8
1.7
1.9
T
5
T6
T
7
T8
T9
T1
0
T1
1
T1
2
T1
3
T1
4
T1
5
Av
g
b. Results for sample B
Scores of each member
Criterion
T
1
T
2
T
3
T4
A. Appearance and condition
Color
6
7
7
7
6
7.
8
7
5
8.
2
7
4.8
5.4
8
6.4
5.1
6.5
Shape
8
7
7
9
7
5
5
6.
4.
8
5.4
6.4
8.4
7
5.5
6.6
8
5
5
Brittleness
5
3
1
2
1
6
1
1
2.
5
1
4.4
4.4
7.5
5
4.2
3.3
Elasticity
8
8
6
8
2
8
8
9
7.
5
7
5
4.4
7.4
7.4
5.1
6.7
Characteristi
c candy
smell
7
6
8
7
3
7
7
6
6.
5
5
6
7.4
5
7
5.3
6.2
Caramel
smell
7
5
3
5
4
3
7
4
5.
5
2
6.4
6.4
8
4
5.8
5.1
Burning
smell
2
1
5
1
1
1
1
1
1.
5
1
7.2
2.5
1
3
5.2
2.3
Sour smell
2
1
1
1
1
2
3
1
1
1
4.2
2.8
1
3
5
2.0
B. Aroma
C.
Flavor
Crispness
1
2
3
1
1
4
1
1
5.
5
1
4.8
1
1.5
1
5
2.3
Melting in
the mouth
7
7
2
8
6
6
5
6
5.
5
2
4.5
4.4
8
7
5
5.6
Burning taste
2
1
4
1
1
3
1
1
2.
5
1
4.5
1
1
1
5.2
2.0
Rancidity
taste
1
1
2
1
1
3
1
1
1
1
3.8
1
1
1
4.8
1.6
Sweetness
6
8
9
8.
5
4
6
6
9
3.
5
6
3.8
5.5
8
6
4.6
6.3
Musty taste
1
1
1
1
1
1
1
1
1
1
5
1
1
1
5.5
1.6
Dusty taste
1
1
2
1
1
4
1
1
1
1
4.8
1
1
1
5.2
1.8
Result performance
1. Line graph
2. Spider web graph
9
10
PRACTICE 4:
FOOD SENSORY ANALYSIS BY RATING METHOD
BASED OF TCVN 3215 - 79
1.Purpose
● The rating method is used to evaluate the quality level of a product against a
standard or another product of the same type on all the sensory criteria: color,
taste, condition,
2.Principle
The quality condition of each criterion is assessed by scores. The increase in score is
the increase in quality. Based on the rating method in TCVN 3215-79, scoring is on a
scale from 0 to 5, in which a score of 0 means “defective” quality to the assessed
criteria, and from 1 to 5 means that the defect decreases gradually. The overall quality
of the product is assessed on a 20-points scale.
Importance Factor: Because each criterion has a different effect on the overall quality
of the product, the score values for each criterion are multiplied by 1 corresponding
value called the importance factor. The more important criterion has a larger
importance factor. The importance factors for a food product are given in advance, and
the sum of the importance factors of all the criteria evaluated for a product equals 4.
When evaluating the quality of a product following TCVN 3215-79, the quality score
of a criterion is an average score (also known as the average score without an
importance factor) multiple to its importance factor. The result of this multiple is
called the average score with an importance factor. The sum of all the criteria is the
overall quality score of the product. This score determined the quality of the assessed
product
3.Procedure
3.1 Materials:
(15 panelists)
-30 dishes
-30 biscuits (15 type A and 15 type B)
-30 candies (15 type A and 15 type B)
11
-30 cups of water
3.2 Milk biscuit
- Prepare 30 dishes including (15 dishes coded A and 15 dishes coded B)
-There are 2 types of milk biscuit from different brands, biscuit’s packages need to be
removed in oder to avoid supposing from participants
-Participants are guilded to know the test procedure and how to fill in the answer sheet.
Criteria includes: Outside condition, Inside condition, Aroma, Taste
-Each participant receives a set including a dish of sample A and a dish of sample B,
and a cup of water to refresh their taste
-Participants try each sample, then evaluate the score (0-5) and fill in the answer sheet.
-Answer sheet are collected to be analysed.
3.3 Milk candy
- Prepare 30 dishes including (15 dishes coded A and 15 dishes coded B)
-There are 2 types of milk candy from different brands, candy’s packages need to be
removed in oder to avoid supposing from participants
-Participants are guilded to know the test procedure and how to fill in the answer sheet.
Criteria includes: Outside condition, Inside condition, Aroma, Taste
-Each participant receives a set including a dish of sample A and a dish of sample B,
and a cup of water to refresh their taste
-Participants try each sample, then evaluate the score (0-5) and fill in the answer
sheet.
-Answer sheet are collected to be analysed
4.Result
12
Product: Milk biscuit
Result
Scores of each member
Criterion
Total
T1 T2 T3 T4 T5 T6 T7 T8 T9
T10...
Outside condition A 5; 5; 3; 4; 5; 5; 4; 3; 3; 3; 4; 2; 3; 3; 3
Inside condition
Aroma
Taste
Average
score w/o
importance
factor
55
55
3.67
5; 5; 4; 4; 3; 4; 5; 4; 4; 4; 3; 2; 3; 4; 5
59
3.93
B 5; 5; 3; 3; 4; 4; 5; 3; 4; 2; 2; 5; 4; 4; 4
57
A 4;
4; 4; 3; 5; 2; 4; 3; 4; 3; 3; 3; 3; 3; 5
53
3.53
B 2; 2; 3; 2; 3; 3; 5; 5; 4; 3; 2; 2; 4; 4; 3
47
3.13
4; 4; 4; 3; 4; 3; 5; 3; 3; 4; 4; 2; 2; 3; 5
53
3.53
A
B 3; 3; 3; 4; 3; 5; 4; 4; 4; 2; 3; 3; 4; 4; 4
Quality score :
0,8
2.936
3.93
1
3.80
53
Average
score with
importance
factor
2.936
3.67
B 4; 4; 4; 3; 3; 3; 5; 4; 3; 3; 2; 5; 3; 4; 5
A
Importance
factor
3.80
0.706
0,2
0.626
7.06
2
3.53
7.06
- A: 14.6
- B: 14.2
Quality level of
- Sample A: Medium
- Sample B: Medium
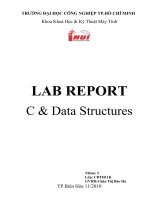
Product: Milk candy
Criterion
Scores of each member
T1 T2 T3 T4 T5 T6 T7
T8 T9 T10 T11 T12 T13
T14 T15
Total
Outside condition A
3,3,4,4,4,3,4,4,4,3,3,3,4,3,4
53
3.53
B
4,3,5,3,5,4,4,4,4,4,4,4,3,4,3
58
3.87
Inside condition
A
3,2,4,4,3,4,4,4,2,3,3,4,4,4,4
52
3.47
B
4,4,5,5,5,3,4,4,4,4,3,3,3,3,4
58
3.87
Aroma
A
2,2,3,2,2,2,4,2,2,4,2,3,2,2,2
36
Taste
B
A
3,3,3,5,5,5,4,2,4,5,4,4,5,3,5
2,2,3,3,2,5,0,2,2,3,2,3,2,4,2
B
3,4,3,5,5,4,4,2,4,3,5,4,4,2,4
Quality score:
Quality level of
Average
score w/o
importance
factor
Importance
facor
Average
score with
importance
factor
0.8
2.83
1
3.47
2.4
0.2
0.48
60
37
4
2.47
2
0.8
4.93
56
3.73
3.09
3.87
7.47
- A:11.71
-B:15.23
-Sample A: Medium
13
-Sample B: Good