Genetic characterization and genome-wide association mapping for stem rust resistance in spring bread wheat
Bạn đang xem bản rút gọn của tài liệu. Xem và tải ngay bản đầy đủ của tài liệu tại đây (2.61 MB, 15 trang )
(2022) 23:11
Shewabez et al. BMC Genomic Data
/>
BMC Genomic Data
Open Access
RESEARCH ARTICLE
Genetic characterization and genome-wide
association mapping for stem rust resistance
in spring bread wheat
Elias Shewabez1* , Endashaw Bekele1, Admas Alemu2, Laura Mugnai3 and Wuletaw Tadesse4
Abstract
Background: Emerging wheat stem rust races have become a major threat to global wheat production. Finding
additional loci responsible for resistance to these races and incorporating them into currently cultivated varieties
is the most economic and environmentally sound strategy to combat this problem. Thus, this study was aimed at
characterizing the genetic diversity and identifying the genetic loci conferring resistance to the stem rust of wheat.
To accomplish this, 245 elite lines introduced from the International Center for Agricultural Research in the Dry Areas
(ICARDA) were evaluated under natural stem rust pressure in the field at the Debre Zeit Agricultural Research Center,
Ethiopia. The single nucleotide polymorphisms (SNP) marker data was retrieved from a 15 K SNP wheat array. A mixed
linear model was used to investigate the association between SNP markers and the best linear unbiased prediction
(BLUP) values of the stem rust coefficient of infection (CI).
Results: Phenotypic analysis revealed that 46% of the lines had a coefficient of infection (CI) in a range of 0 to 19.
Genome-wide average values of 0.38, 0.20, and 0.71 were recorded for Nei’s gene diversity, polymorphism information
content, and major allele frequency, respectively. A total of 46 marker-trait associations (MTAs) encompassed within
eleven quantitative trait loci (QTL) were detected on chromosomes 1B, 3A, 3B, 4A, 4B, and 5A for CI. Two major QTLs
with –log10 (p) ≥ 4 (EWYP1B.1 and EWYP1B.2) were discovered on chromosome 1B.
Conclusions: This study identified several novel markers associated with stem rust resistance in wheat with the
potential to facilitate durable rust resistance development through marker-assisted selection. It is recommended that
the resistant wheat genotypes identified in this study be used in the national wheat breeding programs to improve
stem rust resistance.
Keywords: Markers, Puccinia graminis f. sp. tritici, QTL, GWAS, SNP
Background
Wheat (Triticum aestivum L.) is a leading crop, both in
terms of economic value and area of production worldwide [1, 2]. Developing countries account for nearly 77%
of total global wheat imports [3]. Wheat provides nearly
20% of daily world human caloric requirements [4] and
*Correspondence:
1
Department of Microbial, Cellular and Molecular Biology, Addis Ababa
University, P.O. Box 1176, Addis Ababa, Ethiopia
Full list of author information is available at the end of the article
demand is expected to increase to 60% by 2050 [5].
However, various challenges have hindered meeting this
demand, with recurrent emerging fungal pathogens proving to be one of the leading problems worldwide [6].
Wheat stem (black) rust, caused by Puccinia graminis
Pers. f. sp. tritici, Eriks. & E. Henn (Pgt), has been recognized as a major threat to global food security [7, 8]. Concerns regarding this disease have increased significantly,
especially following the 1998 outbreak of the novel virulent race Ug99 which originated in Uganda. Since then,
this race has produced 13 different variants throughout
© The Author(s) 2022. Open Access This article is licensed under a Creative Commons Attribution 4.0 International License, which
permits use, sharing, adaptation, distribution and reproduction in any medium or format, as long as you give appropriate credit to the
original author(s) and the source, provide a link to the Creative Commons licence, and indicate if changes were made. The images or
other third party material in this article are included in the article’s Creative Commons licence, unless indicated otherwise in a credit line
to the material. If material is not included in the article’s Creative Commons licence and your intended use is not permitted by statutory
regulation or exceeds the permitted use, you will need to obtain permission directly from the copyright holder. To view a copy of this
licence, visit http://creativecommons.org/licenses/by/4.0/. The Creative Commons Public Domain Dedication waiver (http://creativeco
mmons.org/publicdomain/zero/1.0/) applies to the data made available in this article, unless otherwise stated in a credit line to the data.
Shewabez et al. BMC Genomic Data
(2022) 23:11
East Africa [9, 10]. The race can infect 90% of the wheat
varieties grown worldwide [11] and yield losses can reach
up to 100% in susceptible cultivars under conducive environmental conditions [12]. Races other than Ug99 were
also reported in different parts of Western Europe. In
2013, a stem rust epidemic arose in Germany and spread
to Denmark, Sweden, and the UK [13]. In 2016/2017,
Italy chronicled two epidemics of wheat stem rust caused
by race TTRTF, which destroyed tens of thousands of
hectares of cultivated wheat [14]. All these reports indicate that the disease is re-emerging as a threat to wheat
production globally.
Ethiopia is considered to be a hotspot for the development and evolution of new Pgt races [15]. Many new
variants of Pgt, which were first identified in this country, have spread to different parts of the world. TTKSK,
TKTTF, TRTTF, JRCQC, and TTTTF are the current
major wheat stem races that are threatening wheat productivity in Ethiopia [16]. In 2013/2014, severe stem rust
epidemics were caused by Pgt race TKTTF (not a member of Ug99 lineage), resulting in almost total yield loss
on widely grown wheat cultivars. Since then, this race has
spread widely and has been found in 10 different countries, including Western Europe [17].
To overcome this problem, host plant resistance developed through molecular marker technology is the most
sustainable, cost-effective, and environmentally friendly
approach for controlling rust diseases [7, 18]. Accordingly, many molecular markers linked with Pgt resistance
were discovered throughout the wheat genome during
the past couple of decades using genome-wide association mapping (GWAS). GWAS has been the most effective tool to detect several quantitative trait loci (QTLs),
with moderate to minor effects against Pgt disease [19].
However, factors such as population structure and kinship similarity should be controlled properly to avoid
false-positive QTLs. To overcome this, several models, including the mixed linear model (MLM) have been
implemented. Since the first report in 2007 [20], various
GWAS studies were carried out successfully and high
numbers of QTLs have shown Pgt resistance in wheat
[21–24]. So far, more than 80 genes conferring resistances to Pgt have been cataloged in common wheat and
wheat relatives [24]. However, only a few genes are effective against all pathogen strains. Of these, Sr2, Sr13, Sr22,
Sr25, Sr26, Sr35, Sr39, and Sr40 were reported to be the
most effective against Ug99 [18].
The frequent co-evolution of host and pathogen
remains a big challenge in the durability of the released
resistant cultivars [25]. The narrow genetic diversity of
cultivated wheat cultivars [22, 26] and the impact of climate change [12] are the major cause of this problem.
Thus, additional sources of resistant QTLs, followed by
Page 2 of 15
marker-assisted gene pyramiding, are required to produce durable resistant varieties. Therefore, this study
aimed to characterize the genetic diversity and to identify novel QTLs associated with resistance to stem rust of
wheat through GWAS.
Results
Phenotypic variation and heritability
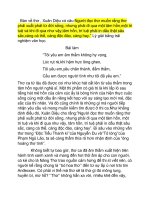
The performance of genotypes towards stem rust resistance varied greatly. For instance, the disease severity
score was ranged between 10 and 80%. The majority
(46.7%) had a disease severity (DS) score of 15–30%
whilst 8.5% had a DS score of 0% (Fig. 1, Additional file 1).
The best linear unbiased estimates (BLUP) values of DS
and coefficient of infection (CI) were calculated from
adjusted means of each accession across two years, and
are summarized in Fig. 1.
The data of disease severity (DS) and infection response
(IR) were combined to define the disease response as the
coefficient of infection (CI) and 71% of lines had less than
30 (Fig. 1C). Of these, the top twenty resistance lines
(presented in Table 1) ranged with the average CI values
of 4.5 for pedigree SERI.1B//KAUZ/HEVO/3/AMAD/4/
CHAM-6/FLORKWA-2 to 12 for pedigree SERI.1B//
KAUZ/HEVO/3/AMAD/4/WEAVER/JACANA. Additional genotypes scored between 6 to 80 of CI and are
presented in Additional file 1. On the other hand, all
local controls (i.e. Digelu, Kubssa, Hidasse, Honqolo, and
Ogolcho) were susceptible, with average CI ranging from
60 for HIDASSE to 80 for OGOLCHO and HONQOLO.
The ANOVA analysis revealed highly significant variation among genotypes (P < 0.001) and genotype x year
interactions (P < 0.001) for all parameters. Heritability
(H) values for DS were 79% and IR 72%, suggesting that
all parameters had a strong genetic basis. In addition,
the disease distribution of the breeding lines was high
between seasons, with average correlations of 0.76, 0.85,
and 0.78 for DS, IT, and CI, respectively (Table 2).
Population structure and genetic diversity analysis
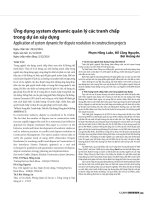
The population structure of the panel was inferred
through the Bayesian clustering model, principal component analysis (PCA), and neighbor-joining (NJ) tree. The
Bayesian clustering model applied on STRUCTURE software and subsequent application of STRUCTURE HARVESTER showed a delta K peak value of two (Fig. 2A). As
a result, accessions were classified into two sub-populations composed of 106 and 139 lines in sub-populations
1 and 2, respectively (Fig. 2C). The scree plot of PCA
showed that weak kinship existed among the lines. For
the first 10 principal components (PCs), variances of SNP
markers were changed from 7.5% (PC1) to 2% (PC10) and
between 0 and 2% after PC10 (Fig. 2B).
Shewabez et al. BMC Genomic Data
(2022) 23:11
Page 3 of 15
Fig. 1 Distribution of adult plant stage disease resistance (APR) response and best linear unbiased estimates (BLUPs) as disease severity (DS), and
coefficient of infection (CI). (A) BLUPs of DS; (B) BLUPs of CI; (C) Frequency of genotypes for disease severity (DS); (D) frequency of genotypes for the
coefficient of infection
Phylogenetic tree analysis of the genetic relationship between the populations was carried out based on
the distance-based neighbor-joining tree on TASSEL
software v5.2.35 followed by web-based visualization
software iTOL. The resulting dendrogram shows three
phylogenetic groups color-coded with a STRUC TURE
probability distribution. This is not consistent with the
STRUC TURE result (which was two groups). Since the
genotypes are elite lines, passed by complex breeding
history, such inconsistency is expected. However, the
majority of lines were still grouped in the same group as
the STRUC TURE result and some lines were grouped
in the mixed group. For instance, 78 (56%) of the lines
in the first group were composed of a sub-population 1,
whereas 61 lines (44%) were categorized in subpopulation 2. The second group was composed mainly of subpopulation 2, which consists of 49 (70%) lines; whereas
21 (30%) lines were classified in subpopulation 1. The
third group was composed of 58 (76%) lines from subpopulation 2, and 21 (30%) lines from subpopulation
1(Fig. 3).
Genetic data and linkage disequilibrium
Once sub-optimal quality markers had been filtered out,
9523 SNP markers were retained from 245 lines. The distribution of SNPs across the A, B, and D sub-genomes
was 50, 39, and 11%, respectively. The maximum number
of SNP markers was recorded on chromosome 2B (930)
and the minimum number was on chromosome 4D (48)
(Fig. 4). The mean genome-wide heterozygosity, genomewide polymorphic information content (PIC), and gene
diversity were 0.006, 0.2, and 0.38, respectively. The PIC
scores of SNPs varied, with only 1% being highly informative (> 0.5), while 75 and 24% of markers had moderate
(0.25–0.5) and least (< 0.2) PIC scores, respectively.
Linkage disequilibrium decay based on SNP markers of
each chromosome was calculated as the Pearson correlation coefficient (r2) between marker pairs as a function
of genetic distance (cM). The LOESS curve intercepted
the line of critical value at 6 cM in A genome, 8 cM in B
genome, and 5 cM in D genome, indicating that all markers within these ranges were considered as a single locus
(Fig. 5).
Shewabez et al. BMC Genomic Data
(2022) 23:11
Page 4 of 15
Table 1 Lists of top resistant lines and their pedigree during 2017/2018 main season at Debre Zeit Agricultural Research Center,
Ethiopia
No
Pedigree
Disease severity and response to Sr
2018
2019
1
SERI.1B//KAUZ/HEVO/3/AMAD/4/CHAM-6/FLORKWA-2
10RMR
15MR
2
SERI.1B//KAUZ/HEVO/3/AMAD/4/MO88/MILAN
15MR
10MR
3
SERI.1B//KAUZ/HEVO/3/AMAD/4/TNMU/MILAN/5/WATAN-12
15MR
10MR
4
PBW343*2/KUKUN//22SAWSN – 97
10MRMS
15MR
5
SERI.1B//KAUZ/HEVO/3/AMAD/4/ESDA/SHWA//BCN
10MR
10MR
6
SERI.1B*2/3/KAUZ*2/BOW//KAUZ/4/SHIHAB-7
10MR
10MR
7
CROC-1/AE.SQUARROSA (224)//OPATA/3/FLAG-7
10MR
10MR
8
TRACHA-2/SHUHA-3/3/SHUHA-7//SERI 82/SHUHA’S′
15MRMS
10MRMS
9
SERI.1B//KAUZ/HEVO/3/AMAD/4/PFAU/MILAN
15MR
10MR
10
WATAN-7/SEKHRAH-2
10MR
15MRMS
11
WEAVER/WL 3928//SW 89.3064/3/SOMAMA-3
15MRMS
10MR
12
SERI.1B//KAUZ/HEVO/3/AMAD/4/SHUHA-7//SERI 82/SHUHA’S′
15MR
15MS
13
KAUZ’S′/SERI/3/TEVEE’S′//CROW/VEE’S′
15MRMS
15MR
14
ATTILA*2/CROW/3/VEE#5/SARA//DUCULA
15MR
15MR
15
TILILA/MUBASHIIR-1
15MR
15MR
16
QAFZAH-27/SEKSAKA-6
15MR
15MR
17
SERI.1B*2/3/KAUZ*2/BOW//KAUZ/4/SHIHAB-7
15MR
15MR
18
STAR*3/LOTUS-5/3/CHUM//7*BCN/4/FLAG-2
15MR
10MR
19
HADIAH-14/ANGI-2
10MRMS
15MRMS
20
SERI.1B//KAUZ/HEVO/3/AMAD/4/WEAVER/JACANA
15MR
15MR
Table 2 Mean response, variance component estimates and
heritability for IR, DS, and CI variables
DS (%)
IR(0–1)
CI
Range
10–80
0.3–1
3–80
Grand mean
33.90
0.8
28.27
26.902
BLUEs
32.60
0.8
σ2G
385.3***
0.013***
374.5***
σ2E
21.05*
0.000ns
15.7 ns
σ2GxE
20.70**
0.005ns
24.1**
σ error
166.10
0.004
200.3
H
78.95
72.2
75.7
CV
r
37.93 0.76
8.52 0.85
50.06 0.78
2
Disease severity (DS); infection response (IR); coefficient of infection (CI); BLUEs,
best linear unbiased estimate; σ2G estimate of genotypic variance; σ2E estimate
of environmental variance; σ2GxE is the genotype by environment interaction
variance, σ2 error is the residual error variance; heritability (H); r Pearson’s
correlation coefficients among stem rust DS, IT, and CI between two seasons.
*, **, *** and ns represents significance at P < 0.05, P < 0.01, P < 0.001, and not
significant, respectively
Marker‑trait associations
A mixed linear model (MLM) was implemented for
MTA, including the population structure and kinship
similarity matrix (Q + K) and the BLUPs estimated values
of CI of genotypes and quality checked SNP markers. The
model appropriately discovered valuable MTAs with neither inflation (false-positive/type I error) nor overcorrection (false-negative/type II error) problems as depicted
from the Q-Q plot (Fig. 8).
A total of 46 MTAs included in 11 QTLs were discovered for CI with the considered exploratory significant
threshold (−log1o(p) ≥ 3). The highest number of MTAs
(44) was detected on the B sub-genome, of which 36, 4,
3, and 1 MTAs were located on chromosomes 1B, 3B,
4B, and 5B, respectively (Table 3, Fig. 7). The remaining
2 QTLs were identified from chromosomes 3A and 4A.
The explained phenotypic variance of QTLs was taken
from the most significant SNP marker (QTL tag-SNP).
The three QTLs with high explained phenotypic variance
(PV) of tag SNPs were EWYP1B.4 (8.8%), EWYP1B.5
(8.37%), and EWYP1B.3 (8.16%). The other PV of QTLs
tag-SNPs ranged from 7.48 to 4.76% (Table 3, Fig. 7).
Details of markers distribution in each accession are presented in Additional file 1.
Discussion
Stem rust has been increasing in severity and incidence
and now poses a serious threat to global wheat production [8]. To overcome this threat, efforts are ongoing
Shewabez et al. BMC Genomic Data
(2022) 23:11
Page 5 of 15
Fig. 2 Structure clustering and principal components of 245 wheat lines based on 9523 SNP markers. (A) Plots of delta K; (B) Scree plot of PCA and
(C) probability of population group based on K = 2
worldwide to monitor rust diseases, identify rust pathotypes, and evaluate wheat germplasm for rust resistance
[36]. As part of the global effort, this study was designed
to quantify the existing allelic variation of breeding lines
and to search for sources of resistant QTL for Pgt resistance. Consequently, 245 elite bread wheat lines were
evaluated in the field condition to identify QTLs for
adult plant resistance to wheat stem rust. A significant
variation was observed between breeding lines for adult
plants’ resistance to stem rust. This study detected several MTAs included in 11 different QTLs with different
effects that could potentially play an important role in
future marker-assisted pyramiding against the disease.
[38]. Accordingly, many field evaluation studies for Pgt
response have been carried out in different wheat-growing regions of the country [22, 39, 40]. Most elite breeding lines skewed towards moderate resistance, although
some differences were observed between individual
genotypes. The two parameters (i.e. DS and IR) showed
moderate to high heritability with significant variation
among lines and genotype x year interactions, indicating that most of the existing variation was due to genetic
bases. CI has been used as the most efficient trait to discover QTLs of stem rust resistance in wheat via GWAS
analysis [23, 41].
Field evaluation of wheat germplasm for resistance to stem
rust
Systematic characterization of population structure
and genetic diversity provides a foundation for efficient
exploitation of genetic resources and can enhance breeding for durable stem rust resistance in wheat. For the
population structure study, three different approaches
were applied. Although there is considerable overlap
between the three techniques for population analysis, the
overall conclusion suggests that there is no clear and substantial separation between individual genotypes. This
could be owing to the panel’s complicated evolutionary
and breeding history. It is suggested that more researches
Disease response characterization under high disease
pressure in field conditions remains the best stem rust
management strategy in breeding for developing stem
rust-resistant cultivars [37]. Ethiopia is considered to be
a hotspot for the development of Pgt race diversity and
frequent disease epidemics. Studies carried out in Ethiopia showed that most previously identified races such
as TTKSK, TKTTF, TTTTF, TRTTF, RRTTF, and others were virulent on most varieties grown in the country
Population structure and genetic diversity
Shewabez et al. BMC Genomic Data
(2022) 23:11
Page 6 of 15
Fig. 3 A dendrogram illustrating the clusters of wheat lines based on Nei’s genetic distance. The lines were color-coded with STRUC TURE
probability distribution. Clusters with similar pedigrees and genetic backgrounds were named by their common parent
Fig. 4 Genome-wide distributions of single nucleotide polymorphisms (SNPs) based on 15 K genotyping results
Shewabez et al. BMC Genomic Data
(2022) 23:11
need to be done to better understand the relationships
between genotypes from different groups.
The mean PIC and gene diversity of the genome was
0.25 and 0.3, respectively. Several studies have previously
reported various rates of Nei’s gene diversity and PIC in
different wheat populations [22, 34, 42–44].
Linkage disequilibrium and MTAs
The LD of the genome and sub-genomes of the current
panel was estimated using SNP markers. The fastest LD
decay was observed on the D sub-genome, which agreed
with the previous report [45]. The LOESS curve intercepted the line of critical value at 6 cM in A genome, at
8 cM in B genome, and 5 cM in the D genome, indicating
that all markers within these ranges are considered as a
single locus (Fig. 5). Since many significant SNP markers
(36 MTAs) were identified in the present study, the LD
pattern in chromosome 1B was analyzed independently
and detected five LD blocks (Fig. 6). Similar large LD
blocks in 1B chromosomes have been reported previously [46].
The current study unveiled 46 SNP significant markers
encompassed within 11 QTLs. Of these, only two QTLs
(EWYP1B.1, EWYP1B.2) were identified as major QTLs
(−log1o(p) ≥ 4). EWYP1B.1, EWYP3A, EWYP3B.1, and
EWYP5B, respectively, were found near genomic areas
of Sr31, Sr27, Sr2, and Sr56 [33]. The remaining seven
QTLs (EWYP1B.2, EWYP1B.3, EWYP1B.4, EWYP1B.5,
EWYP3B.2, EWYP4A, and EWYP4B) were newly discovered in the current study. These new QTLs could
play paramount importance in enhancing Pgt resistance
through marker-assisted selection or introgression.
We found five QTLs on chromosome 1B (EWYP1B.1,
EWYP1B.2, EWYP1B.3, EWYP1B.4, and EWYP1B.5) that
encompassed 36 MTAs ranging in size from 30.34 cM
(wsnp_Ku_c13229_21142792) to 114 cM (Tdurum_contig10036_977). On this chromosome, three resistance
genes (Sr14, Sr31, and Sr58) were cataloged previously
[32]. Of these, only Sr31 has been reported in association
with wheat stem rust disease at locus EWYP1B. 1[27,
28]. The remaining four QTLs (EWYP1B.2, EWYP1B.3,
EWYP1B.4, and EWYP1B.5) were likely novel resistance
loci identified in the current study. Four of the 36 MTAs
found on this chromosome have previously been associated to other wheat diseases: snp_BE442716B_Ta_2_1
and wsnp_Ex_rep_c69266_68192766 with stripe rust
[47], wsnp_Ex_c38116_45719983 with Fusarium head
Page 7 of 15
blight [48], and BS00070139_51 with crown rot resistance [49].
On chromosomes 3A, 3B, 4A, 4B, and 5B, the additional six QTLs containing 10 MTAs were discovered.
The marker Tdurum_contig777_260 (IWB73429) designated as EWYP3A QTL was adjacent to the all-stage
resistance gene Sr27 which is transferred from Secale
cereale and Sr35 gene which is transferred from Triticum monococcum [32]. Because EWYP3A is so close
to the Sr27 gene area, Sr27 is most likely the underlying gene for this region. On the short arm of chromosome 3B, Sr2 came from Triticum dicoccum and Sr12
originated from Triticum turgidum ssp. were cataloged
previously [32]. On this chromosomal, we discovered
the EWYP3B.1 QTL, which consists of three markers
(Tdurum_contig12899_342, Excalibur_c20277_483, and
Tdurum_contig12008_803). The nearest Sr gene to these
markers was the Sr2 gene [30, 31]. This Sr2 gene has been
extensively used in breeding as a source of durable and
broad-spectrum adult plant resistance. Individual genotypes carrying the favorable allele of these SNP markers have shown an apparent difference in the CI score
(Additional file 1). On chromosome 5B, the SNP marker
RAC875_c30011_426 (IWB56412) explained 5.7% of the
total phenotypic variation. This marker is found near the
chromosome region previously discovered the Sr56 gene
that confers the APR to wheat stem rust [32, 33]. To the
best of our knowledge, the other three QTLs, EWYP3B.2,
EWYP4A, and EWYP4B, which were found on chromosomes 3B, 4A, and 4B, respectively, have never been
reported and could potentially be novel QTL sources for
stem rust resistance breeding programs.
Conclusions
This study characterized the genetic diversity of elite
ICARDA breeding lines and performed GWAS based
on the evaluation of field stem rust. As a result, substantial genetic variability and field disease response to Pgt
was observed among the lines. The study detected several potentially novel loci associated with Pgt resistance.
These markers could provide useful genetic information
to unlock the genetic basis of resistance to Pgt in wheat.
Furthermore, the result will accelerate the introgression
of identified resistance QTLs in the wheat breeding program through marker-assisted introgression. The identified resistant lines could also be used as crossing parents
in stem rust-resistant breeding programs.
(See figure on next page.)
Fig. 5 Scatterplots showing genome-wide linkage disequilibrium (LD) decays based on 15 K genotyping results in 245 wheat breeding lines. R2
as a function of genetic distance (cM) between pairs of SNP markers estimated for A, B, and D sub-genomes. (A) LD for A sub-genome; (B) LD of B
sub-genome; (C) LD of D sub-genomes. The LOESS representing the decay of R2along genetic distance is illustrated for each genome. LD critical
threshold estimated from LD distribution of pairs of unlinked SNP markers is indicated by the dashed horizontal red line
Shewabez et al. BMC Genomic Data
Fig. 5 (See legend on previous page.)
(2022) 23:11
Page 8 of 15
EWYP1B.4
EWYP1B.3
EWYP1B.2
C/T
tplb0048b10_1365
IWB74900
A/G
wsnp_CAP11_c543_375403
wsnp_Ex_rep_c66389_64588992
IWA775
IWA5228
T/G
RAC875_c7674_634
BS00011973_51
IWB60433
IWB6504
A/G
A/G
G/A
C/T
Kukri_c73734_175
T/C
G:T
IWB47566
BS00038929_51
tplb0023b14_704
IWB8148
A/G
C/T
A/G
A/C
C/T
C/T
T/G
G/A
T/C
C/T
T/G
A/G
T/C
T/C
IWB74145
RAC875_c32894_1038
RAC875_c5796_424
IWB56778
IWB59327
BS00070139_51
Excalibur_c59016_839
IWB10444
IWB27852
Ku_c13515_171
IACX2701
IWB38394
IWB35871
JD_c64600_281
wsnp_BE442716B_Ta_2_1
IWB37720
IWA106
RAC875_c44575_561
BobWhite_c1318_691
IWB58051
IWB461
GENE-0193_197
wsnp_Ku_c30982_40765254
IWB31732
IWA6890
wsnp_Ex_c38116_45719983
Ra_c23839_884
IWA3631
C/T
C/A
wsnp_BE443531B_Ta_1_1
Kukri_rep_c101799_95
IWA131
IWB48689
IWB51549
T/C
wsnp_Ex_rep_c69266_68192766
BS00011450_51
IWA5592
IWB6405
T/C
RAC875_c18282_1390
C/A
A/G
IWB54643
Kukri_c26168_423
Excalibur_c20228_135
IWB43258
C/T
T/C
A/G
T/C
Alleles
IWB23446
Excalibur_c94756_540
BobWhite_c22266_315
IWB29475
IWB1569
wsnp_Ku_c13229_21142792
Excalibur_c95327_51
IWA6489.1
IWB29508
EWYP1B.1
Markers Name
SNPs
QTLs
1B
1B
1B
1B
1B
1B
1B
1B
1B
1B
1B
1B
1B
1B
1B
1B
1B
1B
1B
1B
1B
1B
1B
1B
1B
1B
1B
1B
1B
1B
1B
1B
1B
Chra
79.77
79.77
76.89
76.89
76.89
76.89
70.08
68.04
68.04
68.04
68.04
68.04
67.38
67.14
67.14
67.14
66.73
66.07
66.07
65.42
65.42
64.89
64.46
64.32
64.1
64.1
64.1
64.1
60.62
60.62
57.6
43.86
30.34
Posb
552.5332
561.70458
542.43163
531,855,670
532.56545
532,565,453
438.2896
417.85674
IWB59327
unknown
426.07288
418.16246
413.08886
unknown
403,156,221
409.62805
387.64464
325.79901
336.20988
367.44095
367.44011
340.37296
unknown
156.68751
318.23318
299.97785
unknown
305.2701
1.417758
329.48968
unknown
9.37986
unknown
Posc
Table 3 Lists of QTLs identified for adult plant resistance (APR) to wheat stem rust
0.110672
0.110672
0.217391
0.280632
0.27668
0.213439
0.339921
0.150198
0.150198
0.150198
0.150198
0.150198
0.098814
0.102767
0.102767
0.893281
0.150198
0.075099
0.075099
0.146245
0.146245
0.079051
0.114625
0.114625
0.13834
0.094862
0.090909
0.094862
0.462451
0.213439
0.41502
0.418972
0.213439
MAF
3.731492
3.731492
3.044683
3.485333
3.545613
4.268153
3.35714
3.618055
3.618055
3.354313
3.618055
3.618055
3.795799
3.67975
3.67975
3.718149
3.618488
3.973875
4.081555
3.471958
3.61409
3.957779
3.490435
3.490435
3.473183
3.668026
3.676459
3.717446
3.07204
4.17831
3.398788
3.000182
4.398146
–log10P
7.28
7.28
5.89
6.78
7.40
8.37
6.59
7.03
7.03
8.83
7.03
7.03
7.43
7.15
7.15
7.48
7.03
8.40
7.97
6.74
7.02
7.72
6.77
6.77
6.74
7.13
7.15
7.27
6.06
8.16
6.63
5.91
7.14
R2
0.0080
0.0080
0.0282
0.0282
0.0282
0.0282
0.0245
0.0080
0.0080
0.0080
0.0080
0.0080
0.0208
0.0208
0.0208
0.0208
0.0080
0.0266
0.1850
0.0080
0.0080
0.0775
0.0231
0.0231
0.0080
0.0130
0.0171
0.0130
0.0171
0.0050
0.0163
0.0265
0.0192
FDRd
Sr31
Sr genes
new
new
new
Mettin et al., 1973 [27]; Zeller, 1973 [28]
References
Shewabez et al. BMC Genomic Data
(2022) 23:11
Page 9 of 15
RAC875_c13639_2159
RAC875_c30011_426
IWB53758
IWB56412
C/T
T/C
T/C
G/A
G/A
C/T
T/C
A/G
T/C
G/A
C/A
A/G
A/G
Alleles
5B
4B
4B
4B
4A
3B
3B
3B
3B
3A
1B
1B
1B
Chra
104.55
62.92
62.22
64.58
26.5
20.14
9.7
9.7
9.7
20.74
114.13
112.07
105.83
Posb
571.47521
272.17459
Unknown
232.88033
9.92939
7.373615
5.584656
5.58572
5.585837
102.20749
634.6536
unknown
629.26299
Posc
7.08548
0.098814
0.098814
0.094862
0.150198
0.434783
0.395257
0.371542
0.379447
0.339921
0.094862
0.335968
0.27668
MAF
2.9914
3.126412
3.126412
3.73037
3.240453
3.022107
3.016518
3.042077
3.484232
3.609065
3.49178
3.732007
3.778586
–log10P
5.77
4.76
4.76
7.26
6.40
5.95
5.83
5.88
6.90
7.12
6.81
7.26
7.61
R2
0.0210
0.0190
0.073
0.0208
0.260
0.0208
0.0210
0.0210
0.0210
0.0080
0.0080
0.0080
0.0080
FDRd
Sr56
Sr2
Sr27
Sr genes
Park 2016 [32]; Yu et al., 2014 b[33]
new
new
new
Ausemus et al., 1946 [30]; Knott, 1968 [31]
McIntosh et al., 1995 [29]
new
References
QTLs Quantitative trait loci, SNPs Single nucleotide polymorphism, Chra Chromosome position, Posb Marker’s genetic position mapped in the wheat 90KSNP consensus map [34] in centimorgans (cM); P
osc, marker’s
physical position produced by the International Wheat Genome Sequencing Consortium (IWGSC RefSeq v1.0 )[35] in megabase pairs (Mbp); F DRd, The false-discovery rate adjusted P-values; (MAF), minor allele frequency;
R2, phenotypic variance explained by the markers
EWYP5B
Excalibur_c29127_552
Kukri_c8973_1986
IWB24798
EWYP4B
tplb0059m03_622
Tdurum_contig59603_74
IWB48189
IWB75222
IWB72664
EWYP3B.2
Excalibur_c20277_483
Tdurum_contig12008_803
IWB23457
IWB67389
EWYP4A
Tdurum_contig12899_342
IWB67769
EWYP3B.1
Tdurum_contig10036_977
Tdurum_contig777_260
IWB66198
IWB73429
Tdurum_contig32775_78
IWB70380
EWYP3A
BS00072791_51
IWB10621
EWYP1B.5
Markers Name
SNPs
QTLs
Table 3 (continued)
Shewabez et al. BMC Genomic Data
(2022) 23:11
Page 10 of 15
Shewabez et al. BMC Genomic Data
(2022) 23:11
Page 11 of 15
Fig. 6 The linkage disequilibrium blocks formed by the 36 significantly associated SNPs with APR to stem rust on chromosome 1B
Materials and methods
Plant materials, field stem rust trials, and disease
pathotyping
A set of 245 elite breeding lines was obtained from the
International Center for Agricultural Research in the
Dry Areas (ICARDA) shuttle breeding program. Field
screening was conducted in Ethiopia for two consecutive
cropping seasons (2018 and 2019) at the Debre Zeit Agricultural Research Center (DARC). DARC is located at 08°
44′ N latitude and 38° 58′ E longitude and 1900 m.a.s.l with
19 °C annual average temperature and 851 mm rainfall. The
experiment was conducted using an augmented design,
including five local cultivars (Digelu, Kubssa, Hidasse,
Honqolo, and Ogolcho) as checks. Each line was planted in
a 1 m long single row and the distance between rows was
30 cm. The border of each block was surrounded by susceptible local spreader wheat varieties to promote natural
stem rust infection.
Stem rust phenotyping was conducted based on disease
severity (DS) and infection response (IR) under natural disease pressure [50]. Both parameters were recorded three
times for each line in each year. The highest recorded value
was then taken for the GWAS analysis after calculating the
coefficient of infection (CI) from the two parameters (i.e.
DS and IR).
The CI was calculated by multiplying the DS by a constant value of IR recorded according to Yu et al. (2011).
IR values were recorded with the following scale: immune
(I) = 0.0, R (resistant) = 0.2, resistant to moderately resistant (RMR) = 0.3, moderately resistant (MR) = 0.4, moderately resistant to moderately susceptible (MRMS) = 0.6,
moderately susceptible (MS) = 0.8, moderately susceptible
to susceptible (MSS) = 0.9 and susceptible (S) = 1.0.
Statistical analysis of phenotypic data
Analysis of variance (ANOVA) was performed for DS,
IR, and CI using the nlme package in the R 4.0.2 environment (Pinheiro et al., 2020) fitting the value of DS, IR, and
CI as a function of lines, years, and a combination of lines
and years. To determine the consistency of DS, IR, and
CI, Pearson correlation coefficients between seasons were
calculated.
Broad-sense heritability (H 2) was calculated using the
following formula:
Shewabez et al. BMC Genomic Data
(2022) 23:11
Page 12 of 15
Fig. 7 GWAS results of the Manhattan plot along with the 21 chromosomes showing significantly associated markers with adult plant stem rust
resistance. The position of each marker was based on the wheat consensus SNP map [34]
Fig. 8 Q-Q plot for stem rust resistance in a panel of 245 wheat breeding lines using the MLM model. The plots show the observed p-values (p) for
the association between CI and each tested marker expressed as –log 10 (P-value) of p (y-axis) plotted against –log10 P of the expected p-values
(x-axis) under the null hypothesis of no association for the analyses
Shewabez et al. BMC Genomic Data
(2022) 23:11
2
G
H 2= σ2 G+(σ2 GXEσ)/n+
( σ2 error )/n
Where σ2 G is the genotypic variance, σ2 E is the environmental variance, σ2GXE is the genotype by environment
interaction variance, σ2 error is the residual error variance
and n is the number of years.
To reduce false-positive associations, best linear unbiased predictors (BLUPs) for CI were calculated using a
mixed model in lme4 package implemented in R environment [51] according to the following model where y is the
response variable:
y = lmer Trait ∼ 1|Genetype + (1|Year)
Population structure and genetic diversity
The optimal sub-populations of the panel were estimated based on three different approaches. The Bayesian model-based population structure was estimated
from 100 unlinked SNP markers located at least 10 cM
apart across the genome using STRUCTURE 2.3.1 software [52, 53]. To execute this, three independent runs
were performed for each hypothetical K value run from
2 to 15 with the length of the burn-in period of 10,000
steps followed by 100,000 Monte Carlo Markov Chain
(MCMC). The results obtained from this procedure were
used in a web-based informatics tool namely, “Structure Harvester” [54] to define the optimal K value, based
on ∆K method Evanno, 2005 [55]. Each genotype was
assigned to one subpopulation based on its membership probability. The second approach used to determine
the optimal subpopulation was based on a marker-based
kinship matrix (K matrix) on a scaled identity-by-state
method using the whole set of SNP markers from TASSEL 5 software [56]. Finally, the principal components
analysis (PCA) of genetic relatedness was performed with
the same software and added to the regression model as
a covariant.
Genetic diversity was estimated based on polymorphic
information content (PIC), heterozygosity, and Nei’s gene
diversity using the whole set of SNP markers from PowerMarker 3.25 software [57]. Phylogenetic analysis based
on distance-based neighbor-joining method was calculated with TASSEL 5 software and visualized through
web-based program iTOL (v 4.3.2) [58].
Genotyping, linkage disequilibrium, and genome‑wide
association analysis
DNA extraction of lines was carried out on one-week-old
seedlings following the protocol described by Allen et al.
(2006) [59] using Cetyeltrimethylammonium bromide
Page 13 of 15
(CTAB). Genotyping was performed by Illumina iSelect
15 K single nucleotide polymorphism (SNP) wheat array
and called by GenomeStudio V2011.1 software. The
resulting 13,006 SNPs were further screened using those
only minor allelic frequency (MAF) > 5%, and missing
data percentage of < 10%. Five lines were excluded as a
result of this screening. Finally, 9523 quality SNP markers
were generated from 245 lines that were used for further
analysis.
The resulting SNP data were subjected to linkage disequilibrium (LD) analysis as squared allelic frequency
correlations (R2) between each pair implemented in
TASSEL v5.2 and GAPIT (Genomic Association and
Prediction Integrated Tool) R package [60]. The critical R2 value (where the LD is due to the physical linkage) was determined by taking the 95% of
R2 data
of unlinked markers as the threshold, according to
Breseghello and Sorrells (2006) [61].
Marker-trait association analysis (MTAs) between
the BLUP value of CI and SNPs markers were analyzed
using a mixed linear model (MLM) in TASSEL 5.2 software. Using the formula: y = Xα + Qδ + Kμ + e; where
y = phenotypic values, X is SNP marker genotypes,
α is a vector containing fixed effects as a result of the
genotype, Q is population structure as PCA, δ is a vector containing fixed effects resulting from population
structure, K is the relative kinship matrix, μ is a vector of random additive genetic effects and e is a vector
of residuals. Marker trait associations were declared
significant at a threshold value of –log10 (p) ≥ 3 (corresponding p value ≤ 0.001) [62].
Abbreviations
ANOVA: Analysis of variance; BLUP: Best linear unbiased prediction; CI: Coefficient of infection; DARC: Debre Zeit Agricultural Research Center; GWAS:
Genome-wide association study; DS: Disease severity; ICARDA: International
Center for Agricultural Research in the Dry Areas; IR: Infection response; LD:
Linkage disequilibrium; MAF: Minor allele frequency; MAS: Marker-assisted
selection; MCMC: Markov chain Monte Carlo; MLM: Mixed Linear Model; MTA:
Marker-trait association; PC: Principal components; PCA: Principal component
analysis; Pgt: Wheat stem rust fungus Puccinia graminis; PIC: Polymorphism
information content; PV: Phenotypic variance; QQ: Quantile-quantile; QTL:
Quantitative trait locus; SNP: Single nucleotide polymorphism.
Supplementary Information
The online version contains supplementary material available at https://doi.
org/10.1186/s12863-022-01030-4.
Additional file 1: List of pedigree stem rust response and associated SNPs
for wheat stem rust.
Acknowledgments
This project is a part of ICARDA’s shuttle breeding program which has been
designed for performing stem rust resistance screening. Authors acknowledge
Debre Zeit Agricultural Research Center for facilitating field experiments.
Shewabez et al. BMC Genomic Data
(2022) 23:11
Authors’ contributions
ES, WT, and EB conceived and designed the study. WT designed the study
and provided the germplasm and the genotypic data. EB guided the project
development. ES wrote this manuscript. ES and AA performed data analysis.
LM edited the manuscript. All authors read and approved the final manuscript.
Funding
This research did not receive any specific grant from funding agencies in the
public, commercial, or not-for-profit sector.
Availability of data and materials
The datasets generated and/or analyzed during the current study are available
in the figshare data repository, https://doi.org/10.6084/m9.figshare.17711150.
v3.
Declarations
Ethics approval and consent to participate
Not applicable.
Consent for publication
Not applicable.
Competing interests
The authors declare that they have no competing interests.
Author details
1
Department of Microbial, Cellular and Molecular Biology, Addis Ababa
University, P.O. Box 1176, Addis Ababa, Ethiopia. 2 Department of Biology,
Debre Tabor University, P.O. Box 272, Debre Tabor, Ethiopia. 3 Department
of Agriculture, Food, Environment and Forestry, University of Florence, Piazzale
delle Cascine 18 ‑ 50144, Firenze, FI, Italy. 4 International Center for Agricultural
Research in the Dry Areas (ICARDA), P.O. Box 6299, Rabat, Morocco.
Received: 22 December 2020 Accepted: 31 January 2022
References
1. Giraldo P, Benavente E, Manzano-Agugliaro F, Gimenez E. Worldwide
research trends on wheat and barley: A bibliometric comparative analysis. Agronomy. 2019;9:352.
2. Marocco E, Milo M. Food Outlook. 2019.
3. Enghiad A, Ufer D, Countryman AM, Thilmany DD. An Overview of Global
Wheat Market Fundamentals in an Era of Climate Concerns. Int. J Agron.
2017;2017.
4. Lucas H. Breakout session P1.1 National Food Security-The Wheat Initiative-an International Research Initiative for Wheat Improvement. Second
Glob Conf Agric Res Dev. 2012;September:1–3:www.wheatinitiative.org.
5. Schütz H, Jansen M, Verhoff MA. Vom alkohol zum liquid ecstasy
(GHB) - Ein überblick über alte und moderne K.-o.-Mittel - Teil
3: γ-Hydroxybuttersäure (GHB, “liquid ecstasy”). Arch Kriminol.
2011;228:151–9.
6. Figueroa M, Hammond-Kosack KE, Solomon PS. A review of wheat
diseases—a field perspective. Mol Plant Pathol. 2018;19:1523–36.
7. Gao L, Rouse MN, Mihalyov PD, Bulli P, Pumphrey MO, Anderson JA.
Genetic characterization of stem rust resistance in a global spring wheat
germplasm collection. Crop Sci. 2017;57:2575–89.
8. Long L, Yao F, Yu C, Ye X, Cheng Y, Wang Y, et al. Genome-Wide Association Study for Adult-Plant Resistance to Stripe Rust in Chinese Wheat
Landraces (Triticum aestivum L.) From the Yellow and Huai River Valleys.
Front. Plant Sci. 2019;0:596.
9. Fetch T, Zegeye T, Park RF, Hodson D, Wanyera R. Detection of wheat stem
rust races TTHSK and PTKTK in the Ug99 race group in Kenya in 2014.
Plant Dis. 2016;100:1495.
10. Newcomb M, Olivera PD, Rouse MN, Szabo LJ, Johnson J, Gale S, et al.
Kenyan isolates of Puccinia graminis f. sp. tritici from 2008 to 2014:
Virulence to SrTmp in the Ug99 race group and implications for breeding
programs. Phytopathology. 2016(106):729–36.
Page 14 of 15
11. Singh RP, Hodson DP, Huerta-Espino J, Jin Y, Bhavani S, Njau P, et al. The
emergence of Ug99 races of the stem rust fungus is a threat to world
wheat production. Annu Rev Phytopathol. 2011;49:465–81.
12. Prank M, Kenaley SC, Bergstrom GC, Acevedo M, Mahowald NM. Climate
change impacts the spread potential of wheat stem rust, a significant
crop disease. Environ Res Lett. 2019;14.
13. Saunders DGO, Pretorius ZA, Hovmøller MS. Tackling the re-emergence of
wheat stem rust in Western Europe. Commun Biol. 2019;2:9–11. https://
doi.org/10.1038/s42003-019-0294-9.
14. Olivera PD, Sikharulidze Z, Dumbadze R, Szabo LJ, Newcomb M, Natsarishvili K, et al. Presence of a Sexual Population of Puccinia graminis f.
sp. tritici in Georgia Provides a Hotspot for Genotypic and Phenotypic
Diversity. Phytopathology®. 2019;109:2152–60. https://doi.org/10.1094/
PHYTO-06-19-0186-R.
15. Leppik EE. Gene Centers of Plants as Sources of Disease Resistance. Annu
Rev Phytopathol. 1970;8:323–44.
16. Hundie B. Evaluation of Advanced Bread Wheat Lines for Field and Seedling Resistance to Stem Rust (<i>Puccinia graminis</i> f. sp. <i>triticii>). Am J Biol Environ Stat. 2018;4:74.
17. Rahmatov M, Pretorius ZA, Bhavani S. Sources of Stem Rust Resistance in Wheat-Alien Introgression Lines. 2016. https://doi.org/10.1094/
PDIS-12-15-1448-RE.
18. Aktar-Uz-Zaman M, Tuhina-Khatun M, Hanafi MM, Sahebi M. Genetic
analysis of rust resistance genes in global wheat cultivars: an overview.
Biotechnol Biotechnol Equip. 2017;31:431–45. https://doi.org/10.1080/
13102818.2017.1304180.
19. Alqudah AM, Sallam A, Stephen Baenziger P, Börner A. GWAS: Fastforwarding gene identification and characterization in temperate Cereals:
lessons from Barley – A review. J Adv Res. 2020;22:119–35.
20. Crossa J, Burgueño J, Dreisigacker S, Vargas M, Herrera-Foessel SA, Lillemo
M, et al. Association analysis of historical bread wheat germplasm using
additive genetic covariance of relatives and population structure. Genetics. 2007;177:1889–913.
21. Yu LX, Lorenz A, Rutkoski J, Singh RP, Bhavani S, Huerta-Espino J,
et al. Association mapping and gene-gene interaction for stem rust
resistance in CIMMYT spring wheat germplasm. Theor Appl Genet.
2011;123:1257–68.
22. Muleta KT, Rouse MN, Rynearson S, Chen X, Buta BG, Pumphrey MO. Characterization of molecular diversity and genome-wide mapping of loci
associated with resistance to stripe rust and stem rust in Ethiopian bread
wheat accessions. BMC Plant Biol. 2017;17:134. https://doi.org/10.1186/
s12870-017-1082-7.
23. Gao L, Turner MK, Chao S, Kolmer J, Anderson JA. Genome Wide Association Study of Seedling and Adult Plant Leaf Rust Resistance in Elite Spring
Wheat Breeding Lines. PLoS One. 2016;11:e0148671. https://doi.org/10.
1371/journal.pone.0148671.
24. Leonova IN, Skolotneva ES, Orlova EA, Orlovskaya OA, Salina EA. Detection of genomic regions associated with resistance to stem rust in
Russian spring wheat varieties and breeding germplasm. Int J Mol Sci.
2020;21:1–13.
25. Tadesse W, Halila H, Jamal M, Hanafi S, Assefa S, Oweis T, et al. Role of
Sustainable Wheat Production to Ensure Food Security in the CWANA
region. J Exp Biol Agric Sci. 2017;5 Spl-1-SAFSAW:15–32.
26. Novoselović D, Bentley AR, Šimek R, Dvojković K, Sorrells ME, Gosman N,
et al. Characterizing Croatian wheat germplasm diversity and structure in
a European context by DArT markers. Front Plant Sci. 2016;7:184.
27. Mettin D, Bluthner WD, Schlegel G. Additional evidence on spontaneous
1B/1R wheat-rye substitutions and translocations. Proc fourth Int wheat
Genet Symp Alien Genet Mater. 1973;4:179–84.
28. Zeller FJ. 1B/1R wheat-rye chromosome substitutions and translocations.
Proc fourth Int wheat Genet Symp Alien Genet Mater. 1973;4:209–21.
29. McIntosh RA, Wellings CR, Park R. Wheat Rusts: An Atlas of Resistance
Genes. Australas Plant Pathol. 1996;25:70.
30. Ausemus ER, Harrington JB, Reitz LP, Worzella WW. A summary of genetic
studies in hexaploid and tetraploid wheats. J Am Soc Agronomy.
1946;38:1082–99.
31. Knott DR. The inheritance of resistance to stem rust races 56 and
15B-1L (Can.) in the wheat varieties Hope and H-44. Can J Genet Cytol.
1968;10:311–20.
32. Park RF. Wheat: Biotrophic Pathogen Resistance. In: Reference Module in
Food Science. Amsterdam: Elsevier; 2016.
Shewabez et al. BMC Genomic Data
(2022) 23:11
33. Yu LX, Barbier H, Rouse MN, Singh S, Singh RP, Bhavani S, et al. A consensus map for Ug99 stem rust resistance loci in wheat. Theor Appl Genet.
2014;127:1561–81. https://doi.org/10.1007/s00122-014-2326-7.
34. Wang S, Wong D, Forrest K, Allen A, Chao S, Huang BE, et al. Characterization of polyploid wheat genomic diversity using a high-density 90 000
single nucleotide polymorphism array. Plant Biotechnol J. 2014;12:787–
96. https://doi.org/10.1111/pbi.12183.
35. Appels R, Eversole K, Feuillet C, Keller B, Rogers J, Stein N, et al. Shifting
the limits in wheat research and breeding using a fully annotated reference genome. Science. 2018;2018:361. https://doi.org/10.1126/SCIENCE.
AAR7191.
36. Bhardwaj SC, Singh GP, Gangwar OP, Prasad P, Kumar S. Status of
wheat rust research and progress in rust management-Indian context.
Agronomy. 2019;9:1–14.
37. Singh RP, Hodson DP, Jin Y, Lagudah ES, Ayliffe MA, Bhavani S, et al. Emergence and spread of new races of wheat stem rust fungus: Continued
threat to food security and prospects of genetic control. Phytopathology.
2015;105:872–84.
38. Mitiku M, Bacha Hei N, Abera M. Characterization of Slow Rusting Resistance Against Stem Rust (Puccinia graminis f. sp. tritici) in Selected Bread
Wheat Cultivars of Ethiopia. Adv Crop Sci Technol. 2018;06:389.
39. Abebe T, Dawit W, Woldeab G. Physiological Races and Virulence Diversity
of Puccinia graminis pers. f. sp. tritici eriks. & e. Henn. on Wheat in Tigray
Region of Ethiopia. Int J Phytopathol. 2013;2:01–7.
40. Hei N, Shimelis HA, Laing M, Admassu B. Assessment of Ethiopian wheat
lines for slow rusting resistance to stem rust of wheat caused by Puccinia
graminis f.sp. tritici. J Phytopathol. 2015;163:353–63.
41. Yu L-X, Morgounov A, Wanyera R, Keser M, Singh SK, Sorrells M. Identification of Ug99 stem rust resistance loci in winter wheat germplasm using
genome-wide association analysis. Theor Appl Genet. 2012;125:749–58.
https://doi.org/10.1007/s00122-012-1867-x.
42. Wang Y, Yu C, Cheng Y, Yao F, Long L, Wu Y, et al. Genome-wide association mapping reveals potential novel loci controlling stripe rust resistance
in a Chinese wheat landrace diversity panel from the southern autumnsown spring wheat zone. BMC Genomics. 2021;22:1–15. https://doi.org/
10.1186/s12864-020-07331-1.
43. Yang X, Tan B, Liu H, Zhu W, Xu L, Wang Y, et al. Genetic Diversity and
Population Structure of Asian and European Common Wheat Accessions Based on Genotyping-By-Sequencing. Front Genet. 2020;11
September:1–14.
44. Tadesse W, Suleiman S, Tahir I, Sanchez-Garcia M, Jighly A, Hagras A, et al.
Heat-tolerant QTLs associated with grain yield and its components in
spring bread wheat under heat-stressed environments of Sudan and
Egypt. Crop Sci. 2019;59:199–211.
45. Sehgal D, Autrique E, Singh R, Ellis M, Singh S, Dreisigacker S. Identification of genomic regions for grain yield and yield stability and their
epistatic interactions. Sci Rep. 2017;7:1–12. https://doi.org/10.1038/srep4
1578.
46. Joukhadar R, Daetwyler HD, Gendall AR, Hayden MJ. Artificial selection
causes significant linkage disequilibrium among multiple unlinked genes
in Australian wheat. Evol Appl. 2019;12:1610–25.
47. Zegeye H, Rasheed A, Makdis F, Badebo A, Ogbonnaya FC. Genome-Wide
Association Mapping for Seedling and Adult Plant Resistance to Stripe
Rust in Synthetic Hexaploid Wheat. PLoS One. 2014;9:e105593. https://
doi.org/10.1371/journal.pone.0105593.
48. Aviles AC, Harrison SA, Arceneaux KJ, Brown-Guidera G, Mason RE, Baisakh N. Identification of qtls for resistance to fusarium head blight using
a doubled haploid population derived from southeastern united states
soft red winter wheat varieties ags 2060 and ags 2035. Genes (Basel).
2020;11:1–18.
49. Rahman M, Davies P, Bansal U, Pasam R, Hayden M, Trethowan R. Markerassisted recurrent selection improves the crown rot resistance of bread
wheat. Mol Breed. 2020;40.
50. Roelfs AP, Singh RP, Saari EE. Concepts and methods of disease management; 1992.
51. Bates D, Maechler M, Bolker B, Walker S, Christensen RHB, Singmann H,
et al. Linear mixed-effects model using “Eigen” and S4, R Package Version
1.1–23. 2020. https://github.com/lme4/lme4/. Accessed 3 Oct 2020.
52. Pritchard JK, Stephens M, Donnelly P. Inference of Population Structure
Using Multilocus Genotype Data. 2000. http://www.stats.ox.ac.uk/pritch/
home.html. Accessed 9 Sep 2020.
Page 15 of 15
53. Falush D, Stephens M, Pritchard JK. Inference of population structure
using multilocus genotype data: Dominant markers and null alleles. Mol
Ecol Notes. 2007;7:574–8.
54. Earl DA, vonHoldt BM. STRUC TURE HARVESTER: A website and program
for visualizing STRUC TURE output and implementing the Evanno
method. Conserv Genet Resour. 2012;4:359–61. https://doi.org/10.1007/
s12686-011-9548-7.
55. Evanno G, Regnaut S, Goudet J. Detecting the number of clusters of
individuals using the software STRUC TURE: A simulation study. Mol Ecol.
2005;14:2611–20.
56. Bradbury PJ, Zhang Z, Kroon DE, Casstevens TM, Ramdoss Y, Buckler ES.
TASSEL: Software for association mapping of complex traits in diverse
samples. Bioinformatics. 2007;23:2633–5.
57. Liu K, Muse SV. PowerMaker: An integrated analysis environment for
genetic maker analysis. Bioinformatics. 2005;21:2128–9.
58. Letunic I, Bork P. Interactive Tree Of Life (iTOL): An online tool for phylogenetic tree display and annotation. Bioinformatics. 2007;23:127–8.
59. Allen GC, Flores-Vergara MA, Krasynanski S, Kumar S, Thompson WF. A
modified protocol for rapid DNA isolation from plant tissues using cetyltrimethylammonium bromide. Nat Protoc. 2006;1:2320–5. https://doi.org/
10.1038/nprot.2006.384.
60. Lipka AE, Tian F, Wang Q, Peiffer J, Li M, Bradbury PJ, et al. GAPIT: Genome
association and prediction integrated tool. Bioinformatics. 2012;28:2397–
9. https://doi.org/10.1093/bioinformatics/bts444.
61. Breseghello F, Sorrells ME. Association Mapping of Kernel Size and Milling
Quality in Wheat (Triticum aestivum L.) Cultivars. Genetics. 2006;172:1165.
https://doi.org/10.1534/GENETICS.105.044586.
62. Sukumaran S, Reynolds MP, Sansaloni C. Genome-wide association analyses identify QTL hotspots for yield and component traits in durum wheat
grown under yield potential, drought, and heat stress environments.
Front Plant Sci. 2018;9:81.
63. Linear T, Mixed N, Models E, Fit D, Hmisc S. Package ‘ nlme .’ 2020.
Publisher’s Note
Springer Nature remains neutral with regard to jurisdictional claims in published maps and institutional affiliations.
Ready to submit your research ? Choose BMC and benefit from:
• fast, convenient online submission
• thorough peer review by experienced researchers in your field
• rapid publication on acceptance
• support for research data, including large and complex data types
• gold Open Access which fosters wider collaboration and increased citations
• maximum visibility for your research: over 100M website views per year
At BMC, research is always in progress.
Learn more biomedcentral.com/submissions