Interleukin 20 receptor subunit beta (IL20RB) predicts poor prognosis and regulates immune cell infiltration in clear cell renal cell carcinoma
Bạn đang xem bản rút gọn của tài liệu. Xem và tải ngay bản đầy đủ của tài liệu tại đây (6.66 MB, 14 trang )
BMC Genomic Data
(2022) 23:58
Zhang et al. BMC Genomic Data
/>
Open Access
RESEARCH
Interleukin 20 receptor subunit beta (IL20RB)
predicts poor prognosis and regulates immune
cell infiltration in clear cell renal cell carcinoma
Haoxun Zhang, Yiwen Liu, Bowen Wang and Chunyang Wang*
Abstract
Background and objective: Emerging evidence has proven the robust role of tumor mutation burden (TMB) and
immune cell infiltration (ICI) in cancer immunotherapy. However, the precise effect of TMB and ICI on clear cell renal
cell carcinoma (ccRCC) remains elusive and merits further investigation. Therefore, we aim to identify the TMB-related
genes in predicting prognosis and to explore the potential mechanisms of the identified Interleukin 20 receptor subunit beta (IL20RB) in ICI in ccRCC.
Method: The relative information of patients with ccRCC was obtained from The Cancer Genome Atlas database
(TCGA). Immune-related genes were downloaded from the Immunology Database and Analysis Portal database. Cox
regression analysis was used to identify prognosis-related immune genes for ccRCC. The relationship of IL20RB expression levels with clinicopathological parameters was analyzed using the “limma” and “survival” packages. Gene Expression Omnibus (GEO) and International Cancer Genome Consortium (ICGC) databases were used as external validation.
Quantitative Real-time PCR (qRT-PCR) and western blots were used to validate the expression levels of IL20RB in tumor
cells. Cell counting kit-8 (CCK-8) assay and colony formation assay were used to examine the effect of IL20RB on the
viability of ccRCC cells. Gene set enrichment analysis (GSEA) was introduced for the analysis of IL20RB-related signaling
pathways. Tumor Immune Estimation Resource (TIMER) and Tumor and Immune System Interaction Database (TISIDB)
were utilized to determine the correlation of IL20RB expression levels with tumor-infiltrating immune cells (TIICs).
Results: IL20RB was significantly overexpressed in different ccRCC tissues and cells. High IL20RB expression in ccRCC
patients was associated with short overall survival, high tumor grade, and advanced TNM stage. After knockdown of
IL20RB with small interfering RNA (siRNA) technology, ccRCC cells’ proliferation was significantly attenuated. Moreover,
overexpression of IL20RB could increase the infiltration level of several immune cells, especially T follicular helper cells
(Tfh), and overexpressed Tfh cells were correlated with poor prognosis in ccRCC.
Conclusions: IL20RB may function as an immune-associated therapeutic target for it determines cancer progression
and regulates immune cell infiltration in ccRCC.
Keywords: Immune cell infiltration, IL20RB, Prognosis, Proliferation, Biomarker
*Correspondence:
The First Affiliated Hospital of Harbin Medical University, Harbin Medical
University, Harbin, Heilongjiang, China
Introduction
Renal cell carcinoma (RCC) ranks among the top ten
most frequently diagnosed cancers worldwide, and it
accounts for approximately 3% of cancers in adulthood
[1, 2]. Clear cell RCC (ccRCC) is the major histopathological subtype of RCC, accounting for nearly 75% of all
© The Author(s) 2022. Open Access This article is licensed under a Creative Commons Attribution 4.0 International License, which
permits use, sharing, adaptation, distribution and reproduction in any medium or format, as long as you give appropriate credit to the
original author(s) and the source, provide a link to the Creative Commons licence, and indicate if changes were made. The images or
other third party material in this article are included in the article’s Creative Commons licence, unless indicated otherwise in a credit line
to the material. If material is not included in the article’s Creative Commons licence and your intended use is not permitted by statutory
regulation or exceeds the permitted use, you will need to obtain permission directly from the copyright holder. To view a copy of this
licence, visit http://creativecommons.org/licenses/by/4.0/. The Creative Commons Public Domain Dedication waiver (http://creativeco
mmons.org/publicdomain/zero/1.0/) applies to the data made available in this article, unless otherwise stated in a credit line to the data.
Zhang et al. BMC Genomic Data
(2022) 23:58
RCC cases [3]. The main treatments for localized RCC
include partial or radical nephrectomy, radiofrequency
ablation, and active surveillance (monitoring of tumor
growth with periodic radiographic studies) [4–6]. However, the treatment options for advanced ccRCC patients
are still very limited, and the 5-year survival rate is only
approximately 12% [1, 7].
Recently, immunotherapy has been considered an
effective therapeutic method [8], and nivolumab plus
cabozantinib was approved in January 2021 by the United
States Food and Drug Administration as the first-line
therapy for advanced RCC [9]. However, only a limited
number of patients benefit from such therapy, while the
majority of them fail to respond to treatment [10]. Therefore, it is imperative to explore the molecular mechanism
and biomarkers predicting the response to immunotherapy. At present, a series of important molecular determinants, including cytotoxic T lymphocyte antigen-4
(CTLA4), programmed death-ligand 1 (PD-L1), DNA
mismatch-repair deficiency, and tumor-infiltrating lymphocytes (TILs), have been identified for this purpose in
diverse types of cancer [11–13].
Tumor mutation burden (TMB) refers to the quantity of somatic coding mutations per MB (million bases)
[14]. To date, TMB has been implicated in tumorigenesis and predicting the response and survival prognosis to immune checkpoint blockade (ICB) in various
types of cancers [15, 16]. A previous study examined the
prognostic value of TMB and its potential relationship
with immune cell infiltration (ICI) and immunotherapy
responsiveness in ovarian cancer [17]. However, whether
TMB is associated with prognosis and ICI in ccRCC
remains mysterious. Thus, in this research, we took
advantage of bioinformatics resources and methods combined with molecular biology to identify and verify that
IL20RB was an effective prognostic predictor involved in
TMB and ICI in ccRCC.
Materials & methods
Data acquisition and processing
Gene expression profiles and corresponding clinical
data for 539 ccRCC and 72 paracancerous samples were
downloaded using the Cancer Genome Atlas (TCGA,
http://cancergenome.nih.gov/) database. The format
of the downloaded clinical data was “BCR-XML”, and
to increase the accuracy of the data, we excluded samples whose follow-up time was < 30 days. Three gene
expression profile datasets, GSE40435, GSE46699, and
GSE53757, were downloaded from the GEO database
(https://www.ncbi.nlm.nih.gov/geo/). The GSE46699 and
GSE53757 were based on the GPL570 platform, and the
GSE40435 was based on the GPL15008 platform. Additionally, gene expression data and survival information of
Page 2 of 14
ccRCC patients were downloaded from the ICGC database (http://icgc.org/). Data were downloaded only from
public databases without any ethical conflicts.
TMB calculation
Somatic mutation data were (n = 336) downloaded
from TCGA database and the workflow type of was set
as “VarScan2 Variant Aggregation and Masking”. Subsequently, we analyzed and visualized the somatic mutation
data via the “maftools” package in the R 4.0.3 programming language. According to the median value of TMB,
which was acquired based on a calculation of the number
of TMBs per MB, the patients were categorized into lowTMB and high-TMB groups. Kaplan–Meier analysis was
used to show the survival difference between the high
and low TMB expression groups.
Kyoto Encyclopedia of Genes and Genomes (KEGG)
pathway enrichment and Gene Ontology (GO) analyses
The DEGs in the two groups were identified using the
“limma” package in the R programming language, and the
thresholds were set to P < 0.05 and |Log FC | > 1. KEGG
pathway enrichment and GO analyses were conducted
using the R programming language to investigate the
potential roles of DEGs [18–20].
Cox regression analysis
Immune-related genes were downloaded from the Immunology Database and Analysis Portal (ImmPort, http://
www.immport.org/) database. Venn diagrams exhibited
the immune-related DEGs. Cox regression analysis was
used to identify prognosis-related immune genes for
ccRCC, and forest plots were drawn with the Sangerbox
online tool (http://www.sangerbox.com/tool).
Identification and validation of prognosis‑related immune
genes
Gene Expression Profiling Interactive Analysis (GEPIA,
http://gepia.cancer-pku.cn/index.html) was utilized to
analyze gene expression levels and plot survival curves.
The University of ALabama at Birmingham CANcer data
analysis Portal (UALCAN, http://ualcan.path.uab.edu/
home) was used to further compare the levels of expression and promoter methylation of IL20RB between normal and tumor tissues. Survival analysis was performed
to determine whether there was a difference in survival
rates between different IL20RB expression-dependent
groups. The “limma” and “survival” packages in the R
programming language were used to analyze the relationship of IL20RB expression levels with clinicopathological parameters. GEO and ICGC databases were used to
Zhang et al. BMC Genomic Data
(2022) 23:58
validate the expression and survival difference of IL20RB
in ccRCC.
Cell cultures
Human ccRCC cell lines 786–0 and normal control cells,
Human kidney 2 (HK-2) cells, were obtained from the
Cell Resources Center of the Chinese Academy of Sciences (Shanghai, China). A498 and RC-2 cancer cells
were obtained from Procell Life Science&Technology
Co., Ltd. (Wuhan, China). All cancer cells were cultured
in MEM with a 10% serum concentration, 100 U/mL penicillin, and 0.1 mg/mL streptomycin (Gibco, Invitrogen,
Carlsbad, CA, USA). HK-2 cells were cultured in RPMI1640 with a 10% serum concentration, 100 U/mL penicillin, and 0.1 mg/mL streptomycin (Gibco, Invitrogen).
Cells were incubated in a humidified incubator at 37 °C
with 5% CO2.
Cell transfection
Lipofectamine 2000 transfection kits were used for transfection. We performed qRT-PCR to evaluate the transfection efficiency after transfecting for 48 h. The siRNA
sequences were synthesized by: for si-IL20RB#1, 5′-CUG
GAGAAACAGUGUACUATT-3′, forward, 5′-UAGUAC
ACUGUUUCUCCAGTT-3′, reverse; for si-IL20RB#2,
5′-CUAGAAGAAAUCUGGACAATT-3′,
forward,
5′-UUGUCCAGAUUUCUUCUAGTT-3′, reverse; for
Si-NC, 5′-UUCUCCGAACGUGUCACGU TT-3′, forward, 5′-ACGUGACACGUUCGGAGAATT-3′, reverse.
Page 3 of 14
RNA extraction and qRT‑PCR analysis
Total RNA was extracted from cells that were washed with
cold PBS solution twice using TRIzol RNA extraction reagent according to the manufacturer’s instruction. The cDNA
was reversely transcribed using a reverse transcription kit.
SYBR Green qPCR was used to evaluate the expression
levels of IL20RB. The expression of GAPDH was used as
the internal control. Primer sequences were as follows: the
IL20RB primers, forward: 5′-AGGCCCAGACATTCGTGA
AG-3′, reverse: 5′-CGACCACAAGGATCAGCATGA-3′;
and GAPDH primers, forward, 5′-GGAGCGAGATCC
CTCCAAAAT-3′, reverse: 5′-GGCTGTTGTCATACTTCT
CATGG-3′. The qRT-PCR system was QuantStudio 3, and
the data were analyzed using the 2-ΔΔCT method.
Western blot
Total protein lysates were isolated from cell lines by
treating with the RIPA lysis buffer supplemented with
phenylmethanesulfonyl fluoride and phosphatase inhibitor and centrifuged at 12000 rpm at 4 °C. After being
separated by 10% SDS-PAGE, the protein samples were
transferred onto the PVDF membrane by the wet transfer method. After incubation with 5% skimmed milk for
1 hour at room temperature, membranes were incubated
with diluted rabbit primary antibodies: IL20RB antibody (A7980, ABclonal), and GAPDH antibody (A19056,
1:1000). Then, the membranes were washed with PBS
and incubated with secondary antibody horseradish
peroxidase-conjugated goat anti-rabbit immunoglobulin
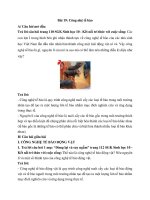
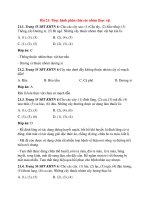
Fig. 1 Comprehensive profiling for somatic mutation data. A Upper part (from the left to the right) displayed the variant class, variant type, and
SNV class. Bottom part (from the left to the right) showed TMB in specific cases and top ten mutated genes in ccRCC. B Waterfall plot exhibited the
top ten mutant genes in ccRCC, and various colors represented different types of mutation
Zhang et al. BMC Genomic Data
(2022) 23:58
G (Transgene Biotech) for 1 hour. Enhanced chemiluminescence fluorescent detection kit (BB-3501, Amersham
Pharmacia) was used to visualize the immunocomplexes
and image analysis system (Bio-Rad Laboratories), and
Quantity One version 4.6.2 software (Bio-Rad Laboratories) was used to quantify the band intensities.
CCK‑8 assay
The cells were placed in 96-wells plates and treated for
24 h after transfection with siRNA. Then, the CCK-8 reagent was added into cells for another 2 h culture. And the
optical density (OD) value was examined with a microplate reader at 450 nm.
Clone formation assay
The cells at logarithmic phase were suspended and added
in a six-well plate at a density of 1 × 10³/well, which were
incubated at 37 °C for 10 days. When macroscopic clones
appeared in the plate, the culture was terminated. The
clones were washed with PBS twice and fixed with 4%
paraformaldehyde (Sangon Biotech, Shanghai, China) for
15 min and stained with Giemsa stain (Solarbio, Beijing,
China) for 10 min.
Page 4 of 14
for the highest proportion among all variants, and single-nucleotide polymorphisms (SNPs) occurred more
frequently than insertions (INSs) and deletions (DELs).
In addition, it was revealed that the most frequent SNV
(single-nucleotide variant) in ccRCC was C > T, and the
number of mutations in each case was displayed, with a
median value of 254 (Fig. 1A). In ccRCC samples, the 5
genes with the highest mutation rates were VHL (47%),
PBRM1 (40%), TTN (14%), SETD2 (12%) and BAP1 (10%)
(Fig. 1B).
Correlation analysis of TMB with clinicopathological
parameters
Transcriptome profiles of 72 healthy controls and 539
ccRCC patients were downloaded from the TCGA
Table 1 Clinical characteristics of 520 ccRCC cases downloaded
from TCGA database
Variable
Proportion
of patients
(%)
Age, years old
< =65
344 (66.2)
> 65
176 (33.8)
Gene Set Enrichment Analysis (GSEA)
Gender
GSEA was performed to analyze the IL20RB-related signaling pathways with GSEA 4.1.0 software. “c2.cp.kegg.
v7.4.symbols.gmt” was selected as the reference gene.
Male
339 (65.2)
Female
181 (34.8)
G1
12 (2.3)
Correlation between IL20RB expression levels
and tumor‑infiltrating immune cells (TIICs)
G2
222 (42.7)
G3
202 (38.9)
G4
76 (14.6)
Unknown
8 (1.5)
TIMER (http://timer.cistrome.org) and TISIDB (http://
cis.hku.hk/TISIDB/) were utilized to determine the correlation of IL20RB expression levels with TIICs. Additionally, the association between TIICs and prognosis
and the correlation between IL20RB and immune cell
markers were investigated by the ‘Outcome module’ and
‘Gene_Corr module’ of the TIMER database.
Statistical analysis
Grade
Stage
I
259 (49.8)
II
56 (10.8)
III
119 (22.9)
IV
83 (16.0)
Unknown
3 (0.5)
T Stage
The experimental data were analyzed with GraphPad
version 8 and R programming language. T-test and Wilcoxon rank-sum test were used to compare the difference
between 2 groups, and the difference between 2 or several groups was compared with the Kruskal-Wallis test.
P < 0.05 was considered to indicate a significant difference.
T1
265 (51.0)
T2
68 (13.1)
T3
176 (33.8)
T4
11 (2.1)
Results
Landscape of somatic mutations in ccRCC
A total of 339 somatic mutation data points from TCGA
were downloaded and analyzed by the R language
“maftools” package. The missense mutation accounted
N Stage
N0
230 (44.2)
N1
17 (3.3)
Unknown
273 (52.5)
M Stage
M0
413 (79.4)
M1
79 (15.2)
Unknown
28 (5.4)
Zhang et al. BMC Genomic Data
(2022) 23:58
database. Moreover, the corresponding clinical data of
ccRCC patients (n = 537) were obtained. After exclusion of cases whose follow-up time was < 30 days,
Table 1 summarized the clinical characteristics of 520
ccRCC patients. According to the median TMB value
(1.053 per MB), we divided a total of 336 samples into
low-TB (n = 175) and high-TMB (n = 161) groups.
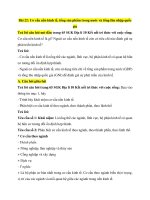
Kaplan–Meier analysis was performed (Fig. 2A), and
it was revealed that the 5-year survival rate in the
low-TMB group (0.762) was significantly higher than
Page 5 of 14
that in the high-TMB group (0.661, p = 0.026), implying that patients who had low TMB values possessed
a better prognosis. In addition, among the 7 clinical
characteristics, age (p < 0.001), tumor grade (p < 0.001)
and AJCC-stage (p =
0.026) were also correlated
with the TMB value (Fig. 2B, D, E). Nevertheless,
we did not find a significant difference between the
TMB value and other clinicopathological parameters
(Fig. 2C, F, G, H). Thus, TMB was deemed a prognostic factor for ccRCC.
Fig. 2 TMB value was associated with clinical characteristics. A The survival curves for high-TMB and low-TMB groups. B, D, E A high TMB value was
correlated with age, tumor grade, and AJCC-stage. C, F, G, H TMB value was not associated with gender and TNM-stage
Zhang et al. BMC Genomic Data
(2022) 23:58
Page 6 of 14
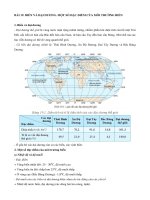
Fig. 3 Transcriptome analysis of two TMB-based groups. A Volcanic maps for DEGs. Red dots, upregulated genes. Green dots, downregulated
genes. Black dots, nondifferentially expressed genes. B GO functional analysis. C KEGG pathways enrichment analysis. D Forest plot illustrating
prognosis-related immune genes
DEGs, GO, and KEGG pathway enrichment analyses
We performed differential expression analysis to identify DEGs in the two groups. A total of 340 DEGs were
detected (|Log FC| > 1, p < 0.05), including 35 upregulated and 305 downregulated DEGs, and the Volcano plot
of DEGs was shown in Fig. 3A. According to the results
of GO functional analysis, sodium ion transport, chloride symporter activity, and apical plasma membrane
were enriched (Fig. 3B). Based on the KEGG pathway
enrichment analysis, Vibrio cholerae infection, synaptic
vesicle cycle, and primary immunodeficiency were the
top enriched pathways (Fig. 3C). To explore immunerelated DEGs, we downloaded immune-related genes
from the ImmPort database. The Venn diagram showed
13 genes that were common between the DEGs and
Table 2 Results of the univariate Cox regression analysis
Gene
HR.95 L
HR
HR.95H
P-value
LCN1
1.011
1.048
1.085
*
PAEP
1.054
1.082
1.112
***
LBP
1.054
1.092
1.131
***
PLCG2
0.591
0.725
0.891
**
INHBE
1.124
1.204
1.289
***
IL20RB
1.118
1.176
1.236
***
*
P < 0.05
**
P < 0.01
***
P < 0.001
Zhang et al. BMC Genomic Data
(2022) 23:58
immune-related genes (Fig. S1). Then, prognosis-related
immune genes were identified. Finally, 6 prognosisrelated immune genes, including LCN1, PAEP, LBP,
PLCG2, INHBE, and IL20RB, were identified (Fig. 3D,
Table 2).
The IL20RB level was strongly correlated
with the clinicopathological features of ccRCC
To further evaluate the prognostic potential of DEGs,
we utilized the GEPIA online database to analyze the
gene expression levels and to plot survival curves (Fig.
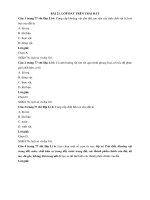
S2). Only IL20RB exhibited a satisfactory result. Differential expression analysis revealed that the IL20RB
expression level was notably higher in tumor samples than in normal samples (Fig. 4A, B). The survival
curves demonstrated that cases with overexpressed
IL20RB had shorter overall survival (OS) than those
with lower expression (p < 0.001, Fig. 4C). Furthermore, we investigated whether IL20RB expression was
related to the clinicopathological features of ccRCC
and found that IL20RB overexpression was associated with male sex (p = 0.011, Fig. 4E), tumor grade
(p < 0.001, Fig. 4F), AJCC-stage (p < 0.001, Fig. 4G), T
stage (p < 0.05, Fig. 4H), N stage (p < 0.05, Fig. 4I), and
M stage (p < 0.001, Fig. 4J). However, we found no significant association between IL20RB expression and
age (p = 0.72, Fig. 4D). Cox regression analysis was
additionally conducted to indicate whether the IL20RB
expression level was an independent prognostic factor
of cases with ccRCC. As shown in Fig. 4K and L, the
IL20RB expression level was significantly associated
with OS in ccRCC. Collectively, the IL20RB expression
level was an independent prognostic factor of ccRCC.
External validation of IL20RB in ccRCC
Then, we used the ‘Gene DE module’ of the TIMER database to analyze the differential expression of IL20RB in
pan-cancer. As shown in Fig. 5A, the expression levels
of IL20RB were significantly increased in multiple cancer types, including kidney renal clear cell carcinoma
(KIRC) (p < 0.001). The online database UALCAN further
validated that the expression and methylation levels of
IL20RB were different between kidney normal and tumor
tissues. The results showed that IL20RB was overexpressed in tumor tissues and promoter methylation levels
of IL20RB were downregulated in tumor tissues and the
degree of decline became more obvious with the increase
Page 7 of 14
of stage and grade (p < 0.001, Fig. 5B-E). Three gene
expression profile datasets, GSE40435, GSE46699, and
GSE53757, obtained from the GEO database were used
to verify the differential expression of IL20RB in ccRCC.
As shown in Fig. 5F-H, IL20RB expression was significantly higher in tumor tissues than in normal tissues.
Moreover, we also analyzed the gene expression data and
survival information of ccRCC patients downloaded from
the ICGC database. The box plot and Kaplan-Meier curve
again confirmed that IL20RB expression level was higher
in tumor tissues and patients with overexpressed IL20RB
had shorter overall survival (OS) (p = 0.013, Fig. 5I, J).
In vitro validation of IL20RB in ccRCC
To further validate the expression of IL20RB, different
ccRCC cell lines, including A498, 786-O, and RC-2,
and normal control HK2 cells were measured by qPCR
and western blot. The result suggested that the mRNA
and protein level of IL20RB were significantly higher
in ccRCC cell lines, especially in A498 than in HK2
cells (p < 0.001, Fig. 6A). The experimental results were
consistent with the conclusions of the bioinformatics
analysis, indicating that IL20RB was highly expressed in
ccRCC. Next, to explore the roles of IL20RB in ccRCC
cell proliferation, si-IL20RB was transfected into A498
and RC-2 cells to downregulate the expression of
IL20RB. Significant reduction of IL20RB expression
was observed in Fig. 6B and D after si-IL20RB transfection (p < 0.001). Then, we detected cell proliferation levels using A498 and RC-2 cells with knockdown
of IL20RB. Cell proliferation assays showed a remarkable decrease in proliferation levels after knockdown
for 48 h and 72 h (Fig. 6C, E). Moreover, the results of
the clone formation assay showed that the quantities of
A498 and RC-2 cells were significantly lower in the siIL20RB groups than that in the control groups (Fig. 6F).
The above results indicated that knockdown of IL20RB
significantly inhibited ccRCC cell proliferation.
GSEA of different IL20RB expression levels
To identify potential signaling pathways associated with
IL20RB expression levels in ccRCC samples, GSEA of
different IL20RB expression levels was undertaken.
The results of GSEA were presented in Fig. 7A-H.
High IL20RB expression levels were mainly enriched
in cytokine-cytokine receptor interaction (CCRI), p53
signaling pathway, intestinal immune network (IIN)
(See figure on next page.)
Fig. 4 The overexpressed IL20RB was associated with clinicopathological parameters. A Differential expression analysis of IL20RB in ccRCC and
normal samples. B Pairwise boxplot (C) Relationship of IL20RB expression levels with survival of ccRCC cases. D-J Correlation analysis between
IL20RB expression levels and clinicopathological parameters. K, L The Cox regression analysis of clinicopathological parameters and IL20RB
expression levels
Zhang et al. BMC Genomic Data
(2022) 23:58
Fig. 4 (See legend on previous page.)
Page 8 of 14
Zhang et al. BMC Genomic Data
(2022) 23:58
Page 9 of 14
Fig. 5 Differential expression and survival analysis validation of IL20RB in ccRCC (A) Expression level of IL20RB in Pan-cancer perspective analyzed
through TIMER database. B-E Expression and promoter methylation levels of IL20RB in ccRCC analyzed through UALCAN database. F-H Differential
expression of IL20RB in GEO (GSE40435, GSE46699, and GSE53757). I-J Expression and survival analysis of IL20RB in ICGC. *, P < 0.05; **, P < 0.01; ***,
P < 0.001; **** P < 0.0001
Zhang et al. BMC Genomic Data
(2022) 23:58
Page 10 of 14
Fig. 6 The overexpression of IL20RB in ccRCC cell lines and the proliferation of tumor cells after si-IL20RB. A QRT-PCR and western blot showed the
overexpression of IL20RB in A498, 786-O, and RC-2 cell lines. B, D Detection of interference efficiency by qRT-PCR after knockdown of IL20RB in A498
and RC-2 cell lines, respectively. C, E The results of CCK-8 exhibited that knockdown of IL20RB significantly attenuated proliferation of A498 and RC-2
cells. F The quantities of A498 and RC-2 colony cells decreased significantly after si-IL20RB. *, P < 0.05; **, P < 0.01; ***, P < 0.001; **** P < 0.0001
Fig. 7 GSEA of IL20RB expression levels. A cytokine receptor interaction. B p53 signaling pathway. C immune network for IgA production. D
homologous recombination. E hematopoietic cell lineage. F arachidonic acid metabolism. G glycosphingolipid biosynthesis of LACTO and
NEOLACTO series. H primary immunodeficiency
Zhang et al. BMC Genomic Data
(2022) 23:58
concerning IgA production, homologous recombination,
hematopoietic cell lineage, arachidonic acid metabolism,
primary immunodeficiency, glycosphingolipid biosynthesis of LACTO, and NEOLACTO series. We found
that these signaling pathways that were enriched in the
IL20RB overexpression groups were partly involved in
the immune system.
Association of IL20RB expression level with TIICs
To investigate whether IL20RB expression levels were correlated with TIICs, the TIMER database was utilized to
evaluate the association between IL20RB expression level
and the abundance of 12 TIICs. The results showed that
TIICs, including CD8+ T cells (r = 0.167, p = 3.07e− 04),
regulatory T cells (Tregs) (r = 0.321, p = 1.63e− 12), T follicular helper (Tfh) cells (r = 0.26, p = 1.41e− 08), macrophages (r = 0.343, p = 3.32e− 14), monocytes (r = − 0.202,
p = 1.25e− 05) and activated dendritic cells (r = − 0.158,
p = 6.76e−
04) were significantly correlated with the
IL20RB expression (Fig. 8A). To further confirm the
results, we also analyzed the correlation between IL20RB
expression and 12 TIICs in TISIDB database. As shown
in Fig. 8B, IL20RB expression was correlated with active
B cell (r = 0.283, p = 3.26e− 11), CD8+ T cells (r = 0.416,
p < 2.2e− 16), CD4+ T cells (r = 0.425, p < 2.2e-16), Tregs
(r = 0.235, p = 5.35e− 10), Tfh cells (r = 0.34, p = 8.94e− 16),
T cell gamma delta (r = 0.353, p = 3.35e− 17), natural killer
(NK) cells (r = 0.17, p = 8.42e− 05), macrophages (r = 0.321,
p = 4.28e− 14), monocytes (r = 0.129, p = 0.00279), mast
cells (r = 0.14, p = 0.00114) and activated dendritic cells
(r = 0.374, p < 2.2e− 16). Finally, we found that the IL20RB
expression had significantly positive correlation with the
infiltration levels of CD8+ T cells, Tregs, Tfh cells and
macrophages in both TIMER and TISIDB database. Then,
we investigated whether there were statistical relationships
between specific TIICs (CD8+ T cells, Tregs, Tfh cells
and macrophages) and overall survival of ccRCC patients
by TIMER database. Figure 8C showed that high infiltration level of Tfh cells was associated with poor outcome
in ccRCC (p = 0.005). Additionally, we also analyzed the
correlation between IL20RB and biomarkers of Tfh cells
(CXCR5, ICOS, CD40LG and Bcl-6) as well as immune
checkpoints (PDCD-1, CTLA-4, LAG3 and HAVCR2).
The results showed that, except for HAVCR2, IL20RB
expression had significantly positive correlations with
Page 11 of 14
these biomarkers (p < 0.001, Fig. 8D, E). Taken together,
the IL20RB expression level was significantly associated
with immune cell infiltration and immune biomarkers in
ccRCC, which may have significant clinical implications.
Discussion
Treatment of advanced ccRCC is mainly a challenge owing
to the lack of effective treatment, and the 5-year survival
rate of patients with advanced ccRCC is only 11.7% [1].
Immunotherapy, as a promising treatment, improves the
survival rate of advanced ccRCC [21]. Immune checkpoint
inhibitors, including pembrolizumab, nivolumab, and avelumab, have been used as first-line treatment modalities
for advanced ccRCC, significantly improving the outcomes
of patients with advanced ccRCC [9, 22, 23]. However,
immunotherapy is only effective for a subset of patients.
Thus, it is vital to identify further significant biomarkers
to predict therapeutic efficacy before undergoing immunotherapy [24]. The TMB value is a promising predictor of
the response of cancer patients after immunotherapy and
may be used to determine treatment failure to immune
checkpoint inhibitors in diverse types of cancer (e.g., melanoma, breast cancer, and small-cell lung cancer) [25–28].
However, whether it is associated with immunotherapy in
ccRCC remains elusive, which motivates us to investigate
the possible relationship of TMB value with the prognosis
of cases with ccRCC. The results demonstrated that a high
level of TMB was associated with higher tumor grades,
advanced pathological stages, and worse survival outcomes, which was consistent with previously reported findings [29].
In the present study, IL20RB was identified as an independent prognostic factor for ccRCC; in addition, the IL20
subfamily, including IL19, IL20, and IL24, is involved in
both amplified inflammatory responses and anti-inflammatory responses, such as tissue protection and regeneration [30–33]. IL19 can directly influence immune cells,
IL20 has a significant effect on skin inflammation, and
IL24 can promote apoptosis of different types of cancer
[34–36]. IL20RB, as a subunit of the IL20 subfamily receptor, is involved in the inflammatory response and malignancies. To date, the function of IL20RB in ccRCC has not
been explored. Hence, in our study, we verified that IL20RB
was overexpressed in both ccRCC tissues and cells, and
the ability of proliferation of ccRCC cells was inhibited
after knockdown of the expression of IL20RB. Moreover,
(See figure on next page.)
Fig. 8 Relationship of IL20RB levels with TIICs and immune checkpoints. A The correlation analysis between IL20RB expression and infiltration levels
of 12 TIICs via TIMER database. B Validation for the correlation between IL20RB expression and TIICs via TISIDB database. C Kaplan-Meier curves
exhibited infiltration levels of Tfh cells, but not CD8+ T cells, Tregs and macrophages, were correlated with poor outcome in ccRCC. D Scatter plots
of the associations between IL20RB and the markers of Tfh cells (CXCR5, ICOS, CD40LG and Bcl-6). E Scatter plots of the associations between IL20RB
and immune checkpoints (PDCD-1, CTLA4, LAG3, and HAVCR2)
Zhang et al. BMC Genomic Data
(2022) 23:58
Fig. 8 (See legend on previous page.)
Page 12 of 14
Zhang et al. BMC Genomic Data
(2022) 23:58
we conducted GSEA to identify possible pathways associated with IL20RB in ccRCC, and the results revealed that
IL20RB might be involved in CCRI and IIN concerning IgA
production and the p53 signaling pathway. The p53 gene is
one of the most frequently mutated genes in human cancer, and the p53 signaling pathway is involved in many biological functions, e.g., reproduction, metabolism, cell cycle
regulation, suppression of tumor expression, etc. [37–39].
It has been demonstrated that IIN concerning IgA production is involved in some types of cancer, such as hepatocellular carcinoma, which can be activated by CCR9, CCR10,
and CXCR4 to promote tumor growth and metastases [40].
A previous study demonstrated that CCRI was a significant
pathway of CXC chemokines in RCC, mediating the migration and localization of immune cells and influencing the
prognosis of RCC patients [41].
Growing evidence has highlighted that immune cell infiltration is closely related to the prognosis of RCC cases [42].
In the present study, we found that CD8+ T cells, Tregs,
Tfh cells, and Macrophages were overexpressed in patients
with a high expression level of IL20RB. CD8+ T cells, Tregs
and Macrophages have been proven to play an essential
role in cancer development and metastasis [43–45]. However, our knowledge of the clinical implications of Tfh cells
in cancer is still limited. Here, we found IL20RB expression level was correlated positively with the markers of Tfh
cells, and overexpressed Tfh cells were correlated with poor
prognosis of patients with ccRCC. Moreover, we also investigated the correlation between IL20RB and genes involved
in immunotherapy, including PDCD-1, CTLA4, LAG3 and
HAVCR2.The result showed that IL20RB expression was
associated significantly with these immune checkpoints,
suggesting that IL20RB was a potential therapeutic target
correlated with tumor immunology.
In summary, our study explored the intrinsic correlation
of the TMB value with clinicopathological parameters of
ccRCC patients and elucidated that IL20RB was correlated
with poor prognosis in ccRCC and could enhance the ability of proliferation of ccRCC cells. Moreover, the level of
IL20RB was significantly related to immune cell infiltration
and immune checkpoints in ccRCC, which may provide a
new perspective for immunotherapy.
Conclusions
In conclusion, the present study demonstrated that IL20RB
was overexpressed in both ccRCC tissues and cells. Overexpression of IL20RB could enhance the viability of ccRCC
cells and predict the poor prognosis of patients with
ccRCC. Furthermore, the correlations between IL20RB
and immune cell infiltration and immune checkpoints indicated a potential role for IL20RB in the immunotherapy of
ccRCC.
Page 13 of 14
Abbreviations
IL20RB: Interleukin 20 receptor subunit beta; TMB: Tumor mutation burden; ICI:
Immune cell infiltration; ccRCC: Clear cell renal cell carcinoma; GSEA: Gene set
enrichment analysis; TIICs: qTumor-infiltrating immune cells; Tfh: T follicular
helper; GO: Gene Ontology; OD: Optical density; TCGA: The Cancer Genome
Atlas database; GEO: Gene Expression Omnibus; ICGC: International Cancer
Genome Consortium; GEPIA: Gene Expression Profiling Interactive Analysis;
TIMER: Tumor Immune Estimation Resource; TISIDB: Immune System Interaction Database; UALCAN: The University of ALabama at Birmingham CANcer
data analysis Portal.
Supplementary Information
The online version contains supplementary material available at https://doi.
org/10.1186/s12863-022-01076-4.
Additional file 1.
Additional file 2.
Additional file 3.
Acknowledgments
We would like to thank TCGA and other databases for providing the data in
our study.
Authors’ contributions
WCY and ZHX designed the study and drafted the manuscript. ZHX and WBW
conducted the experiment and analyzed the data. LYW participated in discussion of related data. All authors read and approved the final manuscript.
Funding
This work was supported by the First Affiliated Hospital of Harbin Medical
University Fund for Distinguished Young Medical Scholars (HYD2020JQ0020).
Availability of data and materials
The datasets used and/or analysed during the current study are available from
the corresponding author on reasonable request.
Declarations
Ethics approval and consent to participate
Not applicable.
Consent for publication
Not applicable.
Competing interests
The authors declare that they have no competing interest.
Received: 24 March 2022 Accepted: 15 July 2022
References
1. Siegel RL, Miller KD, Jemal A. Cancer statistics, 2020. CA Cancer J Clin.
2020;70(1):7–30.
2. Hsieh JJ, et al. Renal cell carcinoma. Nat Rev Dis Primers. 2017;3:17009.
3. Rini BI, Campbell SC, Escudier B. Renal cell carcinoma. Lancet.
2009;373(9669):1119–32.
4. Ljungberg B, et al. EAU guidelines on renal cell carcinoma: 2014 update. Eur
Urol. 2015;67(5):913–24.
5. El Dib R, Touma NJ, Kapoor A. Cryoablation vs radiofrequency ablation for
the treatment of renal cell carcinoma: a meta-analysis of case series studies.
BJU Int. 2012;110(4):510–6.
6. Pierorazio PM, et al. Five-year analysis of a multi-institutional prospective
clinical trial of delayed intervention and surveillance for small renal masses:
the DISSRM registry. Eur Urol. 2015;68(3):408–15.
Zhang et al. BMC Genomic Data
7.
8.
9.
10.
11.
12.
13.
14.
15.
16.
17.
18.
19.
20.
21.
22.
23.
24.
25.
26.
27.
28.
29.
30.
31.
32.
33.
(2022) 23:58
Choueiri TK, Motzer RJ. Systemic therapy for metastatic renal-cell carcinoma.
N Engl J Med. 2017;376(4):354–66.
Barata PC, Rini BI. Treatment of renal cell carcinoma: current status and
future directions. CA Cancer J Clin. 2017;67(6):507–24.
Bedke J, et al. Updated European Association of Urology guidelines on renal
cell carcinoma: Nivolumab plus Cabozantinib joins immune checkpoint
inhibition combination therapies for treatment-naive metastatic clear-cell
renal cell carcinoma. Eur Urol. 2021;79(3):339–42.
Braun DA, Burke KP, Van Allen EM. Genomic approaches to understanding response and resistance to immunotherapy. Clin Cancer Res.
2016;22(23):5642–50.
Le DT, et al. PD-1 blockade in tumors with mismatch-repair deficiency. N
Engl J Med. 2015;372(26):2509–20.
Gibney GT, Weiner LM, Atkins MB. Predictive biomarkers for checkpoint
inhibitor-based immunotherapy. Lancet Oncol. 2016;17(12):e542–51.
Zito Marino F, et al. Are tumor-infiltrating lymphocytes protagonists
or background actors in patient selection for cancer immunotherapy?
Expert Opin Biol Ther. 2017;17(6):735–46.
Klempner SJ, et al. Tumor mutational burden as a predictive biomarker for
response to immune checkpoint inhibitors: a review of current evidence.
Oncologist. 2020;25(1):e147–59.
Chan TA, et al. Development of tumor mutation burden as an immunotherapy biomarker: utility for the oncology clinic. Ann Oncol.
2019;30(1):44–56.
Samstein RM, et al. Tumor mutational load predicts survival after immunotherapy across multiple cancer types. Nat Genet. 2019;51(2):202–6.
Wang X, Li M. Correlate tumor mutation burden with immune signatures
in human cancers. BMC Immunol. 2019;20(1):4.
Kanehisa M, Goto S. KEGG: Kyoto encyclopedia of genes and genomes.
Nucleic Acids Res. 2000;28(1):27–30.
Kanehisa M. Toward understanding the origin and evolution of cellular
organisms. Protein Sci. 2019;28(11):1947–51.
Kanehisa M, et al. KEGG: integrating viruses and cellular organisms.
Nucleic Acids Res. 2021;49(D1):D545–d551.
Makhov P, et al. Resistance to systemic therapies in clear cell renal cell
carcinoma: mechanisms and management strategies. Mol Cancer Ther.
2018;17(7):1355–64.
Taylor MH, et al. Phase IB/II trial of Lenvatinib plus Pembrolizumab in
patients with advanced renal cell carcinoma, endometrial Cancer, and
other selected advanced solid tumors. J Clin Oncol. 2020;38(11):1154–63.
Choueiri TK, et al. Updated efficacy results from the JAVELIN renal 101
trial: first-line avelumab plus axitinib versus sunitinib in patients with
advanced renal cell carcinoma. Ann Oncol. 2020;31(8):1030–9.
Deleuze A, et al. Immunotherapy in renal cell carcinoma: the future is
now. Int J Mol Sci. 2020;21(7):2532.
Liu L, et al. Combination of TMB and CNA stratifies prognostic and predictive responses to immunotherapy across metastatic Cancer. Clin Cancer
Res. 2019;25(24):7413–23.
Forschner A, et al. Tumor mutation burden and circulating tumor DNA in
combined CTLA-4 and PD-1 antibody therapy in metastatic melanoma - results of a prospective biomarker study. J Immunother Cancer.
2019;7(1):180.
Park SE, et al. Clinical implication of tumor mutational burden in patients
with HER2-positive refractory metastatic breast cancer. Oncoimmunology. 2018;7(8):e1466768.
Hellmann MD, et al. Tumor mutational burden and efficacy of Nivolumab
Monotherapy and in combination with Ipilimumab in small-cell lung
Cancer. Cancer Cell. 2019;35(2):329.
Zhang C, et al. Exploration of the relationships between tumor mutation
burden with immune infiltrates in clear cell renal cell carcinoma. Ann
Transl Med. 2019;7(22):648.
Logsdon NJ, et al. Structural basis for receptor sharing and activation by
interleukin-20 receptor-2 (IL-20R2) binding cytokines. Proc Natl Acad Sci
U S A. 2012;109(31):12704–9.
Rutz S, Wang X, Ouyang W. The IL-20 subfamily of cytokines--from host
defence to tissue homeostasis. Nat Rev Immunol. 2014;14(12):783–95.
Foster D, et al. Cytokine-receptor pairing: accelerating discovery of
cytokine function. Nat Rev Drug Discov. 2004;3(2):160–70.
Cui XF, Cui XG, Leng N. Overexpression of interleukin-20 receptor subunit
beta (IL20RB) correlates with cell proliferation, invasion and migration
Page 14 of 14
34.
35.
36.
37.
38.
39.
40.
41.
42.
43.
44.
45.
enhancement and poor prognosis in papillary renal cell carcinoma. J Toxicol Pathol. 2019;32(4):245–51.
Ouyang W, et al. Regulation and functions of the IL-10 family of cytokines
in inflammation and disease. Annu Rev Immunol. 2011;29:71–109.
Blumberg H, et al. Interleukin 20: discovery, receptor identification, and
role in epidermal function. Cell. 2001;104(1):9–19.
Lebedeva IV, et al. The cancer growth suppressing gene mda-7
induces apoptosis selectively in human melanoma cells. Oncogene.
2002;21(5):708–18.
Kruiswijk F, Labuschagne CF, Vousden KH. p53 in survival, death and
metabolic health: a lifeguard with a licence to kill. Nat Rev Mol Cell Biol.
2015;16(7):393–405.
Tanikawa C, et al. The transcriptional landscape of p53 Signalling pathway. EBioMedicine. 2017;20:109–19.
Green DR, Kroemer G. Cytoplasmic functions of the tumour suppressor
p53. Nature. 2009;458(7242):1127–30.
Yang Z, et al. Bufalin inhibits cell proliferation and migration of hepatocellular carcinoma cells via APOBEC3F induced intestinal immune network
for IgA production signaling pathway. Biochem Biophys Res Commun.
2018;503(3):2124–31.
Zeng Q, et al. Identification of therapeutic targets and prognostic biomarkers among CXC Chemokines in the renal cell carcinoma microenvironment. Front Oncol. 2019;9:1555.
Braun DA, et al. Interplay of somatic alterations and immune infiltration
modulates response to PD-1 blockade in advanced clear cell renal cell
carcinoma. Nat Med. 2020;26(6):909–18.
Haebe S, et al. Single-cell analysis can define distinct evolution of tumor
sites in follicular lymphoma. Blood. 2021;137(21):2869–80.
van der Leun AM, Thommen DS, Schumacher TN. CD8(+) T cell states
in human cancer: insights from single-cell analysis. Nat Rev Cancer.
2020;20(4):218–32.
Xia Y, et al. Engineering macrophages for Cancer immunotherapy and
drug delivery. Adv Mater. 2020;32(40):e2002054.
Publisher’s Note
Springer Nature remains neutral with regard to jurisdictional claims in published maps and institutional affiliations.
Ready to submit your research ? Choose BMC and benefit from:
• fast, convenient online submission
• thorough peer review by experienced researchers in your field
• rapid publication on acceptance
• support for research data, including large and complex data types
• gold Open Access which fosters wider collaboration and increased citations
• maximum visibility for your research: over 100M website views per year
At BMC, research is always in progress.
Learn more biomedcentral.com/submissions