financial statement analysis
Bạn đang xem bản rút gọn của tài liệu. Xem và tải ngay bản đầy đủ của tài liệu tại đây (399.75 KB, 11 trang )
FINANCIAL
STATEMENT
ANALYSIS
Section B
Ruchika Sharma (112)
S. Priya
Industry: Automobile
Companies taken: Tata Motors & Maruti Suzuki
Financial Analysis
Liquidity Ratios
Tata(in Cr Rs)
Maruti(in Cr Rs.)
Mar'12
Mar'11
Mar'12
Mar'11
Current Asset
13712.92
10971.66
11079
9620.2
Current Liability
22177.47
19000.27
6547.6
4018.7
Quick Current Asset
4275.05
4586.19
2436.1
2508.5
Current Ratio
0.618327
0.577448
1.69207
2.393859
Net Working Capital
-8464.55
-8028.61
4531.4
5601.5
Quick Ratio
0.192765
0.241375
0.37206
0.624207
Long Term Outside Liabilities
8004.5
9679.42
96.6
234.9
Tangible Net Worth
19626.01
20013.3
14977.5
13820
Total Tangible Asset
13656.71
12631.82
7922.2
6346.2
Debt Equity Ratio
0.407852
0.483649
0.00645
0.016997
Proprietary Ratio
143.7096
158.4356
1.890573
2.177681
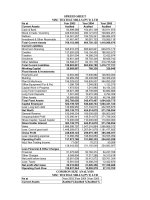
For Tata, the current ratio is less than 1 indicating that the firm may
have difficulty in meeting its current obligations.
For Maruti, figures for current ratio has gone down compared to
previous year but they are relatively better than that of Tata which
indicates good short term financial strength and good working capital
management though the ratio has decreased still it’s in the healthy
range.
Quick ratio for both the companies has decreased (from .2 in Mar’11 to
.1 in Mar’12 for Tata and from .6 in Mar’11 to .3 in Mar’12 for Maruti)
which is not a good sign for investors. There’s a huge difference between
current ratio & quick ratio
Tata is leveraging better when compared to Maruti as its Debt equity
ratio is .4 for Mar’ 12.
Profitability Ratios
Tata(in Cr Rs)
Maruti(in Cr Rs.)
Mar'12
Mar'11
Mar'12
Mar'11
Fixed Asset
13656.71
12631.82
8132.1
6391.9
Total Asset
54519.28
54190.45
22302.2
18425.1
Gross Profit
13977.79
12666.84
8026.6
8763.3
Net Sales
54306.56
47088.44
34705.9
35849
Operating Profit
3144.89
3727.34
2091
3083.8
Net Profit
1242.23
1811.82
6466.4
7429.1
Gross Profit Ratio
25.73868
26.90011
23.12748
24.44503
Operating Profit Ratio
5.790995
7.915616
6.024912
8.602193
Net Profit Ratio
2.28744
3.847696
18.63199
20.72331
Average Inventory
4588.23
3891.39
1605.75
1311.9
Sales
40328.77
34421.6
28239.5
28419.9
Stock/Inventory Turnover Ratio(in
Days)
41.52628
41.26355
20.75457
16.84888
For both Tata and Maruti, the profits have decreased when compared to
previous year however, overall profitability of Maruti(18.6) is 9 times
better than Tata’s(2.3).
Gross Profit went down to 25.7 from 26.9 for Tata
Gross Profit Ratio indicates the manufacturing efficiency as well as the
pricing policy of the concern.
A higher Gross Profit Ratio indicates efficiency in production of the unit.
Higher operating profit ratio indicates high operational efficiency.
Tata is also slow in inventory turnover when compared to Maruti.
Inventory Turnover for MAruti has increased from previous year to 20.7
while Tata’s Inventory Turnover Ratio has not changed much if
compared to the figures of previous year (41.26 in Mar ’11 to 41.5 in
Mar’ 12)
Leverage Ratios
Tata(in Cr Rupees)
Maruti(in million
Rs.)
Mar'12
Mar'11
Mar'12
Mar'11
Average Debtors
2708.32
2602.88
9376
8245
Average Creditors
8744.83
8817.27
33499
26083
Purchases
40328.77
34421.6
281083
283639
Debtors Turnover Ratio(in
Days)
24.51195
27.60044
12.11863
10.58915
Asset Turnover Ratio
3.976548
3.727764
4.380841
5.648892
Fixed Asset Turnover Ratio
3.976548
3.727764
4.267766
5.608505
Current Asset Turnover
Ratio
3.960248
4.291825
3.132584
3.72643
Creditors Turnover Ratio(in
Days)
79.14605
93.49663
43.50009
33.56483
Net Profit After Taxes
1242.23
1811.82
16352
22886
Net profit Before interest &
tax
2559.65
3580.22
22014
31338
Average Capital Employed
32341.81
35190.18
157546
144064
Return On Assets
0.022785
0.033434
0.07332
0.124211
Return On Capital Employed
7.914368
10.17392
13.97306
21.75283
The debtors for Maruti are more liquid (12.11) when compared to Tata
indicating that debt collection is fast for Maruti.
Maruti is more credit worthy although the value has increased from
precious year(33.5 in Mar’ 11 to 43.5 in Mar’12).
Asset turnover for Maruti has reduced from the previous year however
for Tata the value has increased to 3.9 from 3.7.
Current Asset Turnover Ratio for bot the companies has reduced when
compared to previous year figures.
Credit Turnover depicts that Maruti has increased the value from 33 in
last year to 43 this year while Tata has reduced its credit turnover ratio.
Return on Asset figures for both companies is low and has reduced from
the previous years’ value and if we compare the figures, Maruti shows a
better picture.
ROCE has also reduced from previous year for both companies but
Maruti has 13.9 for Mar’ 12 while Tata has 7.9 for Mar ’12.
Activity Ratios
Tata(in Cr Rs)
Maruti(in Cr Rs.)
Mar'12
Mar'11
Mar'12
Mar'11
Number of Equity Shares
317.35
317.35
28.891
28.891
Market Price Per Equity Share(in Rs.)
275.7
249.5
134.91
126.355
Earning Per Share
3.914385
5.709217
56.59894
79.21498
Price Earning Ratio
70.43252
43.70126
2.383614
1.59509
PAT+Depr.+Annual Interest on Long
Term Loans & Liabilities
3695.858
4024.55
2775.1
3304.9
Annual Interest on Long Term Loans
& Liabilities + Annual Instalments
Payable on Long term Loans &
Liabilities
1564.195
956.98
47.83333
95.46667
Debt Service Coverage Ratio
2.362786
4.205469
58.01603
34.61837
EPS indicates the quantum of net profit of the year that would be
ranking for dividend for each share of the company being held by the
equity share holders.
For Maruti, its 56 for the year Mar ’12 decreased from 79.2 last year
while for Tata its 3.9 in Mar ’12 as compared to 5.7 in Mar’ 11.
Price Earning Ratio for Tata is 70.4 for Mar ’12 while for Maruti its 2.3 for
Mar ’12.
Debt service coverage ratio is one of the most important one which
indicates the ability of an enterprise to meet its liabilities by way of
payment of installments of Term Loans and Interest thereon from out of
the cash accruals and forms the basis for fixation of the repayment
schedule in respect of the Term Loans raised for a project.
DSCR for Tata decreased from 4.2 to 2.3 while for MAruti it was 34.6 in
Mar ’11 and increased to 58 in Mar ‘ 12.
Suggestion to Stakeholders:
1. Creditors
They need to concentrate on Liquidity Ratios and Credit Turnover ratio.
If we look at the Maruti’s Mar’12 figures it shows that Maruti can pay its
obligation as compared to Tata Mar’12 value of .6.
Also Quick ratio figure are better for Maruti when compared to Tata.
2. Banking and Financial Institute
They need to look at the following ratios:
Profitability Ratios including Gross Profit, Operating Profit and Net Profit
Ratio.
Operating Profit figures for Maruti and Tata are comparable but Net
Profit Ratio for Maruti exceeds Tata by considerable margin.
Also, Debtor Turnover Ratio and Creditor Turnover Ratio needs to be
considered. Maruti takes 43 days while Tata takes 79 days. For both the
companies, figures have improved from the last year but debtors and
creditors days should not be stretched as per the industry standard or
peer review.
Debt Service Coverage Ratio: shows whether the company will have
enough cash accrual to pay of its term loan instalments and interest
payment.
Liquidity Ratio: Mainly Current Ratio. As per bank standard, ideal CR is
1.33. Tata is less than 1 so the company is using its short term funds for
long term purposes which is not a good sign & company should maintain
a CR of atleast 1.33 hence, company should bring in more money to pay
off its current liability.
3. Investor
They will consider:
Earning per share
Price Earning Ratio
If P/E is high, share is overpriced and if P/E is low share is underpriced.
Values needs to be compared with the industry standards, Maruti’s Mar
’12 figures at 2.3 are favourable.
4. Government
They will consider:
Liquidity Ratio
Leverage Ratio
Government has to look whether the company is able to pay its
obligations and need to keep a check on bankcrupty condition.
5. Management
Ratios need to be looked upon by management are:
Current Ratio
Debt Equity
Profitability Ratio
Return on Capital Employed
Return On Assets
Management will check all the ratios as different ratios concern different
departments and they have to satisfy various stakeholders too.
Company must add value to the shareholder to maximise the return on
investment.
Maruti’s Mar’12 figures it shows that Maruti can pay its obligation as
compared to Tata Mar’12.
Also , Maruti’s profitability ratios shows a good picture for the company
depicting that management is playing a vital role and managing activites
inline with the requirements.
Key Highlights of Various Components of Annual Report
Auditor’s Report
For Tata Motors
According to the auditor’s opinion, proper books of account as required
by law have been kept by the Company, the Balance Sheet, the Profit
and Loss Statement and the Cash Flow Statement dealt with by this
report are in agreement with the books of account and the Balance
Sheet, the Profit and Loss Statement and the Cash Flow Statement
dealt with by this report are in compliance with the Accounting
Standards referred to in Section 211(3C) of the Companies Act, 1956;
For Maruti Suzuki
The fixed assets are physically verified by the Management according to
a phased programme designed to cover all the items, except furniture
and fixtures, office appliances and certain other assets having an
aggregate net book value of Rs. 1,645 million, over a period of three
years which, in our opinion, is reasonable having regard to the size of
the Company and the nature of its assets.
In our opinion and according to the information and explanations given
to us, a substantial part of fixed assets has not been disposed off by the
Company during the year.
The Company has not accepted any deposits from the public within the
meaning of Sections 58A and 58AA of the Act and the rules framed
there under.
The Company has not granted any loans and advances on the basis of
security by way of pledge of shares, debentures and other securities.
Management Discussions
For Tata Motors
Considering the Company’s financial performance, the Directors
recommended a dividend of 4/- per share (200%) on the capital of
2,70,77,31,241 Ordinary Shares of `2/- each (previous year: `20/- per
share (200%) on share of face value of `10/- each) and `4.10 per share
(205%) on 48,19,59,190 ‘A’ Ordinary Shares of `2/- each (previous year:
`20.50 per share (205%) on share of face value of `10/- each) fully paid-
up for FY 2011-12 and will be paid on or after August 14, 2012.
Tata Motors recorded a gross turnover of `59,221 crores, a growth of
15.7%, from `51,184 crores in the previous year. Cost reduction and
value engineering continue to be areas of focus to improve operational
efficiency.
For Maruti Suzuki
The total revenue (net of excise) was Rs. 364,139 million as against Rs.
371,272 million in the previous year showing a marginal decline of 1.92
per cent.
The Company has again been awarded ISO :27001 certification by STQC
Directorate (Standardisation, Testing and Quality Certificate), Ministry of
Communications and Information Technology, Government of India
after re-assessment. The Company is thus certified to meet international
standards for maintaining information security.
The Company's subsidiaries which were engaged in the business of
insurance distribution in the past generated an investment income of Rs.
163.80 million including a dividend income of Rs. 28.65 million and long
term capital gain of Rs. 129.13 million through mutual funds.
Corporate Governance Report
For Tata Motor
As part of the Tata group, the Company’s philosophy on Corporate
Governance is founded upon a rich legacy of fair, ethical and transparent
governance practices, many of which were in place even before they
were mandated by adopting highest standards of professionalism,
honesty, integrity and ethical behaviour. As a global organisation the
Corporate Governance practices followed by the Company and its
subsidiaries are compatible with international standards and best
practices. Through the Governance mechanism in the Company, the
Board along with its Committees undertake its fiduciary responsibilities
to all its stakeholders by ensuring transparency, fair play and
independence in its decision making.
As a good corporate governance practice, the Company has voluntarily
undertaken an Audit by M/s Parikh & Associates, Practicing
Company Secretaries, of the secretarial records and documents for the
period under review in respect of compliance with the Companies
Act, 1956, listing agreement with the Indian stock exchanges and the
applicable regulations and guidelines issued by Securities and
Exchange Board of India.
For Maruti Suzuki
The auditors, M/s Price Waterhouse, Firm Registration Number
FRN301112E, Chartered Accountants, hold office until the conclusion of
the ensuing annual general meeting and are recommended for re-
appointment.
The due date of filing the cost audit report for the financial year 2010-11
was 30th September 2011. This report was filed on 13th September
2011 with the Ministry of Corporate Affairs.
Improvement area for Tata
Should improve upon its liquidity position as its current ratio and
quick ratio are much below the industry standards.
Should try to reduce its operating expenses by taking the benefit
from economies of scale and reduce the interest cost so as to
improve upon the profitability ratios.
Once profitability will improve, ROE, ROA, EPS and P/E will
improve automatically.
Improvement area for Maruti
Since the Current ratio is 1.7, hence there is a room for managing
current asset in a better way without reducing the ratio below
1.33, which is considered good.
Since quick ratio is very low as compared to current ratio it shows
that there is a lot of dependence on inventory and other assets
which cannot be liquidated on an immediate manner and there is
a scope of better current asset management.
Company can plan some big expansion for which banks would
more than willing to support since the company is having a very
minimal debt on its books and has a very healthy cash accrual YOY
basis.
As per the facts and figures, Maruti should be rated higher than Tata.
Different stakeholders will have different reasons to justify that like for
banks Maruti is low leveraged or rather not leveraged, has a good
liquidity position, has a better profitability, for investors Maruti has a
better earnings per share and an under priced share as per the
fundamental analysis likewise in almost all the parameter Maruti is in a
better position than Tata.