FAUJI CEMENT COMPANY LIMITED
Bạn đang xem bản rút gọn của tài liệu. Xem và tải ngay bản đầy đủ của tài liệu tại đây (80.78 KB, 11 trang )
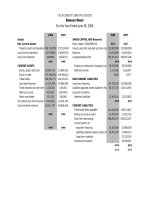
FAUJI CEMENT COMPANY LIMITED
Balance Sheet
For the Year Ended June 30, 2008
2008 2007 2008 2007
Assets SHARE CAPITAL AND Reserves
Non Current Assets Share capital (15000000*10) ### ###
Property, plant and Equipment
568,324,858 571,553,404
Issued, subscribd and paid up share capital
121,000,000 110,000,000
Long Term Investments 23273968% 23290157% Reserves 24,915,809 24,919,634
Long Term Deposits 9438485 10292127 Unappropriated profit 109,367,912 108,907,196
### ### ### ###
CURRENT ASSETS
Surplus on revaluation of property, plant and equipment
78,229,066 78,229,066
Stores, spares and tools 28,384,716 25,694,635 Deferred income 1,137,508 1,516,677
Stock in trade 573,366,195 419,399,422 9,468 8,277
Trade Debts 189,960,771 144,276,311 NON CURRENT LIABILITIES
Load and Advances 31,204,349 59,580,809 Long term financing 167,729,250 152,958,000
Trade deposits and short term prepayments
1,418,301 548,063
Liabilities againest assets subject to finance lease
88,337,740 118,541,635
Markup accrued 924,296 3,974,493 Long term mudarba - -
Other receviables 374,228 558,084 Deferred Liabilities 22,304,254 13,215,655
Tax refunds due from Government
8,543,681 16,419,744 ### ###
Cash and bank balances 85,525,197 69,656,656 CURRENT LIABILITIES
Trade and other payable
131,658,959 138,071,667
### ### Markup accrued on loans 23,793,447 17,281,762
Short term borrowings 698,460,457 493,202,267
Current portion of:
### ### long-term financing 24,100,900 23,068,000
Liabilities againest assets subject to finance lease
30,703,745 31,060,110
Long term mudarba - 23,333,334
Provision for taxation - 10,938,922
### ###
### ###
PARAMOUNT SPINNING MILLS LIMITED
Profit & Loss Statement
For the Year Ended June 30, 2008
Actual Statement Vertical Analysis
Horizontal Analysis
2008 2007 2008 2007 2008 2007
Sales - net 2,549,115,134 1,986,269,379 Sales - net 100% 100% Sales - net 100% 100%
Less: Cost of Sales (2,195,239,600) (1,682,130,933) Less: Cost of Sales -86.12% -84.69% Less: Cost of Sales 100% 98%
Gross Profit 353,875,534 304,138,446 Gross Profit 13.88% 15.31% Gross Profit 100% 198%
Other operating income 38,023,725 5,637,260
Other operating income
1.49% 0.28% Other operating income 100% 19%
391,899,259 309,775,706 15.37% 15.60% 100% 217%
Less: Less: Less:
Distribution cost (74,802,068) (63,455,924) Distribution cost -2.93% -3.19% Distribution cost 100% 109%
Administration expenses (56,298,111) (49,339,022)
Administration expenses
-2.21% -2.48% Administration expenses 100% 112%
Other operating expenses
(5,010,556) (7,585,705)
Other operating expenses
-0.20% -0.38% Other operating expenses 100% 194%
Finance cost (181,907,952) (158,794,462) Finance cost -7.14% -7.99% Finance cost 100% 112%
(318,018,687) (279,175,113) -12.48% -14.06% 100% 113%
Share of Loss from associates
(558,003) (14,534,416)
Share of Loss from associates
-0.02% -0.73%
Share of Loss from associates
100% 33.43%
NET PROFIT BEFORE TAX
73,322,569 16,066,177
NET PROFIT BEFORE TAX
2.88% 0.81%
NET PROFIT BEFORE TAX
100% 28%
Less: Taxation (47,550,225) (14,660,431) Less: Taxation -1.87% -0.74% Less: Taxation 100% 40%
NET PROFIT AFTER TAX
25,772,344 1,405,746
NET PROFIT AFTER TAX
1.01% 0.07% NET PROFIT AFTER TAX 100% 7%
Earning Per Share 1.93 0.11
PARAMOUNT SPINNING MILLS LIMITED
Profit & Loss Statement
For the Year Ended June 30, 2008
Horizontal Analysis
2008
1,198,784,642
###
180,063,549
(21,696,402)
(20,711,349)
(7,535,491)
(114,229,397)
###
987,636
(13,087,126)
(#REF! )
MUSLIM COMMERCIAL BANK (MCB)
Profit & Loss Statement
For the Year Ended June 30, 2008
(Rs. In '000')
2008 2007
Mark-up / return / interest earned 40,043,824 31,786,595
Mark-up / return / interest expensed 11,560,740 7,865,533
NET MARK-UP / INTEREST INCOME 28,483,084 23,921,062
Provision for diminution in the value of investments - net 2,683,994 105,269
Provision againest loan and advances - net 1,335,127 2,959,583
Bed debts written off directly - 199
4,019,121 3,065,051
Net mark-up / interset after provisions 24,463,963 20,856,011
non-markup / interset income
Fee, commission and brokerage income 2,866,729 2,634,610
Dividend income 617,554 632,300
Income from dealing in forign currencies 727,564 693,408
Gain on sales of securities - net 740,429 1,500,865
Unrealised loss on revalution of investments (103,198) (13,105)
classified as held for trading
Other income - net 942,362 1,000,149
Total non-mark-up / interest income 5,791,440 6,448,227
30,255,403 27,304,238
non-markup / interest expenses
Administrative expenses 7,546,878 5,426,116
Other provision / (reversal) - net 10,120 (3,743)
Other charges 830839 573830
Total non-mark-up / interest expenses 8,387,837 5,996,203
Extra ordinary / unusual item - -
Profit before taxation 21,867,566 21,308,035
Taxation - Current year
7341257 6442356
Prior year
((864824) ((1294473)
Deferred
16533 894590
6492966 6042473
Profit after taxation 15,374,600 15,265,562
Unappropriated profit brought forward
5130750 5530973
Transfer from surplus on revaluation of fixed assets - net of tax
21319 11855
5152069 5542828
Profit available for appropriation
20,526,669 20,808,390
Basic and dilited earning per sgare - after tax
24.47 24.3
MUSLIM COMMERCIAL BANK (MCB)
Profit & Loss Statement
For the Year Ended June 30, 2008
Vertical Analysis
(Rs. In '000')
2008 2007
Mark-up / return / interest earned 100% 100%
Mark-up / return / interest expensed 28.87% 24.74%
NET MARK-UP / INTEREST INCOME 71.13% 75.26%
Provision for diminution in the value of investments - net 6.70% 0.33%
Provision againest loan and advances - net 3.33% 9.31%
Bed debts written off directly 0.00% 0.00%
10.04% 9.64%
Net mark-up / interset after provisions 61.09% 65.61%
non-markup / interset income
Fee, commission and brokerage income 7.16% 8.29%
Dividend income 1.54% 1.99%
Income from dealing in forign currencies 1.82% 2.18%
Gain on sales of securities - net 1.85% 4.72%
Unrealised loss on revalution of investments -0.26% -0.04%
classified as held for trading
Other income - net 2.35% 3.15%
Total non-mark-up / interest income 14.46% 20.29%
75.56% 85.90%
non-markup / interest expenses
Administrative expenses 18.85% 17.07%
Other provision / (reversal) - net 0.03% -0.01%
Other charges 2.07% 1.81%
Total non-mark-up / interest expenses 20.95% 18.86%
Extra ordinary / unusual item 0.00% 0.00%
Profit before taxation 54.61% 67.03%
Taxation - Current year
18.33% 20.27%
Prior year
-2.16% -4.07%
Deferred
0.04% 2.81%
16.21% 19.01%
Profit after taxation 38.39% 48.03%
Unappropriated profit brought forward
12.81% 17.40%
Transfer from surplus on revaluation of fixed assets - net of tax
0.05% 0.04%
12.87% 17.44%
Profit available for appropriation
51.26% 65.46%
MUSLIM COMMERCIAL BANK (MCB)
Profit & Loss Statement
For the Year Ended June 30, 2008
Horizontal Analysis
(Rs. In '000')
(Rs. In '000')
2008 2007
Mark-up / return / interest earned 126% 100%
Mark-up / return / interest expensed 146.98% 100%
NET MARK-UP / INTEREST INCOME 119.07% 100%
Provision for diminution in the value of investments - net 2549.65% 100%
Provision againest loan and advances - net 45.11% 100%
Bed debts written off directly 0.00% 100%
131.13% 100%
Net mark-up / interset after provisions 117.30% 100%
non-markup / interset income
Fee, commission and brokerage income 108.81% 100%
Dividend income 97.67% 100%
Income from dealing in forign currencies 104.93% 100%
Gain on sales of securities - net 49.33% 100%
Unrealised loss on revalution of investments 787.47% 100%
classified as held for trading
Other income - net 94.22% 100%
Total non-mark-up / interest income 89.81% 100%
110.81% 100%
non-markup / interest expenses
Administrative expenses 139.08% 100%
Other provision / (reversal) - net -270.37% 100%
Other charges 144.79% 100%
Total non-mark-up / interest expenses 139.89% 100%
Extra ordinary / unusual item 100%
Profit before taxation 102.63% 100%
Taxation - Current year
113.95% 100%
Prior year
66.81% 100%
Deferred
1.85% 100%
107.46% 100%
Profit after taxation 100.71% 100%
Unappropriated profit brought forward
92.76% 100%
Transfer from surplus on revaluation of fixed assets - net of tax
179.83% 100%
92.95% 100%
Profit available for appropriation
98.65% 100%
ATLAS BATTERY LIMITED
Profit & Loss Statement
For the Year Ended June 30, 2008
Actual Statement Vertical Analysis
Horizontal Analysis
Rupee in '000'
2008 2007 2008 2007 2008 2007
Sales - net 2,628,820 1,585,648 Sales - net 100% 100% Sales - net 100% 60%
Less: Cost of Sales (2,241,937) (1,294,026) Less: Cost of Sales -85.28% -81.61% Less: Cost of Sales 100% 57.72%
Gross Profit 386,883 291,622 Gross Profit 14.72% 18.39% Gross Profit 100% 75.38%
Other operating income 1,929 1,296
Other operating income
0.07% 0.08% Other operating income 100% 67.19%
388,812 292,918 14.79% 18.47% 100% 75.34%
Less: Less:
Distribution cost (114,957) (96,481) Distribution cost -4.37% -6.08% Distribution cost 100% 83.93%
Administration expenses (55,957) (42,661)
Administration expenses
-2.13% -2.69% Administration expenses 100% 76.24%
Other operating expenses
(12,231) (9,477)
Other operating expenses
-0.47% -0.60% Other operating expenses 100% 77.48%
Finance cost (41,536) (22,042) Finance cost -1.58% -1.39% Finance cost 100% 53.07%
(224,681) (170,661) -8.55% -10.76% 100% 75.96%
NET PROFIT BEFORE TAX
164,131 122,257
NET PROFIT BEFORE TAX
6.24% 7.71%
NET PROFIT BEFORE TAX
100% 74.49%
Less: Taxation (57,334) (34,747) Less: Taxation -2.18% -2.19% Less: Taxation 100% 60.60%
NET PROFIT AFTER TAX
106,797 87,510
NET PROFIT AFTER TAX
4.06% 5.52% NET PROFIT AFTER TAX 100% 81.94%
15.27 12.51
Earning Per Share - basic
and diluted
ATLAS BATTERY LIMITED
Profit & Loss Statement
For the Year Ended June 30, 2008
Horizontal Analysis
2008 2007
2,628,820 1,585,648
(2,241,937) (1,294,026)
386,883 291,622
1,929 1,296
388,812 292,918
(114,957) (96,481)
(55,957) (42,661)
(12,231) (9,477)
(41,536) (22,042)
(224,681) (170,661)
164,131 122,257
(57,334) (34,747)
106,797 87,510
15.27 12.51