financial statement analysis MSC textile
Bạn đang xem bản rút gọn của tài liệu. Xem và tải ngay bản đầy đủ của tài liệu tại đây (129.68 KB, 13 trang )
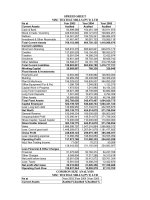
SPREED SHEET
MSC TEXTILE MILLS (PVT) LTD
As at Year 2003 Year 2004 Year 2005
Current Assets Audited Audited Audited
Cash & Bank 83,599,569 154,461,108 154,911,973
Stock in trade / Inventory 426,533,640 490,121,810 729,804,251
Debtors 134,381,257 194,725,241 356,984,972
Investment & Other Receivable 91,461,447 90,081,103 118,959,116
Total Current Assets 768,153,468 964,705,125 1,419,098,670
Current Liabilities
Short term financing 545,915,376 685,922,921 848,873,173
Creditor 137,920,528 155,104,403 188,050,572
Taxation 15,591,004 14,386,216 12,422,874
Dividends 35,851,449 59,755,429 59,926,740
Other liabilities 52,508,217 62,181,176 316,735,546
Total Current Liabilities 748,083,801 963,936,789 1,418,777,721
Working Capital 20,069,667 768,336 320,949
Fixed Assets & Investments
Freehold Land 12,903,280 17,936,880 126,900,000
Building 92,969,459 95,408,696 102,308,234
Plant & Machinery 156,029,632 165,805,937 364,890,295
Office Equipment (Fur & Fix) 1,386,759 1,248,083 1,123,275
Capital Work in Progress 1,972,924 1,215,980 64,154,333
Long Term Investment 45,921,466 48,739,846 60,882,666
Long Term Deposits 7,001,520 10,672,359 8,792,359
Other Assets 30,569,685 37,736,393 46,744,099
Total Fixed Assets 502,760,058 545,478,407 1,004,020,775
Capital Employed 522,739,725 546,246,743 1,004,341,724
Less: Long term debt 139,599,950 121,732,073 432,555,670
Net Worth 383,139,775 424,514,670 571,768,054
General Reserve 150,049,334 165,000,000 190,000,000
Unappropriated Profit 123,090,441 149,514,670 271,786,054
Share Capital / Issued Capital 110,000,000 110,000,000 110,000,000
Share Holder Interest 383,139,775 424,514,670 571,768,054
Sales 1,696,098,797 1,547,316,864 1,566,866,012
Less: Cost of good sold 1,448,059,673 1,287,641,679 1,181,477,655
Gross Profit 248,039,124 259,675,185 385,388,357
Less: Operating expense 110,066,356 108,594,850 130,555,059
Operating Profit 137,972,768 151,080,335 254,833,298
Add: Non Trading Income 71,087 70,213 50,269
138,043,855 151,150,548 254,883,567
Less Financial & Other Charges
Financial 51,075,826 50,782,374 64,237,768
Other Charges 9,368,804 17,317,286 16,310,618
Net profit before taxes 35,901,608 35,412,572 129,761,354
Less: Taxes 15,591,004 14,386,216 12,422,874
Net profit after taxes 20,310,604 21,026,356 117,338,480
Operating Cash Flow 199,837,544 10,005,579 27,313,703
COMMON SIZE ANALYSIS
MSC TEXTILE MILLS (PVT) LTD
As at Year 2003 Year 2004 Year 2005
Current Assets Audited % Audited % Audited %
Cash & Bank 6.48 10.23 6.39
Stock in trade / Inventory 33.09 32.47 30.11
Debtors 10.42 12.9 14.73
Investment & Other Receivable 7.09 5.96 4.9
Total Current Assets 59.6 63.91 58.56
Current Liabilities
Short term financing 42.35 45.44 35.03
Creditor 10.7 10.27 7.76
Taxation 1.2 0.95 0.51
Dividends 2.78 3.95 2.74
Other liabilities 4.07 4.11 13.07
Total Current Liabilities 58.04 63.86 58.55
Working Capital 1.55 0.05 0.01
Fixed Assets & Investments
Freehold Land 1 1.18 5.23
Building 7.21 6.32 4.22
Plant & Machinery 12.1 10.98 15.05
Office Equipment (Fur & Fix) 0.1 0.08 0.04
Capital Work in Progress 0.15 0.08 2.64
Long Term Investment 3.56 3.22 2.51
Long Term Deposits 0.54 0.7 0.36
Other Assets 2.37 2.5 1.92
Total Fixed Assets 39 36.13 41.43
Capital Employed 40.55 36.18 41.44
Less: Long term debt 10.83 8.06 17.85
Net Worth 29.72 28.12 23.59
General Reserve 11.64 0.93 7.84
Unappropriated Profit 9.55 9.9 11.21
Share Capital / Issued Capital 8.53 7.28 4.53
Share Holder Interest 29.72 28.12 23.59
Sales 100 100 100
Less: Cost of good sold 85.37 83.21 75.4
Gross Profit 14.62 16.78 24.59
Less: Operating expense 6.48 7.01 8.33
Operating Profit 8.13 9.76 16.26
Add: Non Trading Income 0.004 0.004 0.003
8.13 9.76 16.26
Less Financial & Other Charges
Financial 3.01 3.28 4.09
Other Charges 0.55 1.11 1.04
Net profit before taxes 2.11 2.28 8.28
Less: Taxes 0.91 0.92 0.79
Net profit after taxes 1.19 1.35 7.48
Operating Cash Flow 11.78 0.64 1.74
INDEX ANALYSIS
MSC TEXTILE MILLS (PVT) LTD
As at Year 2003 Year 2004 Year 2005
Current Assets % % %
Cash & Bank 100 184.76 185.3
Stock in trade / Inventory 100 114.9 171.1
Debtors 100 144.9 265.65
Investment & Other Receivable 100 98.49 130.06
Total Current Assets 100 125.58 184.74
Current Liabilities
Short term financing 100 125.64 155.49
Creditor 100 1.12 1.36
Taxation 100 92.27 79.67
Dividends 100 1.66 0.16
Other liabilities 100 118.42 603.21
Total Current Liabilities 100 123.88 182.34
Working Capital 100 7.73 3.23
Fixed Assets & Investments
Freehold Land 100 139.01 983.47
Building 100 102.62 110.04
Plant & Machinery 100 106.26 233.85
Office Equipment (Fur & Fix) 100 89.99 81
Capital Work in Progress 100 61.63 3251.73
Long Term Investment 100 106.13 132.57
Long Term Deposits 100 152.42 125.57
Other Assets 100 1.23 1.52
Total Fixed Assets 100 108.49 199.7
Capital Employed 100 3.82 1.59
Less: Long term debt 100 621.08 309.85
Net Worth 100 110.79 149.23
General Reserve 100 109.96 126.62
Unappropriated Profit 100 121.46 220.8
Share Capital / Issued Capital 100 100 100
Share Holder Interest 100 110.79 149.23
Sales 100 789.04 92.38
Less: Cost of good sold 100 88.92 81.59
Gross Profit 100 104.69 155.37
Less: Operating expense 100 98.66 118.61
Operating Profit 100 109.5 184.69
Add: Non Trading Income 100 98.77 70.71
100 109.49 184.63
Less Financial & Other Charges
Financial 100 99.42 125.76
Other Charges 100 184.83 174.09
Net profit before taxes 100 98.63 361.43
Less: Taxes 100 92.27 79.67
Net profit after taxes 100 103.73 577.72
Comments on Common Size
Analysis
The Common Size analysis of assets side of balance sheet shows that
percentage of current assets in relation with total assets first increase but
in last year it decreases. In fixed assets it increases. But in deposits and
advances has been decline three-year relation with the total of assets.
The liabilities side shows that current liabilities in percentage in relation
with total assets has also decrease so company must be careful to control
current liabilities, other items of liabilities are also declining over three
Years in relation with the percentage of total assets.
The income statement analysis shows that gross profit is increasing but
operating profit is declining. The overall net profit increasing over two
years and also grows in third year.
Comments on Index Analysis
Index analysis of balance sheet shows that by taking 2003 as base year the
total liabilities and shareholder’s equity has been increased over the next
two years, and same like as the case with assets which also increased over
the next two years.
From the income statement point of view gross profit has also increased
over the next two years as compared with the base year. The same is the
case with operating profit and ultimately net profit.
Table of Contents
• Preface
• Spread Sheet
• Trend Analysis
• Graphical representation of ratio
• Comments on Trend analysis
• Common Size Analysis
• Comments on common size analysis
• Index Size Analysis
• Comments on index analysis
Preface
Title:
Financial Statement Analysis of “ MSC Textile mills (Pvt.) Ltd.”
Objectives:
• To furnish information for making investment and credit decision.
• To identify performance to aid decision-making.
• Identify that how much a firm financial by external debt.
• Measure the performance of the assets.
• To know firm profitability and its market value.
Benefits:
• Use financial information’s to improve managerial decision.
• We will evaluate the financial condition and performance of a firm
over the year.
• Ratio can tell a comparison between assets and liabilities.
• Analyze whether a company invest more or not.
• To see the relationship between cash flows and accounting profit.
Sources:
• Financial Management By “van Horn”
• Managerial finance By “Lawrence j. Gitman”
• Annual report of “MSC Textile Mills (pvt) Ltd”.
Trend Analysis
MSC Textile Mills (pvt) Ltd
Years 2003 2004 2005
Liquidity Ratio:
Current Ratio 1.02:1 1.00:1 1.00:1
Quick Ratio 0.41:1 0.46:1 0.46:1
Cash Ratio 1.02:1 1.56:1 1.70:1
N.W.Capital Ratio 0.02:1 0.0007:1 0.0002:1
Debt Ratio:
Total Debt to Total Assets 0.10:1 0.12:1 0.14:1
Long Term Debt to Total Assets 0.01:1 0.08:1 0.17:1
Total Capitalization Ratio 1.09:1 1.36:1 1.45:1
Total Debt to Total Equity 63.35%: 37.65% 51.05%: 48.95% 52.05%: 47.95%
Long Term Debt to Total Equity 36.70%: 64.30% 45.75%: 55.25% 47.03%: 52.07%
Coverage Ratio:
Financial Charges Coverage Ratio1.70 Times 1.97 Times 2.96 Times
Assets Efficiency Ratio:
Receivable Turnover Ratio 2.36 Times 2.42 Times 3.14 Times
Inventory Turnover Ratio 4.79 Times 2.80 Times 1.95 Times
Payable Turnover Ratio 0.63 Times 0.41 Times 0.63 Times
Total Assets Turnover Ratio 0.01 Times 0.01 Times 0.04 Times
Payable Turnover in Days 571 Days 878 Days 571 Days
Inventory Turnover in Days 75 Days 128 Days 184 Days
Receivable Turnover in Days 152 Days 148 Days 114 Days
Operating Cycle 227 Days 276 Days 298 Days
Cash Cycle 334 Days 602 Days 273 Days
Profitability Ratio:
Gross Profit Margin 14.62% 16.78% 24.59%
Operating Profit Margin 8.13% 9.76% 16.26%
Net Profit Margin 1.19% 1.35% 7.88%
ROA / ROI 0.01% 0.01% 0.04%
ROE 1.81% 0.09% 0.24%
Liquidty Ratio
0
1
2
3
4
2003 2004 2005
Years
Values
N.W.Capital
Ratio
Cash Ratio
Quick Ratio
Current Ratio
Debt Ratio
0
0.5
1
1.5
2
2003 2004 2005
Years
Values
Total
Capitalization
Ratio
Long Term Debt
to Total Assets
Total Debt to
Total Assets
Total Debt to Total Equity Ratio
0% 50% 100%
2003
2004
2005
Total Debt Ratio
Total Equity Ratio
Long term Debt to Total Equity Ratio
0% 50% 100%
2003
2004
2005
Long term Debt
Ratio
Total Equity Ratio
Coverage Ratio
0
1
2
3
4
2003 2004 2005
Years
Times
Financial
Charges
Coverage Ratio
Assets Effciency Ratio
0
5
10
2003 2004 2005
Years
Times
Total Assets
Turnover Ratio
Payable
Turnover Ratio
Inventory
Turnover Ratio
Receivable
Turnover Ratio
Assets Efficiency Ratio
0
1000
2000
3000
2003 2004 2005
Years
Days
Cash
Cycle
Operating
Cycle
Receivable
Turnover in
Days
Inventory
Turnover in
Days
Payable
Turnover in
Days
Profatibality Ratio
0.00%
20.00%
40.00%
60.00%
2003 2004 2005
Years
Percentage
ROE
ROA / ROI
Net Profit
Margin
Operating Profit
Margin
Gross Profit
Margin
Aggregate Performance
The company in a position to meet every challenges regarding to
current assets and current liabilities. The company has sufficient
funds to meet its current and long-term debts.
The company cash cycle is also stable during the required time
periods and in position to invest in relevant aspects in which
company create greater profit and market share.
Company financial coverage is also better and company enjoys
better investment and more good financial position. Company’s
profit is also stable during the required time period. Company gets
sufficient returnon investment and assets.
Comments on Trend Analysis
As can be seen, the current ratio and acid test ratio has been
increased over year by year but the company needs more
improvement in order to get financial stability.
The firm cash ratio increased over three years, which tells that
company has enough cash to meet current obligations so, company
has to over come it.
Company’s debt ratio tells us that over three Years Company
become capable of receiving less financing from outside.
The company activity ratio shows that company’s assets are
efficiently utilized and company is trading its assets very carefully
and finally the profitability of a company is increasing quickly over
three years and company get sufficient returns on investment.