Introduction financial statement analysis
Bạn đang xem bản rút gọn của tài liệu. Xem và tải ngay bản đầy đủ của tài liệu tại đây (766.88 KB, 75 trang )
Financial Statements: Introduction
Whether you watch analysts on CNBC or read articles in The Wall Street Journal, you'll
hear experts insisting on the importance of "doing your homework" before investing in a
company. In other words, investors should dig deep into the company's financial
statements and analyze everything from the auditor's report to the footnotes. But what
does this advice really mean, and how does an investor follow it?
The aim of this tutorial is to answer these questions by providing a succinct yet advanced
overview of financial statements analysis. If you already have a grasp of the definition of
the balance sheet and the structure of an income statement, this tutorial will give you a
deeper understanding of how to analyze these reports and how to identify the "red flags"
and "gold nuggets" of a company. In other words, it will teach you the important factors
that make or break an investment decision.
In the United States, a company that offers its common stock to the public typically needs
to file periodic financial reports with the Securities and Exchange Commission (SEC).
We will focus on the three important reports outlined in this table:
Filing Includes
Must be filed with
SEC
10-K Annua
l Report
Audited financial
statements,
management
discussion &
analysis (MD&A)
and schedules
Within 90 days of
fiscal year end
(shortens to 60
days for larger
companies, as of
Dec. 15, 2005)
10-Q Quarte
rly Report
Unaudited financial
statement and
MD&A.
Within 45 days of
fiscal quarter
(shortens to 35
days for larger
companies as of
Dec. 15, 2005.)
14A Proxy
Statement
Proposed actions
taken to a
shareholder vote,
company ownership,
executive
compensation and
performance versus
peers.
Ahead of the
annual
shareholders'
meeting, filed
when sent to
shareholders.
The SEC governs the content of these filings and monitors the accounting profession. In
turn, the SEC empowers the Financial Accounting Standards Board (FASB) - an
independent, nongovernmental organization - with the authority to update U.S.
accounting rules. When considering important rule changes, FASB is impressively
careful to solicit input from a wide range of constituents and accounting professionals.
But once FASB issues a final standard, this standard becomes a mandatory part of the
total set of accounting standards known as Generally Accepted Accounting Principles
(GAAP).
Generally Accepted Accounting Principles (GAAP)
GAAP starts with a conceptual framework that anchors financial reports to a set of
principles such as materiality (the degree to which the transaction is big enough to
matter) and verifiability (the degree to which different people agree on how to measure
the transaction). The basic goal is to provide users - equity investors, creditors, regulators
and the public - with "relevant, reliable and useful" information for making good
decisions.
Because the framework is general, it requires interpretation, and often re-interpretation, in
light of new business transactions. Consequently, sitting on top of the simple framework
is a growing pile of literally hundreds of accounting standards. But complexity in the
rules is unavoidable for at least two reasons.
First, there is a natural tension between the two principles of relevance and reliability. A
transaction is relevant if a reasonable investor would care about it; a reported transaction
is reliable if the reported number is unbiased and accurate. We want both, but we often
cannot get both. For example, real estate is carried on the balance sheet at historical cost
because this historical cost is reliable. That is, we can know with objective certainty how
much was paid to acquire property. However, even though historical cost is reliable,
reporting the current market value of the property would be more relevant - but also less
reliable.
Consider also derivative instruments, an area where relevance trumps reliability.
Derivatives can be complicated and difficult to value, but some derivatives (speculative
not hedge derivatives) increase risk. Rules therefore require companies to carry
derivatives on the balance sheet at "fair value", which requires an estimate, even if the
estimate is not perfectly reliable. Again, the imprecise fair value estimate is more relevant
than historical cost. You can see how some of the complexity in accounting is due to a
gradual shift away from "reliable" historical costs to "relevant" market values.
The second reason for the complexity in accounting rules is the unavoidable restriction
on the reporting period: financial statements try to capture operating performance over
the fixed period of a year. Accrual accounting is the practice of matching expenses
incurred during the year with revenue earned, irrespective of cash flows. For example,
say a company invests a huge sum of cash to purchase a factory, which is then used over
the following 20 years. Depreciation is just a way of allocating the purchase price over
each year of the factory's useful life so that profits can be estimated each year. Cash flows
are spent and received in a lumpy pattern and, over the long run, total cash flows do tend
to equal total accruals. But in a single year, they are not equivalent. Even an easy
reporting question such as "how much did the company sell during the year?" requires
making estimates that distinguish cash received from revenue earned. For example, did
the company use rebates, attach financing terms or sell to customers with doubtful credit?
(Please note: throughout this tutorial we refer to U.S. GAAP and U.S specific securities
regulations, unless otherwise noted. While the principles of GAAP are generally the same
across the world, there are significant differences in GAAP for each country. Please keep
this in mind if you are performing analysis on non-U.S. companies. )
Financial statements paint a picture of the transactions that flow through a business. Each
transaction or exchange - for example, the sale of a product or the use of a rented a
building block - contributes to the whole picture.
Let's approach the financial statements by following a flow of cash-based transactions. In
the illustration below, we have numbered four major steps:
1. Shareholders and lenders supply capital (cash) to the company.
2. The capital suppliers have claims on the company. The balance sheet is an
updated record of the capital invested in the business. On the right-hand side of
the balance sheet, lenders hold liabilities and shareholders hold equity. The equity
claim is "residual", which means shareholders own whatever assets remain after
deducting liabilities.
The capital is used to buy assets, which are itemized on the left-hand side of the
balance sheet. The assets are current, such as inventory, or long-term, such as a
manufacturing plant.
3. The assets are deployed to create cash flow in the current year (cash inflows are
shown in green, outflows shown in red). Selling equity and issuing debt start the
process by raising cash. The company then "puts the cash to use" by purchasing
assets in order to create (build or buy) inventory. The inventory helps the
company make sales (generate revenue), and most of the revenue is used to pay
operating costs, which include salaries.
After paying costs (and taxes), the company can do three things with its cash profits.
One, it can (or probably must) pay interest on its debt. Two, it can pay dividends to
shareholders at its discretion. And three, it can retain or re-invest the remaining
profits. The retained profits increase the shareholders' equity account (retained
earnings). In theory, these reinvested funds are held for the shareholders' benefit and
reflected in a higher share price.
This basic flow of cash through the business introduces two financial statements: the
balance sheet and the statement of cash flows. It is often said that the balance sheet is
a static financial snapshot taken at the end of the year (To read more, see What is a
Cash Flow Statement? and Reading The Balance Sheet.)
Statement of Cash Flows
The statement of cash flows may be the most intuitive of all statements. We have already
shown that, in basic terms, a company raises capital in order to buy assets that generate a
profit. The statement of cash flows "follows the cash" according to these three core
activities: (1) cash is raised from the capital suppliers - cash flow from financing, (CFF),
(2) cash is used to buy assets - cash flow from investing (CFI), and (3) cash is used to
create a profit - cash flow from operations (CFO).
However, for better or worse, the technical classifications of some cash flows are not
intuitive. Below we recast the "natural" order of cash flows into their technical
classifications:
You can see the statement of cash flows breaks into three sections:
1. Cash flow from financing (CFF) includes cash received (inflow) for the issuance
of debt and equity. As expected, CFF is reduced by dividends paid (outflow).
2. Cash flow from investing (CFI) is usually negative because the biggest portion is
the expenditure (outflow) for the purchase of long-term assets such as plants or
machinery. But it can include cash received from separate (that is, not
consolidated) investments or joint ventures. Finally, it can include the one-time
cash inflows/outflows due to acquisitions and divestitures.
3. Cash flow from operations (CFO) naturally includes cash collected for sales and
cash spent to generate sales. This includes operating expenses such as salaries,
rent and taxes. But notice two additional items that reduce CFO: cash paid for
inventory and interest paid on debt.
The total of the three sections of the cash flow statement equals net cash flow: CFF + CFI
+ CFO = net cash flow. We might be tempted to use net cash flow as a performance
measure, but the main problem is that it includes financing flows. Specifically, it could be
abnormally high simply because the company issued debt to raise cash, or abnormally
low because it spent cash in order to retire debt.
CFO by itself is a good but imperfect performance measure. Consider just one of the
problems with CFO caused by the unnatural re-classification illustrated above. Notice
that interest paid on debt (interest expense) is separated from dividends paid: interest paid
reduces CFO but dividends paid reduce CFF. Both repay suppliers of capital, but the cash
flow statement separates them. As such, because dividends are not reflected in CFO, a
company can boost CFO simply by issuing new stock in order to retire old debt. If all
other things are equal, this equity-for-debt swap would boost CFO.
In the next installment of this series, we will discuss the adjustments you can make to the
statement of cash flows to achieve a more "normal" measure of cash flow.
In the previous section of this tutorial, we showed that cash flows through a business in
four generic stages. First, cash is raised from investors and/or borrowed from lenders.
Second, cash is used to buy assets and build inventory. Third, the assets and inventory
enable company operations to generate cash, which pays for expenses and taxes before
eventually arriving at the fourth stage. At this final stage, cash is returned to the lenders
and investors. Accounting rules require companies to classify their natural cash flows into
one of three buckets (as required by SFAS 95); together these buckets constitute the
statement of cash flows. The diagram below shows how the natural cash flows fit into the
classifications of the statement of cash flows. Inflows are displayed in green and outflows
displayed in red:
The sum of CFF, CFI and CFO is net cash flow. Although net cash flow is almost
impervious to manipulation by management, it is an inferior performance measure
because it includes financing cash flows (CFF), which, depending on a company's
financing activities, can affect net cash flow in a way that is contradictory to actual
operating performance. For example, a profitable company may decide to use its extra
cash to retire long-term debt. In this case, a negative CFF for the cash outlay to retire debt
could plunge net cash flow to zero even though operating performance is strong.
Conversely, a money-losing company can artificially boost net cash flow by issuing a
corporate bond or by selling stock. In this case, a positive CFF could offset a negative
operating cash flow (CFO), even though the company's operations are not performing
well.
Now that we have a firm grasp of the structure of natural cash flows and how they are
represented/classified, this section will examine which cash flow measures are best used
for a particular analysis. We will also focus on how you can make adjustments to figures
so that your analysis isn't distorted by reporting manipulations.
Which Cash Flow Measure Is Best?
You have at least three valid cash flow measures to choose from. Which one is suitable
for you depends on your purpose and whether you are trying to value the stock or the
whole company.
The easiest choice is to pull cash flow from operations (CFO) directly from the statement
of cash flows. This is a popular measure, but it has weaknesses when used in isolation: it
excludes capital expenditures, which are typically required to maintain the firm's
productive capability. It can also be manipulated, as we show below.
If we are trying to do a valuation or replace an accrual-based earnings measure, the basic
question is "which group/entity does cash flow to?" If we want cash flow to shareholders,
then we should use free cash flow to equity (FCFE), which is analogous to net earnings
and would be best for a price-to-cash flow ratio (P/CF).
If we want cash flows to all capital investors, we should use free cash flow to the
firm (FCFF). FCFF is similar to the cash generating base used in economic value added
(EVA). In EVA, it's called net operating profit after taxes (NOPAT) or sometimes net
operating profit less adjusted taxes (NOPLAT), but both are essentially FCFF where
adjustments are made to the CFO component.
Cash Flow To: Measure: Calculation:
Operations CFO
CFO or Adjusted
CFO
Shareholders
Free Cash
Flow to Equity
CFO - CFI *
Firm
(Shareholders and
Lenders)
Free Cash
Flow to Firm
(FCFF)
CFO + After-tax
interest - CFI*
(*) Cash flow from investment (CFI) is used as an estimate of the level of net capital
expenditures required to maintain and grow the company. The goal is to deduct
expenditures needed to fund "ongoing" growth, and if a better estimate than CFI is
available, then it should be used.
Free cash flow to equity (FCFE) equals CFO minus cash flows from investments (CFI).
Why subtract CFI from CFO? Because shareholders care about the cash available to them
after all cash outflows, including long-term investments. CFO can be boosted merely
because the company purchased assets or even another company. FCFE improves on
CFO by counting the cash flows available to shareholders net of all spending, including
investments.
Free cash flow to the firm (FCFF) uses the same formula as FCFE but adds after-tax
interest, which equals interest paid multiplied by [1 – tax rate]. After-tax interest paid is
added because, in the case of FCFF, we are capturing the total net cash flows available to
both shareholders and lenders. Interest paid (net of the company's tax deduction) is a cash
outflow that we add back to FCFE in order to get a cash flow that is available to all
suppliers of capital.
A Note Regarding Taxes
We do not need to subtract taxes separately from any of the three measures above. CFO
already includes (or, more precisely, is reduced by) taxes paid. We usually do want after-
tax cash flows since taxes are a real, ongoing outflow. Of course, taxes paid in a year
could be abnormal. So for valuation purposes, adjusted CFO or EVA-type calculations
adjust actual taxes paid to produce a more "normal" level of taxes. For example, a firm
might sell a subsidiary for a taxable profit and thereby incur capital gains, increasing
taxes paid for the year. Because this portion of taxes paid is non-recurring, it could be
removed to calculate a normalized tax expense. But this kind of precision is not always
necessary. It is often acceptable to use taxes paid as they appear in CFO.
Adjusting Cash Flow from Operations (CFO)
Each of the three cash flow measures includes CFO, but we want to capture sustainable
or recurring CFO, that is, the CFO generated by the ongoing business. For this reason, we
often cannot accept CFO as reported in the statement of cash flows, and generally need to
calculate an adjusted CFO by removing one-time cash flows or other cash flows that are
not generated by regular business operations. Below, we review four kinds of adjustments
you should make to reported CFO in order to capture sustainable cash flows. First,
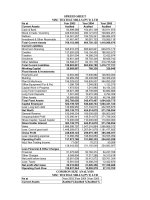
consider a "clean" CFO statement from Amgen, a company with a reputation for
generating robust cash flows:
Amgen shows CFO in the indirect format. Under the indirect format, CFO is derived
from net income with two sets of 'add backs'. First, non-cash expenses, such as
depreciation, are added back because they reduce net income but do not consume cash.
Second, changes to operating (current) balance sheet accounts are added or subtracted. In
Amgen's case, there are five such additions/subtractions that fall under the label "cash
provided by (used in) changes in operating assets and liabilities": three of these balance-
sheet changes subtract from CFO and two of them add to CFO.
For example, notice that trade receivables (also known as accounts receivable) reduces
CFO by about $255 million: trade receivables is a 'use of cash'. This is because, as a
current asset account, it increased by $255 million during the year. This $255 million is
included as revenue and therefore net income, but the company hadn't received the cash
as of the year's end, so the uncollected revenues needed to be excluded from a cash
calculation. Conversely, accounts payable is a 'source of cash' in Amgen's case. This
current-liability account increased by $74 million during the year; Amgen owes the
money and net income reflects the expense, but the company temporarily held onto the
cash, so its CFO for the period is increased by $74 million.
We will refer to Amgen's statement to explain the first adjustment you should make to
CFO:
1. Tax Benefits Related to Employee Stock Options (See #1 on Amgen CFO
statement)
Amgen's CFO was boosted by almost $269 million because a company gets a tax
deduction when employees exercise non-qualified stock options. As such, almost
8% of Amgen's CFO is not due to operations and is not necessarily recurring, so
the amount of the 8% should be removed from CFO. Although Amgen's cash
flow statement is exceptionally legible, some companies bury this tax benefit in a
footnote.
To review the next two adjustments that must be made to reported CFO, we will
consider Verizon's statement of cash flows below.
2. Unusual Changes to Working Capital Accounts (receivables, inventories
and payables) (Refer to #2 on Verizon's CFO statement.)
Although Verizon's statement has many lines, notice that reported CFO is derived
from net income with the same two sets of add backs we explained above: non-
cash expenses are added back to net income and changes to operating accounts
are added to or subtracted from it:
Notice that a change in accounts payable contributed more than $2.6 billion to
reported CFO. In other words, Verizon created more than $2.6 billion in
additional operating cash in 2003 by holding onto vendor bills rather than paying
them. It is not unusual for payables to increase as revenue increases, but if
payables increase at a faster rate than expenses, then the company effectively
creates cash flow by "stretching out" payables to vendors. If these cash inflows
are abnormally high, removing them from CFO is recommended because they
are probably temporary. Specifically, the company could pay the vendor bills in
January, immediately after the end of the fiscal year. If it does this, it artificially
boosts the current-period CFO by deferring ordinary cash outflows to a future
period.
Judgment should be applied when evaluating changes to working capital
accounts because there can be good or bad intentions behind cash flow created
by lower levels of working capital. Companies with good intentions can work to
minimize their working capital - they can try to collect receivables quickly,
stretch out payables and minimize their inventory. These good intentions show
up as incremental and therefore sustainable improvements to working capital.
Companies with bad intentions attempt to temporarily dress-up cash flow right
before the end of the reporting period. Such changes to working capital accounts
are temporary because they will be reversed in the subsequent fiscal year. These
include temporarily withholding vendor bills (which causes a temporary increase
in accounts payable and CFO), cutting deals to collect receivables before the
year's end (causing a temporary decrease in receivables and increase in CFO), or
drawing down inventory before the year's end (which causes a temporary
decrease in inventory and increase in CFO). In the case of receivables, some
companies sell their receivables to a third party in a factoring transaction, which
has the effect of temporarily boosting CFO.
3. Capitalized Expenditures That Should Be Expensed (outflows in CFI that
should be manually re-classified to CFO) (Refer to #3 on the Verizon CFO
statement.)
Under cash flow from investing (CFI), you can see that Verizon invested almost
$11.9 billion in cash. This cash outflow was classified under CFI rather than
CFO because the money was spent to acquire long-term assets rather than pay
for inventory or current operating expenses. However, on occasion this is a
judgment call. WorldCom notoriously exploited this discretion by reclassifying
current expenses into investments and, in a single stroke, artificially boosting
both CFO and earnings.
Verizon chose to include 'capitalized software' in capital expenditures. This refers
to roughly $1 billion in cash spent (based on footnotes) to develop internal
software systems. Companies can choose to classify software developed for
internal use as an expense (reducing CFO) or an investment (reducing CFI).
Microsoft, for example, responsibly classifies all such development costs as
expenses rather than capitalizing them into CFI, which improves the quality of
its reported CFO. In Verizon's case, it's advisable to reclassify the cash outflow
into CFO, reducing it by $1 billion.
The main idea here is that if you are going to rely solely on CFO, you should
check CFI for cash outflows that ought to be reclassified to CFO.
4. One-Time (Nonrecurring) Gains Due to Dividends Received or Trading
Gains
CFO technically includes two cash flow items that analysts often re-classify into
cash flow from financing (CFF): (1) dividends received from investments and (2)
gains/losses from trading securities (investments that are bought and sold for
short-term profits). If you find that CFO is boosted significantly by one or both
of these items, they are worth examination. Perhaps the inflows are sustainable.
On the other hand, dividends received are often not due to the company's core
operating business and may not be predictable. Gains from trading securities are
even less sustainable: they are notoriously volatile and should generally be
removed from CFO unless, of course, they are core to operations, as with an
investment firm. Further, trading gains can be manipulated: management can
easily sell tradable securities for a gain prior to the year's end, boosting CFO.
Summary
Cash flow from operations (CFO) should be examined for distortions in the following
ways:
• Remove gains from tax benefits due to stock option exercises.
• Check for temporary CFO blips due to working capital actions. For
example, withholding payables, or "stuffing the channel", to temporarily reduce
inventory.
• Check for cash outflows classified under CFI that should be reclassified to CFO.
• Check for other one-time CFO blips due to nonrecurring dividends or trading
gains.
Aside from being vulnerable to distortions, the major weakness of CFO is that it excludes
capital investment dollars. We can generally overcome this problem by using free cash
flow to equity (FCFE), which includes (or, more precisely, is reduced by) capital
expenditures (CFI). Finally, the weakness of FCFE is that it will change if the capital
structure changes. That is, FCFE will go up if the company replaces debt with equity (an
action that reduces interest paid and therefore increases CFO) and vice versa. This
problem can be overcome by using free cash flow to firm (FCFF), which is not distorted
by the ratio of debt to equity.
Financial Statements: Earnings
In this section, we try to answer the question, "what earnings number should be used to
evaluate company performance?" We start by considering the relationship between
the cash flow statement and the income statement. In the preceding section, we explained
that companies must classify cash flows into one of three categories: operations,
investing, or financing. The diagram below traces selected cash flows from operations
and investing to their counterparts on the income statement (cash flow from financing
(CFF) does not generally map to the income statement):
Many cash flow items have a direct counterpart, that is, an accrual item on the income
statement. During a reporting period like a fiscal year or a fiscal quarter, the cash flow
typically will not match its accrual counterpart. For example, cash spent during the year
to acquire new inventory will not match cost of goods sold (COGS). This is because
accrual accounting gives rise to timing differences in the short run: on the income
statement, revenues count when they are earned and they're matched against expenses as
the expenses are incurred.
Expenses on the income statement are meant to represent costs incurred during the period
that can be tracked either (1) to cash already spent in a prior period or (2) to cash that
probably will be spent in a future period. Similarly, revenues are meant to recognize cash
that is earned in the current period but either (1) has already been received or (2)
probably will be received in the future. Although cash flows and accruals will disagree in
the short run, they should converge in the long run, at least in theory.
<script language="JavaScript" type="text/javascript"> document.write('<a
href="
target="_blank"><img
src="
</script><noscript><a
href="
target="_blank"><img border="0"
src="
/></a></noscript>
Consider two examples:
• Depreciation - Say a company invests $10 million to buy a manufacturing plant,
triggering a $10 million cash outflow in the year of purchase. If the life of the
plant is 10 years, the $10 million is divided over each of the subsequent 10 years,
producing a non-cash depreciation expense each year in order to recognize the
cost of the asset over its useful life. But cumulatively, the sum of the depreciation
expense ($1 million per year x 10 years) equals the initial cash outlay.
• Interest Expense - Say a company issues a zero-coupon corporate bond, raising
$7 million with the obligation to repay $10 million in five years. During each of
the five interim years, there will be an annual interest expense but no
corresponding cash outlay. However, by the end of the fifth year, the cumulative
interest expense will equal $3 million ($10 million - $7 million), and the
cumulative net financing cash outflow will also be $3 million.
In theory, accrual accounting ought to be superior to cash flows in gauging operating
performance over a reporting period. However, accruals must make estimations and
assumptions, which introduce the possibility of flaws.
The primary goal when analyzing an income statement is to capture normalized earnings,
that is, earnings that are both recurring and operational in nature. Trying to capture
normalized earnings presents two major kinds of challenges: timing issues and
classification choices. Timing issues cause temporary distortions in reported profits.
Classification choices require us to remove one-time items or earnings not generated by
ongoing operations, such as gains from pension plan investments.
Timing Issues
Most timing issues fall into four major categories:
Major
Category:
For Example:
Specific
Implications:
1.
Recognizing
Revenue Too
Early
• Selling with
extended
financing terms.
For example,
the customer
doesn't pay for
18 months.
• Revenue
recognized in
current
period but
could be
"reversed" in
the next year.
2. Delaying,
or "front
loading"
expenses to
save them in
future years
• Capitalizing
expenditures
that could be
expensed
• Slowing down
depreciation
• Only part of
the
expenditure
is expensed
in the current
year - the
rate of long-
term assets
• Taking big
write-offs (also
know as "big
baths")
rest is added
to future
depreciation
expense
• Depreciation
expense is
reduced in
current year
because total
depreciation
expense
allocated
over a
greater
number of
years
• Saves
expenses in
future years
3.
Overvaluing
Assets
• Underestimating
obsolete
inventory
• Failing to write
down or write
off impaired
assets
• As obsolete
(low-cost)
inventory is
liquidated,
COGS is
lowered and
gross profit
margins are
increased
• Keeping
overvalued
assets on the
balance sheet
overstates
profits until
losses are
finally
recognized.
4.
Undervaluing
Liabilities
• Lowering net
pension
obligation by
increasing the
assumed return
on pension
• A lower net
pension
obligation
reduces the
current
assets
• Excluding stock
option expense
pension cost.
• Avoids
recognizing a
future
transfer of
wealth from
shareholders
to employees
Premature revenue recognition and delayed expenses are more intuitive than the
distortions caused by the balance sheet, such as overvalued assets. Overvalued assets are
considered a timing issue here because, in most (but not all) cases, "the bill eventually
comes due." For example, in the case of overvalued assets, a company might keep
depreciation expense low by carrying a long-term asset at an inflated net book value
(where net book value equals gross asset minus accumulated depreciation), but eventually
the company will be required to "impair" or write-down the asset, which creates an
earnings charge. In this case, the company has managed to keep early period expenses
low by effectively pushing them into future periods.
It is important to be alert to earnings that are temporarily too high or even too low due to
timing issues.
Classification Choices
Once the income statement is adjusted or corrected for timing differences, the other major
issue is classification. In other words, which profit number do we care about? The
question is further complicated because GAAP does not currently dictate a specific
format for the income statement. As of May 2004, FASB has already spent over two
years on a project that will impact the presentation of the income statement, and they are
not expected to issue a public discussion document until the second quarter of 2005.
We will use Sprint's latest income statement to answer the question concerning the issue
of classification.
We identified five key lines from Sprint's income statement. (The generic label for the
same line is in parentheses):
1. Operating Income Before Depreciation and Amortization (EBITDA)
Sprint does not show EBITDA directly, so we must add depreciation and
amortization to operating income (EBIT). Some people use EBITDA as a proxy
for cash flow because depreciation and amortization are non-cash charges, but
EBITDA does not equal cash flow because it does not include changes to
working capital accounts. For example, EBITDA would not capture the increase
in cash if accounts receivable were to be collected.
The virtue of EBITDA is that it tries to capture operating performance, that is,
profits after cost of goods sold (COGS) and operating expenses, but before non
operating items and financing items such as interest expense. However, there are
two potential problems. First, not necessarily everything in EBITDA is operating
and recurring. Notice that Sprint's EBITDA includes an expense of $1.951 billion
for "restructuring and asset impairments." Sprint surely includes the expense
item here to be conservative, but if we look at the footnote, we can see that much
of this expense is related to employee terminations. Since we do not expect
massive terminations to recur on a regular basis, we could safely exclude this
expense.
Second, EBITDA has the same flaw as operating cash flow (OCF), which we
discussed in this tutorial's section on cash flow: there is no subtraction for long-
term investments, including the purchase of companies (because goodwill is a
charge for capital employed to make an acquisition). Put another way, OCF
totally omits the company's use of investment capital. A company, for example,
can boost EBITDA merely by purchasing another company.
2. Operating Income After Depreciation and Amortization (EBIT)
In theory, this is a good measure of operating profit. By including depreciation
and amortization, EBIT counts the cost of making long-term investments.
However, we should trust EBIT only if depreciation expense (also called
accounting or book depreciation) approximates the company's actual cost to
maintain and replace its long-term assets. (Economic depreciation is the term
used to describe the actual cost of maintaining long-term assets). For example, in
the case of a REIT, where real estate actually appreciates rather than depreciates
- where accounting depreciation is far greater than economic depreciation - EBIT
is useless.
Furthermore, EBIT does not include interest expense and, therefore, is not
distorted by capital structure changes. In other words, it will not be affected
merely because a company substitutes debt for equity or vice versa. By the same
token, however, EBIT does not reflect the earnings that accrue to shareholders
since it must first fund the lenders and the government.
As with EBITDA, the key task is to check that recurring, operating items are
included and that items that are either non-operating or non-recurring are
excluded.
3. Income From Continuing Operations Before Taxes (Pre-Tax Earnings)
Pre-tax earnings subtracts (includes) interest expense. Further, it includes other
items that technically fall within "income from continuing operations," which is
an important technical concept.
Sprint's presentation conforms to accounting rules: items that fall within income
from continuing operations are presented on a pre-tax basis (above the income
tax line), whereas items not deemed part of continuing operations are shown
below the tax expense and on a net tax basis.
The thing to keep in mind is that you want to double-check these classifications.
We really want to capture recurring, operating income, so income from
continuing operations is a good start. In Sprint's case, the company sold an entire
publishing division for an after-tax gain of $1.324 billion (see line "discontinued
operations, net"). Amazingly, this sale turned a $623 million loss under income
from continuing operations before taxes into a $1.2+ billion gain under net
income. Since this gain will not recur, it is correctly classified.
On the other hand, notice that income from continuing operations includes a line
for the "discount (premium) on the early retirement of debt." This is a common
item, and it occurs here because Sprint refinanced some debt and recorded a loss.
But in substance, it is not expected to recur and therefore it should be excluded.
4. Income From Continuing Operations (Net Income From Continuing
Operations)
This is the same as above, but taxes are subtracted. From a shareholder
perspective, this is a key line, and it's also a good place to start since it is net of
both interest and taxes. Furthermore, it excludes the non-recurring items
discussed above, which instead fall into net income but can make net income an
inferior gauge of operating performance.
5. Net Income
Compared to income from continuing operations, net income has three additional
items that contribute to it: extraordinary items, discontinued operations, and
accounting changes. They are all presented net of tax. You can see two of these
on Sprint's income statement: "discontinued operations" and the "cumulative
effect of accounting changes" are both shown net of taxes - after the income tax
expense (benefit) line.
You should check to see if you disagree with the company's classification,
particularly concerning extraordinary items. Extraordinary items are deemed to
be both "unusual and infrequent" in nature. However, if the item is deemed to be
either "unusual" or "infrequent," it will instead be classified under income from
continuing operations.
Summary
In theory, the idea behind accrual accounting should make reported profits superior to
cash flow as a gauge of operating performance. But in practice, timing issues and
classification choices can paint a profit picture that is not sustainable. Our goal is to
capture normalized earnings generated by ongoing operations.
To do that, we must be alert to timing issues that temporarily inflate (or deflate) reported
profits. Furthermore, we should exclude items that are not recurring, resulting from either
one-time events or some activity other than business operations. Income from continuing
operations - either pre-tax or after-tax - is a good place to start. For gauging operating
performance, it is a better starting place than net income, because net income often
includes several non-recurring items such as discontinued operations, accounting changes
and extraordinary items (which are both unusual and infrequent).
We should be alert to items that are technically classified under income from continuing
operations but perhaps should be manually excluded. This may include investment gains
and losses, items deemed either "unusual" or "infrequent" and other one-time transactions
such as the early retirement of debt.
Financial Statements: Revenue
Revenue recognition refers to a set of accounting rules that governs how a company
accounts for its sales. Many corporate accounting scandals have started with companies
admitting they have reported "irregular" revenues. This kind of dishonesty is a critical
accounting issue. In several high-profile cases, management misled investors - and its
own auditors - by deliberately reporting inflated revenues in order to buoy its company's
stock price. As of June 2004, the Financial Accounting Standards Board (FASB) has
begun working to consolidate and streamline the various accounting rules into a single
authoritative pronouncement.
But this series is not concerned with detecting fraud: there are several books that catalog
fraudulent accounting practices and the high-profile corporate meltdowns that have
resulted from them. The problem is that most of these scams went undetected, even by
professional investors, until it was too late. In practice, individual investors can rarely
detect bogus revenue schemes; to a large extent, we must trust the financial statements as
they are reported. However, when it comes to revenue recognition, there are a few things
we can do.
1. Identify Risky Revenues
If only cash counted, revenue reporting would not pose any risk of misleading investors.
But the accrual concept allows companies to book revenue before receiving cash.
Basically, two conditions must be met: (1) the critical earnings event must be completed
(for example, service must be provided or product delivered) and (2) the payment must
be measurable in its amount, agreed upon with the buyer, and its ultimate receipt must be
reasonably assured (SFAC 5, SEC Bulletin 101).
For some companies, recording revenue is simple; but for others, the application of the
above standards allows for, and even requires, the discretion of management. The first
thing an investor can do is identify whether the company poses a high degree of
accounting risk due to this discretion. Certain companies are less likely to suffer revenue
restatements simply because they operate with more basic, transparent business models.
(We could call these "simple revenue" companies.) Below, we list four aspects of a
company and outline the degree of accounting risk associated with each aspect:
Aspects of
Companies
Type
Associated
with
Simple
Revenue
Type
Associated
with
Difficult
Revenue
Examples of
"Difficult"
Revenue
1. Revenue Product Service Extended
Type
service
warranty
contract is
sold with
consumer
electronics
Ownership
Type
Company is
the
owner/seller
Company is
an agent,
distributor or
franchisor (or
products are
sold on
consignment)
Auction site
sells airline
tickets
(should it
report "gross"
revenue or
"net" fee
received?) Or
a restaurant
boosts
revenue by
collecting
franchise fees
Type of
Sales Cycle
Sales are
made at
delivery or
"point of
sale"
Sales are
made via
long-term
service,
subscription
or
membership
contracts
Fitness
facility
operator sells
long-term
gym
memberships
Degree of
Product
Complexity
Stand-alone
products
Bundled
products and
services (that
is, multiple
deliverable
arrangements
(MDAs))
Software
publisher
bundles
installation
and technical
support with
product
Many of the companies that have restated their revenues sold products or services in
some combination of the modes listed above under "difficult revenues." In other words,
the sales of these companies tended to involve long-term service contracts, making it
difficult to determine how much revenue should be counted in the current period when
the service is not yet fully performed. These companies also engaged in complex
franchise arrangements, pre-sold memberships or subscriptions and/or the bundling of
multiple products and/or services.
We're not suggesting that you should avoid these companies - to do so would be almost
impossible! Rather, the idea is to identify the business model; if you determine that any
risky factors are present, then you should scrutinize the revenue recognition policies
carefully.
For example, Robert Mondavi (ticker: MOND) sells most of its wines in the U.S. to
distributors under terms called FOB Shipping Point. This means that, once the wines are
shipped, the buyers assume most of the risk, which means they generally cannot return
the product. Mondavi collects simple revenue: it owns its product, gets paid fairly quickly
after delivery and the product is not subject to overly complex bundling arrangements.
Therefore, when it comes to trusting the reported revenues "as reported," a company such
as Robert Mondavi poses low risk. If you were analyzing Mondavi, you could spend your
time focusing on other aspects of its financial statements.
On the other hand, enterprise software companies such as Oracle or PeopleSoft naturally
pose above-average accounting risk. Their products are often bundled with intangible
services that are tied to long-term contracts and sold through third-party resellers. Even
the most honest companies in this business cannot avoid making revenue-reporting
judgments and must therefore be scrutinized.
2. Check Against Cash Collected
The second thing you can do is to check reported revenues against the actual cash
received from customers. In the section on cash flow, we see that companies can show
cash from operations (CFO) in either the direct or indirect format; unfortunately, almost
all companies use the indirect method. A rare exception is Collins Industries:
The virtue of the direct method is that it displays a separate line for "cash received from
customers." Such a line is not shown under the indirect method, but we only need three
items to calculate the cash received from customers:
(1) Net sales
(2) Plus the decrease in accounts receivable (or minus the increase)
(3) Plus the increase in cash advances from customers
(or minus the decrease)
____________________________________________________________
= Cash received from customers
We add the decrease in accounts receivable because it signifies cash received to pay
down receivables. 'Cash advances from customers' represents cash received for services
not yet rendered; this is also known as unearned or deferred revenue and is classified as a
current liability on the balance sheet. Below, we do this calculation for Collins Industries.
You can see that our calculated number (shown under "How to Calculate 'Cash Received
from Customers'") equals the reported cash collected from customers (circled in green
above):
We calculate 'cash received from customers' to compare the growth in cash received to
the growth in reported revenues. If the growth in reported revenues jumps far ahead of
cash received, we need to ask why. For example, a company may induce revenue growth
by offering favorable financing terms - like the ads you often see for consumer
electronics that offer "0% financing for 18 months." A new promotion such as this will
create booked revenue in the current period, but cash won't be collected until future
periods. And of course, some of the customers will default and their cash won't be
collected. So the initial revenue growth may or may not be good growth, in which case,
we should pay careful attention to the allowance for doubtful accounts.
Allowance for Doubtful Accounts
Of course, many sales are offered with credit terms: the product is sold and an accounts
receivable is created. Because the product has been delivered (or service has been
rendered) and payment is agreed upon, known and reasonably assured, the seller can
book revenue.
However, the company must estimate how much of the receivables will not be collected.
For example, it may book $100 in gross receivables but, because the sales were on credit,
the company might estimate that $7 will ultimately not be collected. Therefore, a $7
allowance is created and only $93 is booked as revenue. As you can see, a company can
report higher revenues by lowering this allowance.
Therefore, it is important to check that sufficient allowances are made. If the company is
growing rapidly and funding this growth with greater accounts receivables, then the
allowance for doubtful accounts should be growing too.
3. Parse Organic Growth from Other Revenue Sources
The third thing investors can do is scrutinize the sources of revenues. This involves
identifying and then parsing different sources of growth. The goal is to identify the
sources of temporary growth and separate them from organic, sustainable growth.
Let's consider the two dimensions of revenue sources. The first dimension is cash versus
accrual: we call this "cash" versus "maybe cash" (represented on the left side of the box
below). "Maybe cash" refers to any booked revenue that is not collected as cash in the
current period. The second dimension is sustainable versus temporary revenue
(represented on the top row of the box below):
To illustrate the parsing of revenues, we will use the latest annual report from Office
Depot (ticker: ODP), a global retail supplier of office products and services. For fiscal
2003, reported sales of $12.358 billion represented an 8.8% increase over the prior year.
First, we will parse the accrual (the "maybe cash") from the cash. We can do this by
looking at the receivables. You will see that, from 2002 to 2003, receivables jumped from
$777.632 million to $1.112 billion, and the allowance for doubtful accounts increased
from $29.149 million in 2002 to $34.173 million in 2003.