Starch and Protein Quality Requirements of Japanese Alkaline Noodles (Ramen).pdf
Bạn đang xem bản rút gọn của tài liệu. Xem và tải ngay bản đầy đủ của tài liệu tại đây (90.3 KB, 7 trang )
328 CEREAL CHEMISTRY
Starch and Protein Quality Requirements of Japanese Alkaline Noodles (Ramen)
G. B. Crosbie,
1,2
A. S. Ross,
3
T. Moro,
4
and P. C. Chiu
1
ABSTRACT Cereal Chem. 76(3):328–334
Studies on samples of 20 hard-grained wheat cultivars and a commer-
cial flour that varied in starch and protein quality showed that both char-
acteristics influenced the texture of Japanese alkaline noodles (ramen).
Flour swelling volume (FSV) and flour pasting characteristics (peak
viscosity and breakdown) determined with a Rapid-Visco Analyser (RVA)
assessed independently of α-amylase effects, were negatively correlated
with total texture score. Protein quality, as indicated by farinograph stability,
was positively correlated with total texture score. RVA pasting characteristics
were substantially affected by small levels of α-amylase, and inactivation
by means of 1 mM AgNO
3
was a critical requirement in characterizing the
quality of the starch component of flour.
Alkaline noodles, referred to as “ramen” in Japan, represent more
than 40% of all noodles manufactured in that country and exceed
the levels of other noodle types including udon, soba, and durum
wheat products (Crosbie et al 1990). One reason for the popularity
of ramen over other noodle types is a preference for the flavor and
texture of ramen by younger Japanese consumers. Both flavor and
texture of ramen are influenced by the addition of ≈1% alkali, usually
a mixture of sodium and potassium carbonates (Miskelly and Moss
1985). Alkaline noodles include the popular steamed and fried instant
ramen, although this type has less exacting flour quality require-
ments than the main type of ramen (Nagao 1996).
The texture of ramen is an important factor influencing consumer
acceptance. Ideally, the boiled ramen should be firm, springy, not
sticky, and smooth. Similar textural characteristics are preferred in
other alkaline noodle types including Cantonese (Miskelly and Moss
1985) and Hokkien noodles (Moss 1984, Shelke et al 1990).
In studies on factors influencing alkaline noodle texture, wheat or
flour protein content has been positively associated with noodle firm-
ness (Shirao and Moss 1978, Miskelly 1981, Moss 1984, Shelke et
al 1990, Konik et al 1994, Ross et al 1997) and elasticity (Shirao and
Moss 1978, Miskelly 1981, Ross et al 1997), and negatively linked
with smoothness (Konik et al 1994, Ross et al 1997). Noodle texture
was also affected by protein quality. Flours with stronger dough prop-
erties were reported to give noodles that were firmer (Miskelly 1981,
Moss 1984, Miskelly and Moss 1985, Ross et al 1997) and more
elastic (Miskelly and Moss 1985, Ross et al 1997) but less smooth
(Ross et al 1997).
The importance of starch quality to the texture of white salted
noodles, particularly udon, has been well established. Improved
noodle texture has been associated with lower flour gelatinization
temperature (Nagao 1977), low starch paste stability or high starch
paste peak viscosity (Shirao and Moss 1978, Moss 1980, Oda et al
1980, Crosbie 1991, Konik and Moss 1992, Yun et al 1996), and
high starch and flour swelling power or swelling volume (Endo et
al 1988; Crosbie, 1989, 1991; Toyokawa et al 1989; Crosbie and
Lambe 1990, 1993; McCormick et al 1991; Crosbie et al 1992;
Konik et al 1993; Wang and Seib 1996; Yun et al 1996).
In contrast, fewer studies have been undertaken on the effects of
starch quality on alkaline noodles, and these have varied in their
results and conclusions. Shirao and Moss (1978) found that starch
pasting characteristics were important, but to assess them it was im-
portant to isolate the starch from the flour to assess the potential
of the flour for alkaline (and white salted) noodles. This view was
also supported by Miskelly and Moss (1985). On the other hand,
Baik et al (1994) reported that, in contrast to udon, starch charac-
teristics may be less important in other noodle types, including
alkaline Cantonese noodles. However, more recent studies (Konik
et al 1994, Batey et al 1997, Ross et al 1997) have confirmed the
importance of the starch component and have reported significant
correlations between textural characteristics of alkaline noodles and
selected flour pasting characteristics (peak viscosity and breakdown)
determined with a Rapid-Visco Analyser (RVA) or swelling param-
eters derived on flour or whole meal.
In the studies in which starch or flour paste characteristics have
been considered important for alkaline noodles, results have varied
in relation to the importance of specific paste viscosity parameters.
Starch paste stability (breakdown), assessed at constant peak viscosity,
was found to be significant by Shirao and Moss (1978) and Miskelly
and Moss (1985). This was supported by the study of Konik et al
(1994), who conducted tests on starch and flour using a constant sample
weight and reported that RVA breakdown was positively correlated
with smoothness and negatively with firmness. In the case of starch,
RVA breakdown was negatively correlated with elasticity and eating
quality. Later, Batey et al (1997) and Ross et al (1997) also confirmed
the importance of RVA breakdown assessed on flour and a constant
sample weight to indicate textural characteristics of alkaline noodles.
There has been less agreement in the case of another parameter, peak
viscosity. Batey et al (1997) reported that the correlations between
1
Agriculture Western Australia, Locked Bag No. 4, Bentley Delivery Center, WA
6983, Australia.
2
Corresponding author. E-mail:
3
BRI Australia Ltd, P.O. Box 7, North Ryde, NSW 2113. Current address: School
of Public Health, Curtin University of Technology, GPO Box U1987, Perth, WA
6845, Australia.
4
Nippon Flour Mills Co., Ltd, Central Laboratory 2114-2, Nurumizu, Atsugi, 243
Japan.
Publication no. C-1999-0415-02R.
© 1999 American Association of Cereal Chemists, Inc.
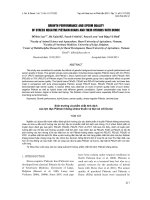
Fig. 1. Effect of AgNO
3
concentration on peak viscosity measured in
Rapid-Visco Analyser units (RVU) of a whole meal flour with a falling
number of 209 sec.
Vol. 76, No. 3, 1999 329
flour paste breakdown and flour peak viscosity and various noodle
textural characteristics were highly significant and of similar magni-
tude. However, Konik et al (1994) reported much lower, nonsigni-
ficant correlations between peak viscosity assessed on flour and
starch and textural characteristics of the noodles.
Some of the variation in results may be due to the fact that in
several of the studies, no inactivation treatment was applied to elim-
inate the effects of α-amylase in flour paste viscosity tests. The
importance of this in determining inherent pasting properties of flour
was stressed by Dengate (1984), who also reported that an inacti-
vation treatment may be needed in tests on starch because of possible
carryover of α-amylase activity in the starch isolation process.
Among various treatments applied to inactivate α-amylase, the
use of AgNO
3
at a range of concentrations has proved popular. Hutch-
inson (1966) favored use at a level of 1 mg/2 g of flour (0.3–0.4 mM
in amylograph tests). Crosbie and Lambe (1993) reported the use of
0.5 mM AgNO
3
to eliminate the effect of α-amylase in flour
swelling volume (FSV) tests on whole meal flour to assess potential
noodle quality of breeding lines severely affected by field sprout-
ing. Bhattacharya and Corke (1996) used 0.5 mM AgNO
3
and Bhatta-
charya et al (1997) used 1 mM AgNO
3
in RVA tests to assess starch
pasting properties of whole meal flour. Batey et al (1997) favored
the use of a much higher concentration (12 mM AgNO
3
) in meas-
uring the pasting characteristics of flour to assess suitability for white
salted noodles. This was based on an improvement in the correlation
between flour paste peak viscosity and total texture score when 12 mM
AgNO
3
was used instead of water. However, when the study was re-
peated on a different set of samples that had been assessed for alka-
line noodle quality, high correlations were achieved with both water
and AgNO
3
treatments, and it was concluded that an inactivation treat-
ment was not necessary when assessing flour for alkaline noodles. On
the other hand, Ross et al (1997) found 3.125% Na
2
CO
3
to be useful
in reducing effects of low levels of α-amylase associated with im-
proved correlations between peak viscosity and textural properties of
Cantonese noodles when compared with those obtained using water
alone.
There were three goals in the present study: 1) to determine an
appropriate concentration of AgNO
3
to use to inactivate α-amy-
lase in RVA tests on flour; 2) to test the effectiveness of the selected
inactivation treatment in RVA tests on samples of grain varying
widely in α-amylase level; and 3) to apply these results and extend
the work done in assessing the importance of starch and protein quality
in relation to alkaline noodles by focusing on Japanese ramen as
assessed by the established Japanese method (NFRI, MAFF 1985).
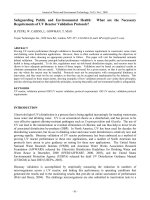
Fig. 2. Viscosity measured in Rapid-Visco Analyser units (RVU) for blends of sound and sprouted whole meal flour. Eradu tested in water (A) and 1 mM
AgNO
3
(B). Kulin tested in water (C) and 1 mM AgNO
3
(D). Falling number values were 177–472 sec for Eradu and 161–427 sec for Kulin.
330 CEREAL CHEMISTRY
MATERIALS AND METHODS
Grain and Flour Samples and Subsequent Treatments
Experiment 1. Determination of an appropriate AgNO
3
concentra-
tion to inactivate α-amylase in RVA tests. In this experiment, a wheat
sample affected by preharvest rain in 1996 was ground in a Teca-
tor laboratory grinder fitted with a 0.5-mm sieve. The whole meal
flour was analyzed for falling number (FN) and then subjected to a
series of RVA tests using AgNO
3
solutions of various concentrations
instead of distilled water. The AgNO
3
concentrations ranged from
0.01 to 12 mM.
Experiment 2. Effectiveness of the selected inactivation treatment.
Samples of sound grain of wheat cultivars Eradu (high-swelling) and
Kulin (low-swelling) were germinated in the laboratory and various
blends of whole meal flour from the sound and germinated grain
were prepared to produce two sets of samples that varied in α-amylase
level; these samples were analyzed for FN. RVA and FSV tests were
conducted in water to assess the relative effects of α-amylase on
these tests. The samples were also analyzed by RVA to test the effec-
tiveness of the selected inactivation treatment from experiment 1.
FSV tests were also conducted with 0.5 mM AgNO
3
, which had pre-
viously been established as an effective treatment to inactivate α-
amylase in this test (Crosbie and Lambe 1993).
Experiment 3. Effect of starch and protein quality on texture of
ramen.
This experiment involved the testing of flour milled from 20
wheat cultivars and one commercial ramen flour. These were ana-
lyzed for FSV and RVA parameters, with and without inactivation of
α-amylase, and farinograph stability. Relationships between the
results from these analyses and the texture of ramen prepared from
the same flours were examined. Other analyses included FN tests on
the 20 wheat samples, and protein and ash determinations on the
flours.
Germination of Grain Samples
Grain samples were germinated as previously reported (Crosbie
and Lambe 1993).
Preparation of Flours
Samples of 20 wheat cultivars were prepared by blending grain
from trials grown in 1996. The samples were blended so as to pro-
duce grain with an average protein content of ≈12.8% to give appro-
priate protein levels in the resultant flours. Cultivars were selected to
include a range of types varying in starch quality and dough strength.
Low-extraction flours (40%) were prepared from the grain
samples using a Buhler laboratory mill. This low-extraction level was
used to produce flour samples comparable with the low-ash flours
used commercially for the manufacture of ramen. This meant, for most
samples, the selection of first reduction flour, but in several cases a
small component of first break flour was also incorporated. A com-
mercial ramen flour from Nippon Flour Mills Co., Ltd., was also
included in the study.
RVA Tests
In experiments 1 and 2, RVA tests were conducted on whole
meal flour. Whole meal (4 g on a 14% moisture basis) was added
to distilled water or AgNO
3
solution (25 mL), stirred, and inserted
into the RVA. The temperature of the RVA was set at 50°C for 1
min, then increased at 12°C/min to 95°C, held at 95°C for 2.5 min,
reduced at 12°C/min to 50°C, and held for 2 min; total time was
13 min. Cannisters coated on the inside with polytetraflouroethyl-
ene were used in tests involving AgNO
3
solution.
In the final experiment, RVA tests were conducted on flour (3.5 g
on a 14% moisture basis), distilled water or 1 mM AgNO
3
solution
(25 mL) using the temperature profile described by Ross et al
(1997). Here, the RVA was set at 65°C for 2 min, then increased at
15°C/min to 95°C, held at 95°C for 6 min, decreased at 15°C/min
to 50°C, and held for 5 min; total time was 18 min.
RVA parameters measured included: peak viscosity (PV), highest
viscosity during 95°C heating stage; holding strength (HS), lowest
viscosity during 95°C heating stage; breakdown (BD), difference
between peak viscosity and holding strength; final viscosity (FV),
highest viscosity during 50°C cooling stage; and setback (SB), differ-
ence between final viscosity and holding strength.
FSV Tests
FSV was determined using the method described by Crosbie et
al (1992) and modified by Crosbie and Lambe (1993).
TABLE I
Means, Standard Deviation (SD), and Coefficients of Variation (CV) for Flour Swelling Volume and Individual Rapid-Visco Analyser (RVA)
Parameters
a
Tested With and Without Treatment to Inactivate α-Amylase
b
Water AgNO
3
Solution
Sample Set Falling No. (sec) Parameter Mean SD CV Mean SD CV
Kulin 161–427 FSV 13.6 0.2 1.2 13.7 0.1 1.0
PV 107 47 44.1 204 6 2.7
BD 57 9 16.0 70 3 4.5
SB 62 38 61.7 134 5 3.6
FV 113 77 68.5 268 7 2.7
Eradu 177–472 FSV 17.7 0.2 0.9 17.9 0.3 1.5
PV 175 60 34.3 295 9 3.0
BD 112 18 16.2 151 6 3.9
SB 65 33 51.7 123 6 4.9
FV 129 76 59.2 267 9 3.3
a
FSV = flour swelling volume; PV = peak viscosity; BD = breakdown; SB = setback; FV = final viscosity.
b
1 mM AgNO
3
used for RVA tests; 0.5 mM AgNO
3
used for FSV tests.
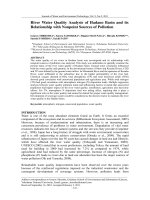
Fig. 3. Relationship between flour swelling volume (FSV) assessed in water
and total texture score.
Vol. 76, No. 3, 1999 331
Farinograph Tests
Farinograph tests were conducted using a 50-g bowl in accor-
dance with Approved Method 54-21 (AACC 1995).
Falling Number, Protein, Ash, and Moisture Tests
Standard methods were used for the analysis of samples for FN,
protein (N × 5.7), and ash by Approved Methods 56-81B, 46-30,
and 08-01, respectively (AACC 1995). Results were calculated on a
14% moisture basis. Moisture was determined in accordance with
Approved Method 44-15A (AACC 1995). All analyses were made in
duplicate.
Noodle Preparation
The methods used for preparing and assessing the noodles were
based on those described in a publication of the National Foods Re-
search Institute, Ministry of Agriculture, Forestry and Fisheries
(1985). These were translated from Japanese to English by Tanaka
and Crosbie (unpublished), copies of which are available from the
senior author. The methods, in a less detailed form, were also des-
cribed by Nagao (1996).
Flour (400 g on a 13.5% moisture basis) was mixed on a Hobart
N-50 dough mixer fitted with a flat beater. A solution containing
analytical-grade potassium carbonate (2.4 g), analytical-grade sodium
carbonate (1.6 g), analytical-grade sodium chloride (4g), and suffi-
cient distilled water (adjusted according to flour moisture content,
equal to 128 g at 13.5% moisture content) was added in a steady
trickle down the side of the mixing bowl within 0.5 min of the com-
mencement of mixing. Mixing profile was 1 min on slow speed, 1
min on medium, and 3 min on slow. The crumb temperature at the
conclusion of mixing was within 24–28°C, achieved, if necessary,
by adjustment of the temperature of the added water
The noodle crumb was sheeted through an Ohtake laboratory
noodle machine with the roll temperature maintained at 25°C through
water circulation. The rolls were adjusted to 9 rpm and the roll
gap set at 3.0 mm. The sheet was folded in half and the two layers
combined by passing again through a 3.0-mm gap. This process was
repeated once. The sheets were rested on plastic rolls for 30 min
(the standard method allows resting from 0–1 hr), wrapped in plastic
film. Subsequent treatment to reduce the sheet to a final thickness
of 1.4 ± 0.05 mm involved reduction ratios more evenly graduated
than those recommended in the established method. This over-
came a frequent problem of noodle sheet overrun at the cutting
stage. The reduction in sheet thickness was achieved by successive
passes through roll gaps of 2.2, 1.6, 1.2, and ≈0.9 mm. The gap
between the rolls for the final pass was determined precisely using
a test piece cut from the main sheet after the previous pass. The
sheet was then passed through a no. 20 cutting roll to produce noodle
strands with cross-sectional dimensions of 1.5 × 1.4 mm. The strands
were cut into 25-cm lengths, dusted with starch, placed in air-tight
plastic bags, and stored for 24 hr in a refrigerator at 5°C.
Noodle Assessment
In previous studies (Miskelly and Moss 1985, Konik et al 1994,
Ross et al 1997), texture has generally been considered in relation to
each of its components (i.e., firmness, elasticity, and smoothness) im-
mediately after or at a fixed time after cooking, and on the same day
the noodles were prepared. In the established Japanese method for
ramen used in the present study, the raw noodles were held for 24 hr
at 5°C before cooking, boiled for 3 min, drained, and assessed twice,
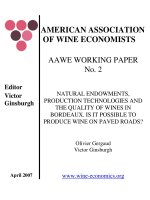
Fig. 4. Relationship between farinograph stability and total texture score.
TABLE II
Analytical Results for 21 Samples of Wheat Flour and Ramen
a
Flour (%) FSV (mL/g)
b
Stability
Water
1.0 mM AgNO
3
Noodle Texture Score
Sample Protein Ash Water AgNO
3
(min)PVBDSBFVPVBDSBFV0 min7 minTotal
c
JR-1 11.2 0.40 17.1 18.2 14.8 191 103 114 202 276 157 137 256 13.5 12.0 25.5
JR-2 11.5 0.38 20.2 21.7 17.5 209 124 96 180 284 173 116 226 12.5 12.8 25.3
JR-3 11.3 0.36 19.3 21.0 5.8 207 120 100 187 284 178 122 227 13.8 13.0 26.8
JR-4 11.1 0.37 17.5 18.7 23.3 175 95 104 184 255 140 137 252 14.0 13.3 27.3
JR-5 10.5 0.37 21.4 22.4 5.0 185 107 92 171 278 171 116 223 12.5 12.0 24.5
JR-6 11.8 0.38 19.0 19.8 8.2 138 92 64 110 264 159 119 225 14.3 13.3 27.5
JR-7 11.5 0.36 16.1 16.7 19.5 183 90 122 215 239 115 141 264 14.5 14.8 29.3
JR-8 11.6 0.38 19.6 20.8 4.5 196 118 89 167 277 171 112 217 12.8 13.3 26.0
JR-9 10.6 0.40 19.3 20.1 10.5 175 98 90 168 258 143 127 241 13.0 13.3 26.3
JR-10 12.2 0.38 17.0 17.5 31.5 225 124 117 218 267 151 135 250 14.5 14.3 28.8
JR-11 11.3 0.32 21.4 22.7 7.4 222 133 97 186 280 178 113 215 12.0 12.0 24.0
JR-12 11.6 0.40 16.9 18.9 11.6 192 100 117 209 247 128 139 257 14.3 14.3 28.5
JR-13 11.5 0.37 20.8 22.9 5.4 220 133 96 182 295 186 118 227 13.0 12.0 25.0
JR-14 11.2 0.38 20.8 22.9 4.7 201 119 90 172 289 176 117 230 12.5 12.5 25.0
JR-15 11.1 0.34 16.9 18.8 11.4 172 92 106 185 261 141 141 261 13.8 13.0 26.8
JR-16 11.0 0.38 17.9 19.3 8.2 193 95 123 221 274 142 151 283 13.8 12.5 26.3
JR-17 11.6 0.40 14.1 15.2 23.9 231 111 143 263 278 140 154 291 14.0 13.8 27.8
JR-18 10.0 0.34 20.1 22.3 7.0 217 135 98 181 312 198 125 240 13.3 12.0 25.3
JR-19 10.9 0.34 14.4 15.2 27.0 215 104 130 241 268 144 141 265 14.3 14.5 28.8
JR-20 11.6 0.37 14.8 16.1 26.8 202 98 133 237 237 116 145 266 14.0 14.0 28.0
Commercial 11.0 0.33 15.1 17.0 18.5 182 95 118 205 238 125 126 239 14.0 14.0 28.0
a
FSV = flour swelling volume; PV = peak viscosity; BD = breakdown; SB = setback; FV = final viscosity.
b
0.5 mM AgNO
3
used for FSV tests.
c
Total score may not equal sum of components due to rounding.
332 CEREAL CHEMISTRY
immediately after boiling (within 2–3 min) and after immersion in
hot water or soup for 7 min. In this method, texture was assessed as a
single score representing a balance of textural properties: springiness,
firmness or hardness, smoothness, and “cutting feel”. The noodles
should ideally be firm, springy, and smooth, and have a clean, non-
sticky cutting feel. Assessments were made by a trained panel of four
people in accordance with the method described by Nagao (1996). The
samples were coded and randomized with the control being the only
sample known to the panel. No communication between panelists was
permitted while the sensory tests were conducted. Noodles made from
the commercial ramen flour served as the control sample in this study.
Samples were scored in relation to the control, which was given a score
of 14 points, or 70% of the maximum 20 points allocated for
texture, at each of the two times of assessment. Total texture score
was the sum of the two scores. The median score of the four panelists
was used in the various statistical analyses.
Statistical Analyses
Statistical analyses were made using Microsoft Excel Version 5.0.
Pearson and partial correlation coefficients were calculated to deter-
mine associations between flour parameters and noodle texture scores.
RESULTS AND DISCUSSION
Effect of AgNO
3
Concentration on α-Amylase in RVA Tests
The rain-damaged wheat sample had a FN of 209 sec. Inactivation
of the α-amylase in this sample was essentially achieved at AgNO
3
concentrations of ≥0.5 mM (Fig. 1). This concentration was higher
than that required for the inactivation of high levels of α-amylase
in the FSV test in which much of the enzyme was heat-inactivated
(Crosbie and Lambe 1993). In subsequent RVA tests, a higher con-
centration of 1 mM was used to allow for the possibility of higher
α-amylase levels in some samples. This concentration was the same
as that used by Bhattacharya et al (1997) to inactivate α-amylase
in RVA studies on Iranian landraces of wheat, but much lower than
the 12 mM solution used in studies by Batey et al (1997).
Effectiveness on Blends of Sound and Germinated Grain
Falling number values of the blends of sound and germinated
grain ranged from 177 to 472 sec for the Eradu sample set and 161
to 427 sec for the Kulin set. The general effectiveness of 1 mM
AgNO
3
as an inactivation treatment for use in RVA tests is
indicated in Fig. 2. Without inactivation, the varying levels of α-
amylase caused substantial variation in the RVA traces for each set
of samples. However, the use of 1 mM AgNO
3
resulted in a much
narrower spread of RVA traces for each set.
The tests confirmed that 1 mM AgNO
3
was effective in nulli-
fying the effect of α-amylase on RVA peak viscosity tests on whole
meal, at FN levels down to at least 161 sec (Fig. 3). Without inacti-
vation, peak viscosity is particularly sensitive to changes in α-amy-
lase at FN levels up to at least 500 sec; this has important impli-
cations in any research where the inherent starch quality is to be
measured. The extreme sensitivity of PV to α-amylase was previ-
ously reported by Ross et al (1997). Close inspection of Fig. 2 shows
that, without inactivation, a sample of the high-swelling cultivar
Eradu with FN ≈ 300 sec could be misclassified as a low-swelling
type because its RVA peak viscosity was similar to that of a sound
sample of the low-swelling cultivar Kulin.
The relative effect of α-amylase on FSV and individual RVA
parameters is indicated by the respective coefficients of variation,
for tests made in water on each of the two sample sets (Table I).
Among RVA parameters, BD gave the lowest coefficient of vari-
ation in water, suggesting that it was the RVA parameter least affected
by α-amylase. FSV had the lowest coefficient of variation of all
parameters measured, confirming the relative insensitivity of this
test to α-amylase (Crosbie and Lambe 1993).
Coefficients of variation were substantially reduced for all RVA
parameters when tests were made in 1 mM AgNO
3
(Table I), again
confirming the importance of α-amylase inactivation in RVA tests
if the prime focus is to measure the inherent pasting properties.
Relationships Between Flour and Noodle Qualities
The wheat samples that were milled to produce 20 of the 21
flours used in this study had FN 408–706 sec. These levels are
normally considered indicative of sound grain containing low levels
of α-amylase. Analytical data on the flours and corresponding
noodle texture scores are presented in Table II.
Protein content of the 21 flour samples was 10.0–12.2%, while
ash levels were 0.32–0.40%. These levels are similar to those quoted
by Nagao (1996) for alkaline noodle flours in Japan (10.5–12.0%
and 0.33–0.38%, respectively). The commercial ramen flour included
in this study contained 11.0% protein and 0.33% ash. The FSV of
the commercial flour, assessed in water, was the fourth lowest
(15.1 mL/g) of the values for the sample set. The PV and BD of
the commercial sample assessed in 1 mM AgNO
3
were the second
lowest and third lowest of the sample set (238 and 125 RVU, res-
pectively). Dough stability of the trial samples varied widely, while
that of the commercial flour was within this range (18.5 min). The
texture of the boiled noodles prepared from the trial samples also
varied widely, with only four samples exceeding the total quality score
of the commercial flour (28.0 total texture score).
Correlations between RVA parameters and texture scores of alka-
line noodles were improved by the use of AgNO
3
(Table III). This
was consistent with the findings of Ross et al (1997), who reported
improvement when Na
2
CO
3
solution, which inactivated α-amylase,
was used. Greatest improvement occurred with PV. When assessed
TABLE III
Pearson Linear and Partial Correlation Coefficients Between Flour Pasting and Swelling Parameters and Ramen Texture Scores
Texture Score
Water AgNO
3
Solution
a
Test Measurement 0 min 7 min Total 0 min 7 min Total
Pearson correlation coefficient
Peak viscosity (PV) −0.21 −0.08 −0.14 −0.58** −0.74** −0.71**
Breakdown (BD) −0.57**
b
−0.49* −0.56** −0.69** −0.77** −0.78**
Setback (SB) 0.51* 0.52* 0.55** 0.71** 0.49* 0.63**
Final viscosity (FV) 0.41 0.46* 0.47* 0.65** 0.46* 0.59**
Flour swelling volume (FSV) −0.80** −0.77** −0.83** −0.80** −0.79** −0.85**
Partial correlation coefficient, holding farinograph stability constant
Peak viscosity (PV) −0.46* −0.34 −0.43 −0.64** −0.62** −0.57**
Breakdown (BD) −0.54* −0.45* −0.55* −0.49* −0.60** −0.62**
Setback (SB) 0.13 −0.05 0.12 0.53* 0.11 0.35
Final viscosity (FV) 0.01 0.00 0.00 0.45* 0.10 0.31
Flour swelling volume (FSV) −0.64** −0.50* −0.63** −0.64** −0.53* −0.66**
a
1 mM AgNO
3
used for Rapid-Visco Analyser (RVA) tests; 0.5 mM AgNO
3
used for flour swelling volume (FSV) tests.
b
* and ** = P ≤ 0.05 and 0.01, respectively.