Báo cáo "Investigation of zinc oxide thin film by spectroscopic ellipsometry " ppt
Bạn đang xem bản rút gọn của tài liệu. Xem và tải ngay bản đầy đủ của tài liệu tại đây (137.16 KB, 8 trang )
VNU Journal of Science, Mathematics - Physics 24 (2008) 16-23
16
Investigation of zinc oxide thin film
by spectroscopic ellipsometry
Nguyen Nang Dinh
1∗
,
Tran Quang Trung
2
,
Le Khac Binh
2
, Nguyen Dang Khoa
2
, Vo Thi Mai Thuan
2
1
College of Technology, VNU, 144 Xuan Thuy, Hanoi, Vietnam
2
University of Natural Sciences, Vietnam National University Ho Chi Minh City,
227 Nguyen Van Cu, 5 District, Ho Chi Minh City, Vietnam
Received 4 January 2008; received in revised form 26 March 2008
Abstract. ZnO films were deposited on glass substrates by magnetron RF-sputtering. An accurate
determination of the optical constants of these films is extremely important prior to its application
in optical devices and spectroscopic ellipsometry provides a reasonably accurate method for the
determination of optical constants of thin films. In this study, we present the results gained by
analyzing spectroscopic ellipsometry of ZnO thin film combined with comparison of transmission
spectroscopy measured on a UV-VIS-NIR spectrophotometer. Ellipsometry data have been fitted
with a model including a glass substrate and a ZnO film plus a surface void layer on top. From this
fitting the refraction index (n), extinction coefficient (k) and thickniess (d) of the sputtered ZnO
films were determined. By using the gained n, k and d values the transmission spectrum was
theoretically calculated and compared with the experimentally obtained transmission one. As a
result of the combined spectroscopic ellipsometry and transmission analysis, there was the good
correlation in comparison.
Keywords: Thin film, ellipsometry, transmission spectrum, refraction index, extinction coefficient.
1. Introduction
Although ellipsometry theory was well-known for a long time ago, until 70s of the XX century
ellipsometry has not been commonly used, because of its sophisticated mathematical technique. Since
the computer science has strongly developed, ellipsometer systems become popularly used in
laboratories for characterisation of materials, and for optic thin films in particular.
The theory for ellipsometric analysis is based on the change in the polarization state of light
when the light transmits or reflects from an optic sample. In both the case of a single layer and a
multilayer of the thin film which are coated on a glass substrate, after the transmision and/ or
reflection through/ from the sample, the light is polarized depending on the thickness and the
refraction index of the film. From the ellipsometry spectra of the samples one can find out the
optic constants and optical properties of the films.
This work presents new investigation results on zinc oxide (ZnO) thin film deposited on glass
substrate by using spectroscopic ellipsometer with a wavelength range from 350 nm to 1100 nm. The
______
∗
Corresponding author. E-mail:
Nguyen Nang Dinh et al. / VNU Journal of Science, Mathematics - Physics 24 (2008) 16-23
17
measured ellipsometric data are fitted with theoretical spectra generated assuming appropriate models
regarding the sample structures. The fitting has been done by minimizing the squared difference (χ
2
)
between the measured and calculated values of the ellipsometric parameters (ψ and ∆) and accurate
information has been derived regarding the thickness and optical constants of the different layers.
2. Experimental
ZnO films were deposited on glass substrates by a magnetron Rf-sputtering. A ZnO ceramic
target with diameter of 75 mm was used. The sputtering pressure of the Ar/O
2
mixture gases was
maintained at P = 8 x 10
-3
Torr, the density of the sputtering current was kept at I ≈ 60 mA/cm
2
with
the bias voltage of V = 350 V. The deposition time was of about 70 min and the average deposition
rate was evaluated as 1.5 Å/s.
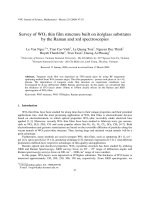
The ellipsometric measurement is normally expressed in terms of a polarization angle Ψ [1, 2],
as follows:
∆
tan Ψ ρ
p
i
s
r
( )e
r
= =
(1)
where ρ is the complex ratio as a function of wavelength, ∆ = δ
p
- δ
s
is the phase difference (as well as
an amplitude ratio), r
p
and r
s
are the complex Fresnel reflection coefficients of the sample, respectively
for p- (in the plane of incidence) and s- (perpendicular to the plane of incidence) polarized light, as
shown in Fig. 1.
Fig. 1. Schematic diagram of ellipsometer system.
The ellipsometric spectra were measured in a spectroscopic phase modulated ellipsometer
(Model UVISEL HR 460, Jobin – Yvon) in the wavelength range from 280 nm to 1700 nm. On this
measurement system, the modulated signal to detector takes the general form as follows:
I(t) = I[I
o
+ I
s
sinδ(t) + I
c
cosδ(t)] (2)
where I
o
, I
s
, I
c
are complicated trigonometry functions related to the measurement conditions (e.g. the
angle of polarization mirrors and modulators) and parameters of film (∆, Ψ). The measurement
configuration is chosen for the purpose of simplifying the calculation of trigonometry functions. In the
present set of measurement, M = 0
o
, P = 45
o
, A = 45
o
, so that,
s
Ψ
Ψ
ϕ
ϕ
o
o
∆
∆
1
-
Line
arly
polarized light
2 - Reflect off sample
3
-
Elliptically
polarized light
p
Nguyen Nang Dinh et al. / VNU Journal of Science, Mathematics - Physics 24 (2008) 16-23
18
I
o
= 1 (3)
I
s
= sin2Ψsin∆ (4)
I
c
= sin2Ψcos∆ (5)
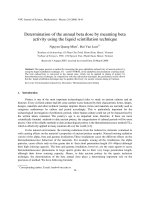
Ellipsometric data have been analyzed by Delta Psi software (Jobin – Yvon Co.). Fig. 2 shows
ellipsometer spectra I
s
(λ), I
c
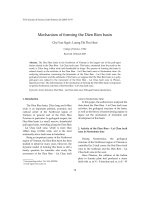
(λ) of a ZnO film. Transmission spectra of the sample were measured on a
Jasco. UV-VIS-NIR V530 spectrophotometer, in a wavelength range from 190 nm to 1100 nm (Fig.
3). From the transmission spectra, one can note that the ZnO spectrum quite appears in the same
transparent region of the substrate. This means, the glass substrate did not affect to the shape of
transmission spectrum of coated ZnO film. From this spectrum one can also determine the optical
band gap (E
g
) of the zinc oxide film which was found to be E
g
≈ 3.33 eV.
Fig. 2. Polarized spectra of ZnO sample, with I
s
= sin2Ψsin∆ (a) and I
c
= sin2Ψcos∆ (b).
Fig. 3. Transmittance spectra of glass substrate and ZnO film.
a
.
b.
Nguyen Nang Dinh et al. / VNU Journal of Science, Mathematics - Physics 24 (2008) 16-23
19
3. Results and discussion
3.1. Modeling and fitting I
s
, I
c
spectra
Ellipsometry does not directly measure film thickness or optical constants; it measures the
changes in polarization expressed as Ψ and ∆ [4]. To extract useful information about a material
structure, it is necessary to perform a model dependent analysis of ellipsometric data.
A model for the optical structure of the sample was designed with initial estimates of the
parameters. Initially, we have started with the simplest model; it included a glass substrate and a single
film on the surface. By regularly increasing complexity, we have constructed more complicated
model, for instant, increasing the amount of possible films or the possible elements exist in film
structure, predicting different thicknesses, changing the kind of substrate material. Through these
steps, we finally could find out the best model which has the most suitable structure in compare with
the real sample. The initial guesses of the model parameters were transformed finally into true
parameters of the sample, such as thickness and optical constants.
In the process of fitting parameters of model and sample, by using the Marquardt – Levenberg
algorithm [5] one can get the difference between the experimental values (from the measurement) and
calculated values (from the model).
The Mean Square Error (MSE) χ
2
is used to qualify the difference between the experimental
and predicted data.
(
)
∑
=
σ
−
=χ
N
1i
2
i
2
ii
2
ThMes
N
1
(6)
where σ
i
is the standard deviation of the i
-th
data point
N is the number of data points
Mes
i
is the i
-th
experimental data point
Th
i
is the i
-th
calculated data point from assumed theoretical model
MSE is different in each model. A smaller MSE implies a better model fit to the data. MSE will
exhibit a minimum value when the model matches the experimental data as closely as possible.
Fig. 4. The first fitting model of ZnO sample.
Nguyen Nang Dinh et al. / VNU Journal of Science, Mathematics - Physics 24 (2008) 16-23
20
From the measurement I
s
, I
c
spectra were plotted as a function of wavelength. Next, a model for
the optical structure of the sample have been constructed. This first model included a glass substrate
and a single film ZnO on surface with 1000 nm predicted thickness (Fig. 4). The fitting results of
model 1 have been presented in Fig. 5 and Table 1. With this model the MSE has been found to be of
133.6, this means that by model 1 there was a big difference between the measured I
s
, I
c
spectra with
the calculated I
s
, I
c
spectra.
Fig. 5. Measured data (dark curve) and simulated data (light curve) of ZnO sample in model 1 for Is (a) and Ic
(b). In this case, it was hard to accept this model.
3.2. Comparison of theoretical and experimental transmission spectra
To evaluate the results from analyzing polarized spectra there was a comparison between the
calculated transmission spectrum and the experimental transmission spectrum. By applying the
algorithm from [6] we have used fitted ellipsometric data (n, k, d) to calculate the transmission
spectrum of ZnO sample. After that, we have made a compare between this calculated spectrum and
the measured spectrum of ZnO sample. Fig. 6 shows the difference of these two spectra, one is the
transmission spectrum calculated from resulting fit parameters, which have gained from analyzing I
s
,
I
c
spectra (calculated spectra), in model 1 and another is the transmission spectrum measured from
experiments (measured spectrum).
It shows that the model did not adequately represent the true structure, the model needed to be
reformulated.
a. b.
Nguyen Nang Dinh et al. / VNU Journal of Science, Mathematics - Physics 24 (2008) 16-23
21
Fig. 6. Measured and calculated transmittance spectra in Model 1.
3.3. Bruggeman effective medium approximation (EMA) model
In the case of composite layers, consisting of more than one material, or material(s) and void,
the calculation for the effective optical constants have been done using EMA model, which describes a
composite of aggregated phases or random mixture microstructure. Dielectric function ε of the
composite is described by the follow equation:
ε ε
0
ε 2ε
i
i
i
i
f
−
=
+
∑
(7)
where ε
i
is the dielectric function of i
th
component in the composite.
f
i
is the volume fraction for i
th
component in the composite.
Fig. 7. The second fitting model of ZnO sample.
In the second fitting, we have assumed a new model by adding a surface void layer to the ZnO
film, called model 2. To model this additional layer we have used BEMA with a 50 – 50% mixture of
ZnO and void, layer thickness has been predicted about 20nm (Fig. 7). The fit results for a more
Nguyen Nang Dinh et al. / VNU Journal of Science, Mathematics - Physics 24 (2008) 16-23
22
complex model are shown in Fig. 8 and Table 1. And the resulting fit MSE was χ
2
= 7.2; it was
reduced by an order of magnitude. Additionally, in model 2 the calculated spectra I
s
, I
c
were well
matched with experimental spectra. This shows that model 2 is much better than model 1 for getting a
good agreement in fitting.
Fig. 8. Measured data (dark curve) and simulated data (light curve) of ZnO sample in model 2. for Is (a)
and Ic (b). The second model is in good agreement with the experimental data.
Table 1. The resulting fit parameters of constructed models
Model
χ
2
Parameters
1. Without void 133.6
d
ZnO(a)
= 1168.0 ± 17.8nm
2. Void on top 7.2
d
ZnO(a)
= 1039.5 ± 45.1nm; d
void ZnO(a)
= 23.2 ± 2.1nm
%ZnO void = 65.0 ± 3.4
There was a good match between the calculated and measured transmission spectra (Fig. 9).
The minimum and maximum wavelength values of interference fringes were well fit. From that, model
2 and its fit parameters are acceptable, in good agreement with the true structure of the sample.
Besides MSE (χ
2
), thickness and mixture ratio, the fitting results also gave the dependence of
refractive index n and extinction coefficient k on wavelength of ZnO film, illustrated in Fig. 10.
The ZnO film refractive indices in the wavelength range of 500 nm – 1100 nm were found to be
from 1.94 to 1.85. The extinction coefficient k equals to zero for wavelengths greater than 500 nm and
suddenly increased higher in the range from 350 nm to 500 nm, this corresponds to an absorption edge
which the transmission spectrum obtained.
a.
b.
Nguyen Nang Dinh et al. / VNU Journal of Science, Mathematics - Physics 24 (2008) 16-23
23
Fig. 9. Measured and calculated transmittance spectra
in model 2.
Fig. 10. The wavelength dependence of reflective
index n and extinction coefficient.
4. Conclusions
ZnO films, deposited on glass substrate by magnetron sputtering process, have been analyzed
based on spectroscopic ellipsometry in compare with transmission spectroscopy from a UV-VIS
system. Ellipsometry data have been fitted with a model including a glass substrate and a ZnO film
plus a surface void layer on top. From this fitting the refraction index (n), extinction coefficient (k)
and thickness (d) of the ZnO films were determined. By using the gained n, k and d values the
transmission spectrum was theoretically calculated and compared with the experimentally obtained
transmission one. As a result of the combined spectroscopic ellipsometry and transmission analysis,
there was the good correlation in comparison.
Acknowledgements. The National Program for Basic researches in Natural Science of Vietnam is
acknowledged for providing financial support in 2007 (Project No. 410306).
References
[1] H.G. Tompkins, W.A. McGahan, Spectroscopic Ellipsometry and Reflectometry A User’s Guide, A Wiley-Interscience
Publication 1999.
[2] R.M. A Azzam, N.M. Bashara, Ellipsometry and Polarized Light, North Holland Press, Amsterdam, Fourth Impression
1999.
[3] O.S. Heavens, Optical Properties of Thin Solid Films, Dover Publication, Inc, New York 1991.
[4] B. Johs, J.A. Woollam, C.M Herzinger, J. Hilfiker, R. Synowicki, C.L Bungay. Overview of VASE, Part I: Basic Theory
and Typical Applications; Overview of VASE, Part II: Advanced Applications, SPIE Proc. CR72 29 1999.
[5] G.E. Jellison. Spectroscopic ellipsometry data analysis: measured versus calculated quantities, Thin Solid Films 313-
314 (1998) 33.
[6] R. Swanepoel, Ellipsometry data for some thin film samples, J. Phys. E: Sci. Instrum., 16 (1983) 1215.
[7] Jobin-Yvon, Horiba Group Ellipsometry Presentation 2001.