Báo cáo " Eutrophycation assessment and prediction of Bay Mau Lake using mathematical models " doc
Bạn đang xem bản rút gọn của tài liệu. Xem và tải ngay bản đầy đủ của tài liệu tại đây (188.03 KB, 6 trang )
VNU Journal of Science, Earth Sciences 23 (2007) 116-121
116
Eutrophycation assessment and prediction
of Bay Mau Lake using mathematical models
Luu Lan Huong*, Trinh Thi Thanh, Nguyen Thi Thanh Nga
College of Science, VNU
Received 22 December 2006
Abstract. The lake ecosystem of Hanoi has a very important role. However, the water quality in the
lakes of Hanoi is declining; they're more and more polluted. Among that, eutrophication is the
most popular one. Therefore, the assessment and prediction of eutrophication is necessary. One of
the effective tools for assessing and predicting eutrophycation is the use of mathematical models. In
this paper, we used the Vollenweider model, empirical watershed model and Jorgensen model to
determine the eutrophycation of Bay Mau Lake by phosphorous concentration in the lake water.
The results show that Bay Mau Lake is being heavy eutrophication, soluble phosphorus
concentration is very high (4.56-7.56mg/l), other phosphorus concentrations is increasing. We had
treated phosphorus concentration of sewage before loading to the lake. When Cpl decreases up to
90%, the content of PS fluctuates between 0.49 and 0.9mg/l. This value is much higher than the
allowable limit (0.03mg/l). The results of this paper can serve as a base for developing a strategy for
protection and sustainable use of valuable water resource.
Keywords: Eutrophycation; Lake ecosystem; Mathematical models; Bay Mau Lake.
1. Introduction
*
In the recent years, Hanoi’s economic
growth rate has increased substantially. The
development, on the other hands, causes many
consequences. One of these is that the pollution
of the lake ecosystem has increased at an
alarming level and the water quality has been
declining. Among those, eutrophycation is the
most popular.
Eutrophycation is a phenomenon caused by
excess of nutrients, mainly nitrogen and
phosphorus, which is reflected in the booming
of living algae, particularly the phytoplankton.
_______
*
Corresponding author. Tel.: 84-4-5584921.
E-mail:
This phenomenon often happens with increasing
speed. In the most serious condition, the lake
ecosystem is destroyed, the aquatic organisms
cannot survive and the lake is dry.
Therefore, the assessment and prediction of
eutrophycation is necessary. One of the
effective tools for these purposes is the use of
mathematical models.
2. Research objects and methodology
2.1. Research objects
Bay Mau Lake is located in Lenin Park at
the centre of Hanoi. The main function of the
lake is to make the rainfall equable. In addition,
it is a place for entertainment and improving
Luu Lan Huong et al. / VNU Journal of Science, Earth Sciences 23 (2007) 116-121
117
local microclimate. It can be self-cleaning, thus
it can use to raise fish and receive sewage that
has been treated at a suitable level.
2.2. Research methodology
- Apply Vollenweider model to determine
standard amount of phosphorus loading to the
lake annually.
- Use the empirical watershed model and
the eutrophycation model of Jorgensen to
calculate the supplement of nutrients from the
basin and compare with standards to determine
the lake nutritional condition.
- Analyze the dynamic of phosphorus by
exchanging phosphorus model of Jorgensen.
- Compare the results with observed data.
3. Research results
3.1. Estimating the nutritional state by
phosphorus parameter
3.1.1. Calculating the maximum mass of phosphorus
by Vollenweider model
Vollenweider model is showed by the
following formula:
M = 10
-9
L
c
A,
where M: allowable mass of phosphorus
(tons/year); A: lake's area (m
2
); L
c
: allowable mass
of phosphorus per square meter of lake's surface:
Lc = 10 q [q+
q
z
] (mg/m
2
.year), q = Q/A,
Q: annual water volume discharged into
lake; Z: lake's average depth (meter).
With A = 18ha, Z = 2.5m, Q = 5331290m
3
, we
have Lc = 317.361mg/m
2
.year and M = 66.84kg.
3.1.2. Calculating the amount of phosphorus loading
to the lake
3.1.2.1. Using empirical watershed model
To calculate, we applied technological
standards of OECD and Loer [1]. The main
sources of phosphorus include:
1) Diffuse sources:
- The amount of P loads from basin (P1) is
related to the type of land, land use and
intensive cultivation of agricultural land.
- The amount of P loads from precipitation
is associated with rainfall and lake's area (P2).
- The amount of P loads from residential
area (P3).
Empirical watershed model is shown by the
following equation:
A = a
0
+ a
1
X
1
+ a
2
X
2
+ + a
n
X
n
,
where: A is the total amount of nutrients loading
from basin; X
1
,X
2
, ,X
n
: areas of the forms of land
use and the land use methods 1, 2, ,n; a
1
,a
2
, ,a
n
:
exporting coefficients of phosphorus.
2) Point sources: the amount of P from
sewage (P4).
In the case of Bay Mau Lake, the annual
precipitation is 1813mm according to National
Hydro-Meteorological Service of Vietnam [2],
the phosphorus concentration in rain water is
0.025 - 0.1mg/l, lake's area is 18 hectares, the
population is 51814 people, the average
phosphorus concentration of sewage is
6.206mg/l, the total waste water from sewage is
2,920,000m
3
. Thus, the amount of phosphorus
can be calculated by empirical watershed
model: P = 18863 - 19492kg.
3.1.2.2. Using Jorgensen model
There are 3 phosphorus sources in
Jorgensen model, namely:
- The amount of P loads from land (P1);
- The amount of P loads from precipitation
(P2);
- The amount of P loads from residential
area (P3).
In the case of Bay Mau Lake, the annual
precipitation is 1813mm, the phosphorus
concentration in rainwater is 0.025 - 0.1mg/l, lake's
area is 18 hectares, basin area is 115 hectares,
and the population is 51814 people. Based on
these numbers, we have calculated the total
amount of phosphorus: P = 6261 - 14164kg/year.
3.1.3. Calculating the content of total phosphorus
From the results of phosphorus source
Luu Lan Huong et al. / VNU Journal of Science, Earth Sciences 23 (2007) 116-121
118
discharged into the lake, we can calculate
phosphorus concentration. The accessing
phosphorus content model is shown by the
following equation:
TP = (L
P
/q
s
)/(1+ tw ),
where TP: average content of total phosphorus;
L
p
: amount of phosphorus per square meter,
Lp = J/A;
J: total phosphorus loaded to the lake
annually;
A: lake's area
q
s
: annual fluctuation of water (m/year), q
s
=
Z/tw;
Z: average depth;
V: lake's volume (m
3
);
Q: inflow (m
3
);
tw = V/Q.
- Estimating content of phosphorus based
on the amount of phosphorus loading to the
lake calculated by empirical watershed model:
Q = 5163530m
3
, J=18863 - 19492kg, A = 18ha, L
P
=
104794 - 108294mg/m
2
.year, Z = 2.5m, V =
800000m
3
, tw = 0.155, q
s
= 16.13; we have TP =
9.055 - 9.35mg/l.
- Estimating content of phosphorus based on
the amount of phosphorus calculated by
Jorgensen model: Q = 5163530m
3
, J =6261 -
14164kg, A = 18ha, L
P
= 34785 - 78689mg/m
2
.year,
Z =2.5m, V = 800000m
3
, tw = 0.155, q
s
= 16.13; we
have TP = 3.005 - 6.799mg/l.
3.1.4. Estimating eutrophic state of Bay Mau Lake
by phosphorus parameter
By using phosphorus indicator, there are
two ways to assess the eutrophycation. The first
one is to compare the total amount of
phosphorus discharge into the lake annually
with standards specified by Vollenweider
model; the second one is to use eutrophic
measurement for phosphorus concentration in
the lake.
3.1.4.1. Estimating eutrophic state by the total
amount of phosphorus load
We used empirical watershed model and
Jorgensen model to calculate the total amount
of phosphorus load. By Jorgensen model, the
amount of P load is 93 - 211.9 times higher than
the allowable level. By the empirical watershed
model, the amount of P is 282 - 292 times higher
than the allowable level. It shows that the
ability of eutrophycation of Bay Mau Lake is
very high.
3.1.4.2. Estimating eutrophic state by
phosphorus concentration
From the two above models, the content of
phosphorus in the lake exceeds allowable
standards (0.03 mg/l) many times [3]. Therefore,
we can conclude that Bay Mau Lake is over
eutrophic.
Also, according to research results, the two
models have given different results, in which
Jorgensen model is more exact in approximating
the fluctuation of phosphorus in the lake (4.68 -
7.56) [4].
3.2. Assessment and prediction of Bay Mau
Lake eutrophycation by Jorgensen exchanging
phosphorus model
3.2.1. Jorgensen exchanging phosphorus model
This model is aimed to define nutrition
resources, predict nutrient concentration and
eutrophic process. This helps us to find the
ability of eutrophycation and propose measures
for environmental managers to choose and
make decisions. The model was recognized and
is used in 3 specific cases [5].
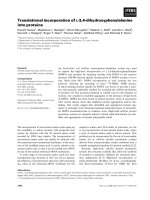
The model has 7 state variables: PS: Soluble
phosphorus, PC: phosphorus in algal cells, PD:
phosphorus in detritus, PE: Exchangeable
phosphorus in sediment, PI: phosphorus in
interstitial water, PB: phosphorus released
biologically from sediment, Pzoo: Proportion of
phosphorus in fish (Fig. 1).
3.2.2. Results
The model was considered in different
cases and simulated by Stella II software [5].
Luu Lan Huong et al. / VNU Journal of Science, Earth Sciences 23 (2007) 116-121
119
KD.PD
P-Precipitation
CA
PCCFZ
µ
(
F
1
)
CA
PCCZZ
µ
P-Basin
Control growth of
Phytoplankton
PD
PB
QDSORP
PS PC
QDIEF
Min (SA.PC, k)
f
PDSA .
f
PCSA .
PE
QBIO
SA.PC
PI
P-Sewage
PE.KE
Pzoo
Fig. 1. The Jorgensen exchanging phosphorus model.
3.2.2.1. Model 1
Model 1 simulates the dynamic of PB, PC,
PD, PE, PI, PS, Pzoo in 12 months. The results
are shown in figures 2 and 3. Based on these
results, we have some comments as follows:
- The content of PS: varies significantly over
time. From January to April and from October
to December, PS increases up to high value, but
from May to September, PS declines. Its value
fluctuates between 4.07 and 8.19mg/l, strongly
exceeds allowable standards. It proves that the
lake is in high eutrophic condition. This value is
approximate with PS measured in fact from
4.56 to 7.56mg/l [4, 6], shows that results of the
model can be accepted.
- The content of PC: based on the graph, the
content of PC gradually rises from February to
July, and reaches maximum in July. From August
to November, the content of PC slowly decreases.
Then, the content of PC continues increasing
because over nutrient recovers phytoplankton
mass. Simulation result shows correlative
fluctuation between PC and phytoplankton mass.
- The content of Pzoo: alters over time,
comparing to change of PC shows that the
vibration amplitudes of zooplankton and
phytoplankton are the same. But they are
contrary, it means that if the content of PC
increases, the content of Pzoo decreases. It
clearly illustrates Lotka-Voterra’s principle.
- The content of PD: also changes over time
but very slow. PD is higher from June to
September.
- The content of PE: regularly increases over
time, especially in winter. However, the increased
amount is marginal, about 0.00167mg/l/month.
- The content of PiN: regularly increases
over time but slow (about 0.00083mg/l/month).
The increase of PiN can be resulted by the
increase of PE.
- The content of PB: regularly increases over
time, its growth is higher than PE and PiN,
about 0.0042mg/l/month. This process has
provided significant amount of phosphorus to
make the lake more eutrophic.
3.2.2.2. Model 2
This model simulates the dynamic of PS
with the assumption that phosphorus
concentration of sewage (Cpl), which has been
treated, decreases 50%, 75%, 90% before
Luu Lan Huong et al. / VNU Journal of Science, Earth Sciences 23 (2007) 116-121
120
discharging into lake. The result is represented
in Fig. 4.
Table 1 represents the relationship between
decrease of Cpl (%), PS (%) and PS’s content.
According to Table 1, the decrease of Cpl and
PS are approximate. It proves that the
phosphorus loads from sewage plays an
important role for PS. When Cpl decreases up to
90%, the content of PS fluctuates between 0.49
and 0.9mg/l. This value is still much higher than
allowable standard (0.03mg/l). Therefore, to
reduce the content of PS below 0.03mg/l, we
should perform a waste water treatment in
combination with other methods.
Fig. 2. Dynamic of PC, PD, PS, Pzoo in 12 months.
Fig. 3. Dynamic of PB, PE, PiN in 12 months.
Table 1. Decrease of Cpl, PS, and content of PS
Decreases of Cpl (%) 50 75 90
Decreases of PS (%) 48.89 - 49.53 73.46 - 74.16 87.96 - 89.01
Content of PS (mg/l) 2.08 - 4.14 1.08 - 2.12 0.49 - 0.9
Luu Lan Huong et al. / VNU Journal of Science, Earth Sciences 23 (2007) 116-121
121
Fig. 4. Dynamic of PS content when Cpl decreases:
1 - non-decrease, 2 - decreases 50%, 3 - decreases 75%, 4 - decreases 90%.
4. Conclusions
- Results obtained from mathematical
models of total phosphorus amount and
phosphorus concentration in Bay Mau Lake
show that the lake contains too much
phosphorus. Phosphorus loading in fact is
hundreds times higher than the allowable level.
Compared to empirical watershed model, the
Jorgensen model gives better result, which is
closer to the measured data.
- Jorgensen phosphorus exchanging model
reflects theoretical rules relating to the lake's
ecosystem. The result of this model is close to
the fact. The content of PS exceeds allowable
limit. The content of other types of phosphorus
increases over time. Phosphorus in the lake is
increasing.
- When phosphorus concentration of sewage
decreases up to 90%, the content of PS fluctuates
between 0.49 and 0.9mg/l. This value is still
much higher than allowable standard (0.03mg/l).
Therefore, to reduce the content of PS below
0.03mg/l, we should perform waste water
treatment in combination with other methods.
- Analyses above demonstrate that the
results of models are reliable and can apply to
other lakes.
References
[1] B. Hannon, M. Ruth, Modeling Dynamic Biological
Systems, Springer-Verlag, New York, 1997.
[2] National Hydro-Meteorological Service of
Vietnam, The report on climate of the monitoring
station in Northern part of Vietnam, Scientific
and Technical Hydro-Meteorological Journal No.
2(2005) - No. 1(2006) 56 (in Vietnamese).
[3] N.X. Nguyen, T.D. Ha, Quality of river and lake
water and environmental protection of the water,
Publishing House of Science and Technology,
Hanoi, 2004 (in Vietnamese).
[4] H.T. Hai et al., Preliminary assessment of external
nutrient Nitrogen and phosphorous discharged into
Ba Be Lake, Institute of Ecology and Biological
resources, 2001 (in Vietnamese).
[5] S. E. Jorgensen, Application of Ecological Modeling
in Environment Management, part A, Elsevier
Scientific Publishing Company, Amsterdam, 1983.
[6] Centre for Environmental Technology and
Industrial Area (CETIA), Hanoi University of
Construction, Report of research project
"Assessment of water quality change of 5 lakes after
improving and promoting treatment methods",
Hanoi, (2005) 40 (in Vietnamese).