Livewell: a balance of healthy and sustainable food choices potx
Bạn đang xem bản rút gọn của tài liệu. Xem và tải ngay bản đầy đủ của tài liệu tại đây (4.67 MB, 64 trang )
a balance of healthy and
sustainable food choices
Livewell:
THIS REPORT HAS
BEEN PRODUCED IN
COLLABORATION
WITH:
Climate change Conservation Sustainability
THIS REPORT HAS
BEEN PRODUCED IN
COLLABORATION WITH:
JANUARY
2011
REPORT
Livewell Report 2011
2
Livewell:
a balance of healthy and sustainable food choices
Commissioned by WWF-UK
Authors:
Dr Jennie Macdiarmid
Dr Janet Kyle
Dr Graham Horgan
Mrs Jennifer Loe
Miss Claire Fyfe
Dr Alex Johnstone
Professor Geraldine McNeill
Livewell Report 2011
3
CONTENTS
FOREWORD 5
EXECUTIVE SUMMARY 8
KEY POINTS 10
1. BACKGROUND 11
2. PROJECT BRIEF 12
3. THE DIET OF THE UK POPULATION 14
3.1 Dietary intakes in the UK 14
3.2 Comparison of the UK diet with the Eatwell plate 17
3.3 Greenhouse gas emissions from the UK diet 23
4. Greenhouse gas emission targets for 2020 and 2050 27
4.1 Food-related greenhouse gas emission targets for 2020 and 2050 27
4.2 Methodology: Linear programming to optimise the diets to meet dietary recommendations
and minimise greenhouse gas emissions 28
5. Livewell 2020: healthy and sustainable diet for 2020 30
5.1 Livewell 2020 diet 31
5.2 Livewell 2020 plate 37
5.3 Transferability of Livewell 2020 to other populations and cultures 43
6. Diets for 2050 40
7. Summary 41
Livewell Report 2011
4
8. Uncertainties and limitations of the GHGE data 43
9. Other considerations for a sustainable diet 44
9.1 Broader environmental issues 44
9.2 Economic and ethical issues 48
10. Public health message for a sustainable, healthy diet 50
11. Recommendations for future work 51
12. References 52
13. Appendices 55
Appendix 1: The type of food included in each of the five Eatwell plate food groups 55
Appendix 2: NDNS food groups and allocation to the Eatwell food groups 55
Appendix 3: The contribution of different food in the NDNS to each Eatwell plate food group 59
Appendix 4: Food groups included in the database with upper and lower limits imposed on the amount of
certain food in the Livewell 2020 model 61
Appendix 5: List of food items when no upper or lower limits are imposed on the amount of individual
food in the diet 62
Appendix 6: Micronutrient content of the Livewell 2020 diet 63
Appendix 7: Ingredients in the composite meals in the Livewell 2020 sample menu 63
Livewell Report 2011
5
FOREWORD
In January 2009 WWF-UK launched its One Planet Food programme, which aims to reduce the
environmental and social impacts of food consumption in the UK. We work across the food chain to
reduce greenhouse gas emissions (GHGEs), protect biodiversity and reduce the impact of food on finite
water resources. The aim has always been to move away from unsustainable food choices, towards
sustainable ones that support global agriculture and biodiversity.
Since 1960 the world’s population has doubled, increasing the demand for food and impacting on the
climate and our ecosystems. Agriculture is one of the direct drivers in the growth of GHG emissions,
with livestock being a significant contributor. There are also indirect impacts, not least due to
growing food to feed livestock, such as poultry and dairy cattle. This has led to vast swathes of
biodiversity-rich areas, such as the Cerrado in Brazil, being cleared. This causes deforestation and soil
erosion, and requires oil-based fertilisers and pesticides.
Around 70% of all agricultural land is used to grow crops for livestock, a result of an increase in meat
consumption (the average person in the UK now eats 79kg of meat per year). Agriculture on this scale
requires massive amounts of water, and accounts for 8% of the global water supply. If current
agricultural trends continue, the impacts will become more severe and increasingly unsustainable. This
will be exacerbated by population growth and demand for biofuels.
According to the UN Food and Agricultural Organisation,
1
we each consume around 3,500 calories per
day in the UK, which is 1,000 too many. We tend to overeat the food which has the greatest impact on
our health and on the environment. This growth in our Western diet – one that’s high in meat, dairy and
processed food – has been a recent phenomenon (our grandparents didn’t eat like this), and it has
occurred at the same time as a growth in Western diseases such as obesity, Type 2 diabetes and heart
disease. There is also a huge imbalance in the food system: 1.2 billion people suffer from hunger and
malnutrition, while more than 1.2 billion are overweight or obese.
Before working on consumption, WWF looked at the existing advice about food choices. We saw that
this was already a very crowded area and we didn’t want to add to the maelstrom of information. We
had already noticed that the environmental ’hotspots’ had much in common with the health ones. In an
attempt to bring some of these messages together, we decided to look at current governmental eating
advice – the Eatwell plate – and to see how it could be adapted to include the environment. The idea
was to produce a definition of a sustainable diet that is nutritionally viable – what we call our Livewell
plate; a diet that’s good for both people and the planet.
We are working with the Rowett Institute of Nutrition and Health at the University of Aberdeen, which
has expertise and extensive experience in food group and nutritional analysis and design, and in
developing healthy and specialist diets. This report maps current eating habits and compares them with
UK government dietary advice. By following government dietary recommendations we would take a
significant step towards a low-carbon diet.
We asked Rowett to look ahead to 2020 and to map how the diet changes in line with predicted
increases in population. The modelling shows that our diets will not need to change that much from
current guidelines if we are to meet the WWF 2020 GHGE targets. We will still be able to eat meat and
dairy, crisps and chocolate, for example. The weekly menu contains fish and chips, macaroni cheese,
chicken curry and beef chilli, as well as plentiful amounts of fruit and vegetables – so it’s not a mundane
menu. This demonstrates that you do not necessarily have to be vegetarian or vegan to save the planet.
The diet is familiar, normal and varied.
This is a first attempt at defining a sustainable diet, and we recognise that it’s not perfect; more needs to
be done. The report is based on the best available information in the public domain. And while the
1
FAOSTAT, table D1 – Dietary energy protein and fat consumption />studies/statistical-yearbook/fao-statistical-yearbook-2009/d-consumption/en/
Livewell Report 2011
6
reader may be able to debate some of the detail of this report, we firmly believe the overall story (more
plants, less meat, less processed food) won’t change. The Livewell plate is the first step towards a
sustainable diet and we hope it will be built upon.
Recommendations
If we really want to avoid climate change and conserve the ecosystems on which we all depend, it’s clear
that we have to tackle both what we produce and consume. To progress this work, WWF believes that
the UK government and retailers need to urgently develop and promote eating habits based on a
sustainable diet if we are to address climate change, protect ecosystems and start to reverse the impacts
of poor nutritional choices and promotions on people’s health.
Led by the Department of Environment, Food and Rural Affairs and the Department of Health, the UK
government should define a sustainable diet and convene a debate of all stakeholders including
retailers, farmers, civil society, communities and civil servants.
The government should use the principles of a sustainable diet to inform its procurement strategy and
to ensure meals supplied in all areas where public procurement standards are enforced follow these
guidelines.
Further research needs to be conducted to incorporate other environmental elements, as well as social
and economic aspects, into the Livewell plate.
Retailers should promote food choices that make it easier for consumers to follow a sustainable diet.
The role of consumer choice ‘editing’ by retailers could be instrumental in facilitating change – for
example, highly processed food could be reformulated to follow the Livewell guidelines.
Duncan Williamson
Programme Manager
One Planet Food
WWF-UK
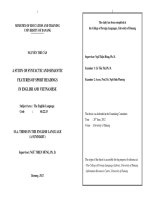
LIVING WELL
When it comes to food we’re all a bit weary of being told what to do.
And the conicting reports we hear make it all sound a bit complicated.
Well – here’s some good news! Things might be a good deal simpler
than you think. What’s healthy for people is – more or less – healthy for
the planet too.
The food we eat – growing, producing and importing it – has a massive
impact on the planet, from the Cerrado savannah in Brazil to the forests
of Borneo. And food is responsible for 30% of the UK’s CO2 emissions,
adding to the threat of dangerous climate change.
But you can help the environment by eating more fruit, vegetables
and cereals – and less meat and processed food. And, of course, that’s
better for you too.
wwf.org.uk/livewell2020
© WWF- Canon / RiChaRd StonehouSe
Livewell Report 2011
8
EXECUTIVE SUMMARY
With increasing recognition of the environmental impact of food and drink, future food policy and
dietary advice need to go beyond the traditional focus on nutrient recommendations for health to
include wider issues of sustainability. The task should not be underestimated, not least because the
issue of sustainability is complex with multiple dimensions, including environmental, economic and
social aspects. Current dietary advice is based on nutrient recommendations for health. These
recommendations have been translated by the Food Standards Agency into a health education tool for
the public, known as the Eatwell plate. The plate illustrates the proportions of major food groups that
should be included in a healthy diet. It is now recognised that this advice needs to be extended to
integrate sustainability.
The Climate Change Act 2008 set out targets to reduce greenhouse gas emissions (GHGEs)
2
. At present
it is estimated that 18-20% of GHGEs in the UK come from the food chain. In response to climate
change, WWF-UK’s One Planet Food Programme (2009-12) set goals to reduce GHGEs from the
consumption and production of food destined for the UK by at least 25% by 2020 and by 70% by 2050
(based on 1990 emission levels). This will require changes to both the supply side (food production) and
the demand side (food consumption) within the food supply chain. As part of the WWF programme, this
project was designed to incorporate issues of environmental sustainability, in particular reduction in
GHGEs, into the Eatwell plate advice to develop what WWF terms the ‘Livewell’ plate.
The main questions addressed in this report are:
1. What is the nutrient intake and the GHGEs of the UK population’s diet?
2. What would WWF’s Livewell plate and diet look like if they met both current dietary
recommendations and the 2020 target of a 25% reduction in GHGEs?
3. Is it possible to achieve a diet with 70% reductions in GHGEs by 2050 and still meet current
dietary recommendations?
To answer the first question, dietary intake data from the National Diet and Nutrition Survey (NDNS)
for adults aged 19-64 years (2000/01) was compared with nutrient recommendations for health and the
Eatwell plate. This confirmed the fact that the UK diet is too high in saturated fat, sugar and salt, and
low in fibre compared with dietary recommendations. Furthermore, a shift to more fruit, vegetables and
starch-based food and to fewer high fat and/or sugar types of food and high protein-based food
(particularly meat) is needed. From the NDNS data it was estimated that the GHGE from the UK adult
diet was 7.14kgCO
2
e/adult/year, which is similar to previous estimated annual UK food chain GHGE
figures.
To address the second question, the main task of the project was to develop a Livewell 2020 diet that
would meet the 2020 target for reductions in GHGEs and dietary recommendations for a healthy diet.
This required GHGE data for different food commodities to be matched to the actual food items
consumed in the diet, as well as adjusting the GHGE reduction targets (expressed as
kgCO
2
/person/day) to take into account projected population growth by 2020 and 2050. It was
assumed that GHGE reductions would be made to both the supply and demand sides within the food
chain.
2
There are six main greenhouse gases which cause climate change and are limited by the Kyoto protocol. Each gas has a different
global warming potential. For simplicity of reporting, the mass of each gas emitted is commonly translated into a carbon dioxide
equivalent (CO
2
e) amount so that the total impact from all sources can be summed to one figure.
Livewell Report 2011
9
To address the second question, the main task of the project was to develop a Livewell 2020 diet that
would meet the 2020 target for reductions in GHGEs and dietary recommendations for a healthy diet.
This required GHGE data for different food commodities to be matched to the actual food items
consumed in the diet, as well as adjusting the GHGE reduction targets (expressed as
kgCO
2
/person/day) to take into account projected population growth by 2020 and 2050. It was
assumed that GHGE reductions would be made to both the supply and demand sides within the food
chain.
Total GHGEs from the food supply can be split by a nominal boundary of the regional distribution
centre (RDC), i.e. primary commodity production and transport to the RDC (pre-RDC) and processing,
transport to retail, storage, preparation and waste (post-RDC), in the ratio of 56:44 (Audsley et al.
2009). It is recognised, however, that this is only a nominal boundary as it is not always clear exactly
where primary production ends and processing begins for different types of food. Given the limited data
available for post-RDC for individual food commodities, the focus in this report was on changing food
choice using pre-RDC GHGEs for which there is more comprehensive data. Using the mathematical
modelling technique of linear programming, a diet was created from a list of food by placing a number
of constraints on the model to ensure that nutrient recommendations were met and GHGEs minimised.
For the Livewell 2020 diet additional constraints were built in, placing either upper or lower weight
limits on individual food items that could be included in the diet to make it more acceptable to the UK
population.
The resulting list of food items, which could be viewed as an example of a ‘shopping list’ for a week, was
used to create a seven-day sample menu to demonstrate that food could be combined into a
recognisable and varied diet, with examples of the type of meals. The menu was only an illustration as
there are many different ways in which the food could be combined and therefore should not be
interpreted as a definitive diet. There are many different combinations of food that could meet dietary
recommendations and GHGE targets; substitution of food in the list could take into account variations
in food preferences, seasonality, culture or nutrient needs.
The diet includes both meat and dairy products, though quantities are reduced compared with the
current UK diet. The inclusion of these commodities is intentional, as it is considered unrealistic to
expect the population to make radical changes, such as wholly eliminating these food types from their
diet by 2020 (less than 5% of the UK population report being vegetarian or vegan). Smaller quantities of
meat will mean changing eating patterns to either fewer meat-based meals or smaller quantities within
a meal. The cost of food for the Livewell 2020 diet was estimated to be £28.40 per person per week
based on mid-range supermarket products in August 2010, which is slightly less than the average
household spend of £32.12 per person on food in 2009.
The Livewell plate developed for 2020 provides additional detail within some of the original Eatwell
food groups, such as the proportion of the different sources of protein-based food. For example, in the
Livewell 2020 plate only about a third comes from meat, which is significantly less than in the UK diet.
The plate needs to be developed further to include additional dimensions of sustainability – for example
the fruit and vegetable food group could be sub-divided to take into account seasonality and energy
efficiency of production methods. A similar approach could be adopted for each of the five main food
groups on the Eatwell plate.
Thirdly, it was shown that it was possible with the right combination of food to achieve a 70% reduction
in GHGEs (2050 target) while still achieving dietary recommendations for health, but the range of food
would be limited. Furthermore, it would be much more difficult to create a sensible diet from the list of
food. A 2050 diet could include food such as meat and dairy, but in very much smaller amounts than the
current diet; this would only be achievable by limiting the range of other food in the diet. It was
concluded that it was unrealistic to create an actual diet as it could only be based on food available today
and current estimates of GHGEs for food commodities, both of which are likely to change over the next
40 years. Taking a holistic approach to the diet, this project has shown that a healthy and low-GHGE
Livewell Report 2011
10
diet can include a moderate amount of food types classed as ‘unhealthy’ or food with high GHGEs by
balancing them with other lower GHGE food across the rest of the diet.
In this report, only GHGEs have been addressed but other environmental, social and ethical aspects of
sustainability could be included in future to explore wider impacts, as well as identifying any possible
unintended consequences of changing the diet. This project should be viewed as a first step towards
developing a diet that meets both dietary recommendations and GHGE targets, which has been shown
to be possible. The real challenge will be to develop a clear, consistent message for the public and to find
ways of supporting change towards a diet for a healthy population and environment. It is clear,
however, that a reduction in GHGEs from the UK diet is needed now, and that action should be taken to
initiate real change in the UK diet so that we move towards a diet that is healthier and more sustainable.
KEY POINTS
The UK diet is too high in saturated fat, sugar and salt and too low in fibre, while the types of
food eaten are also contributing high GHGEs. It is therefore neither sustainable for health nor
the environment.
A diet can be achieved which meets dietary recommendations for health and the GHGE
reduction targets for 2020, without eliminating all meat and dairy products. Rebalancing the
UK diet in line with the Eatwell plate and reducing meat-based proteins could achieve a diet
that would meet the 2020 GHGE target.
Meeting the GHGE targets for 2050 and dietary recommendations will require a radical shift in
food consumed, though it would be possible to include some meat or dairy products in very
small amounts if other food in the diet were low in GHGEs.
As the GHGE targets are based on an annual emissions value and the UK population is
projected to grow by 2020 and 2050, it follows that the reduction in GHGEs will need to be
even greater than 25% and 70% per person respectively. To achieve these targets changes will be
needed in both food production and consumption.
Using a relatively simple mathematical modelling technique to achieve a holistic approach to
healthy and sustainable diets illustrates that future food choice is about balancing food in the
diet, not eliminating them. This flexible approach allows different cultural, religious and
individual dietary needs or preferences to been taken into account.
This report provides a starting point for understanding healthy sustainable diets, with future
work needed to integrate wider issues of sustainability into the modelling process and to
develop broader dietary advice.
Livewell Report 2011
11
1. BACKGROUND
In 2008 the Cabinet Office published Food Matters: Towards a Strategy for the 21st Century (Cabinet
Office 2008), which set out some of the concerns about current food consumption in the UK and its
impact on health, and the economic, social and environmental sustainability of food production. It
concluded that the current diet is not sustainable for either public health or the environment. In brief,
the diet of the UK population is failing to meet dietary recommendations, with high intakes of saturated
fat, sugar and salt, and low intakes of fruit and vegetables (Henderson et al. 2003, FSA 2010). It is
estimated that 70,000 premature deaths a year in the UK could be avoided if the population met energy
and nutrient recommendations. In addition current dietary patterns have a significant environmental
impact (Cabinet Office 2008). It is estimated that 18-20% of the total UK greenhouse gas emissions
(GHGEs) come from the food chain; from production, processing, transport, storage, consumption and
waste (Garnett 2008).
In terms of economic stability and growth, in 2008 the UK food and drink industry accounted for 7% of
the national output, supporting about 3.7million jobs (Cabinet Office 2008). Trying to balance these
complex elements of sustainability poses an enormous challenge. While some synergies can be found
there are also a number of conflicting goals and potential tensions. For example, a recent report by the
Sustainable Development Commission (SDC) suggested that while reducing the consumption of food
and drink with low nutritional values could have a positive impact on public health, environmental
sustainability and social inequalities, it could possibly have a negative impact on economic
sustainability (SDC 2009). These issues can no longer be addressed in isolation. This has led to calls for
better integration of health and environmental impacts in future food policies to reduce the likelihood of
conflict and unintended consequences of action or policy. In January 2010 the UK government
launched ‘Food 2030’, a new national food strategy and the first for 50 years (UK government 2010)
3
. It
set out a vision for 2030 to develop an integrated approach to food policy linking sustainability, food
security and health. This is complex and is likely to be challenging, not least because currently there is
no agreed definition of a sustainable diet.
With increasing global temperatures and the impact of climate change, it is accepted that there needs to
be a reduction in global GHGEs which are contributing to climate change. As part of the UK Climate
Change Act 2008 (www.legislation.gov.uk/ukpga/2008/27) targets were set to cut the total annual
GHGEs in the UK by at least 80% by 2050, with an interim target of a reduction of 34% by 2020 (based
on the 1990 levels). The food system is a major contributor to GHGEs, with the food chain estimated to
account for approximately a fifth of total GHGEs in the UK, the majority of which are thought to come
from agriculture (Garnett 2008). GHGs are produced at all stages of products’ life cycle, including
agriculture, food production, processing, packaging, storage, transport, retailing, preparation,
consumption and waste – but there is limited detailed and accurate data on each of these stages for
individual food commodities. Assessing the GHGEs of a product, using life cycle analysis (LCA), is
complex and the methods and assumptions made are not always consistent – for example the variables
included in the calculations may vary (e.g. direct and indirect emissions).
In 2007 the British Standards Institute developed the Publicly Available Specification 2050 (PAS 2050)
at the request of the Department of Environment, Food and Rural Affairs (Defra) and the Carbon Trust
to provide a method for measuring the embodied GHGEs from goods and services (PSA 2050, 2008).
The guidelines designed to standardise the method of assessment and to help make the comparison of
GHGEs between products easier in the future were published in 2008 and a review of them is due to be
published in 2011. One of the benefits of using an LCA to evaluate the environmental burden of a
product is that it can help to identify where GHGE savings can be made.
Also, looking at the whole life cycle of a product rather than sections in isolation, can help avoid
artificial or misguided savings. For example, reducing refrigeration of produce may save emissions
3
It is unclear at the time of writing how the UK government will take this forward.
Livewell Report 2011
12
during storage but could result in greater levels of food waste (Garnett 2008). This area of work is
evolving rapidly as more is understood about GHGEs in the food chain, but it now needs to be linked to
the impact of diet on health. It should also be noted that GHGEs (often referred to as the carbon
footprint) are only one of many environmental impacts of the diet, with others including water use,
biodiversity and land change. For this project, however, the focus was on GHGEs. It is generally agreed
that on average meat and dairy products are the most GHG-intensive relative to other food groups, with
most emissions coming from the agricultural stage of the LCA (Garnett 2008). To make sustainable cuts
in GHGEs from the food chain, changes are needed in both the supply side (food production) and the
demand side (food consumption).
Attempts to meet GHGE targets from the food chain must not be made in isolation because any dietary
recommendations to reduce GHGEs must also meet dietary requirements for the health of the
population. The most recent population-based energy and nutrient requirements were published in 1991
by the Department of Health (DoH 1991), with subsequent recommendations for specific food items
such as fruit and vegetables, red and processed meat, and fish set by other organisations such as the
Food Standards Agency and the World Cancer Research Fund (FSA 2007, WCRF 2007). The
Department of Health dietary recommendations are now almost 20 years out of date and the evidence
on which they were based even older. Some of the recommendations are currently under review but
were not available at the time this project was completed.
Despite the long-established recommendations and public health messages, the population is still
failing to achieve a healthy balanced diet. To date public health messages for dietary intakes have
focused on the impact on health outcomes and have not addressed any of the wider issues relating to
sustainability. It is recognised that this could be complex, but it is important to add some of the wider
issues of sustainability into current dietary advice if a single, consistent message about the diet is to be
given to the public, government and industry. The next step therefore is to build on the dietary
recommendations for health to incorporate broader environmental and social issues of sustainability.
This work is in its infancy with no consensus on the definition of a sustainable diet; indeed, it is still not
known if it is even possible to have a diet that is environmentally, socially and economically sustainable
that will also meet dietary requirements for health.
2. PROJECT BRIEF
This project was funded by WWF-UK as part of its One Planet Food Programme (2009-2012). The
programme aims to reduce the global environmental and social impacts of UK food consumption and
help safeguard the natural world, tackle climate change and the way we live. It is intended to stimulate
debate about how changes in the UK diet may go some way towards achieving the programme goals
outlined in Box 1.
Given the short timeframe and scope of the present project, the work focused on the first of the One
Planet Food Programme goals, which is to reduce GHGEs from the production of food destined for and
consumed in the UK. Inclusion of broader environmental (e.g. water usage, land use, biodiversity) and
ethical issues of sustainability is outside the scope of the project but some of these issues are discussed
later in the report (section 9). The aim of the project was to explore what a diet which met both energy
and nutrient requirements for a healthy balanced diet and a reduction in GHGEs might look like. Meat
and dairy products are viewed as the most GHG-intensive food commodity (Garnett 2008), but they
should not simply be removed from the diet as they can contribute a range of essential nutrients
required for a healthy diet, such as iron, essential amino acids, zinc, B vitamins and calcium.
Livewell Report 2011
13
In terms of GHGEs, the goal of the One Planet Food programme is to reduce food-related GHGEs by at
least 25% by 2020 and by 70% by 2050, based on 1990 levels. In 1990 the total level of GHGEs in the
UK was estimated to be 776.1MtCO
2
e
4
(DECC 2010), with direct emissions from the food supply chain
accounting for 18-20% of total GHGEs – equivalent to approximately 152.183MtCO
2
e per year (133-171
MtCO
2
e (95% CI)) (Audsley et al. 2009). The food-related emissions targets for 2020 and 2050 are
therefore approximately 114,137ktCO
2
e and 45,655ktCO
2
e per year respectively. It should be noted that
these figures do not include the impact of land use change, which is estimated to account for an
additional 102,000ktCO
2
e per year.
The specific objective was to take the principles of the Eatwell plate (FSA 2007), which was designed to
illustrate the balance of food and drinks that should be consumed for a healthy diet, and develop a
‘Livewell’ plate. The Livewell plate would be designed not only to achieve the dietary recommendations
for health but also meet the GHGE targets. In the short term, not only does the diet need to meet both
these requirements but any future diet also needs to be acceptable to the UK consumer if we are
realistically to expect people to change their current diet. For example, the approach taken here was to
reduce the quantities of GHG-intensive food eaten, such as meat and dairy products, rather than
eliminate them completely from the diet. This can be achieved either by eating smaller portions or
eating them less frequently.
The questions posed for the project were:
i. What is the average food and nutrient intake of the UK population?
ii. How does the UK diet compare with dietary recommendations and the Eatwell plate?
4
GHGEs are expressed as carbon dioxide equivalents (CO
2
e), which is a universal unit to represent GHGs (carbon dioxide is the
most abundant of these gases, but methane, nitrous oxide and some refrigerant gases have a more significant impact in terms of
global warming potential).
Box 1: One Planet Food Programme
“By 2050 the key social and environmental impacts of food production and consumption have
been reduced and the UK has moved to a one planet food system.”
Goals for 2020:
To reduce GHGEs resulting from the production and consumption of food consumed in
the UK by at least 25% based on 1990 levels.
To ensure more than 80% of the total water footprint related to food consumption in
the UK rests on areas where water use does not exceed the water limits of the
concerned area.
To halt habitat loss within our priority biodiversity places caused by food production
destined for and consumed in the UK,
Goals for 2050:
To reduce GHGEs resulting from the production and consumption of food consumed in
the UK by at least 70% based on 1990 levels.
To ensure that all water usage in the production of food consumed in the UK has no
unacceptable socio-economic or environmental impacts.
By 2050, the major adverse socio-economic and environmental impacts of production
and consumption of food consumed in the UK is eliminated within key global
ecosystems.
Livewell Report 2011
14
iii. What is the GHGE from the UK diet?
iv. Based on the Eatwell plate, what would an equivalent ‘Livewell 2020’ diet and plate look like if it
were to meet the 2020 reduction in GHGE target (25%) and current dietary recommendations?
v. Would it be possible to achieve a 70% reduction in GHGEs by 2050?
At the outset it should be stressed that the published data available for GHGE for food and drinks is very
limited and the values are only approximate. Values can vary between different sources of data, with
inconsistencies partly explained by differences in the assumptions made in the calculations and
methodologies used to estimate GHGEs. While this makes it difficult to combine datasets, the general
hierarchy of GHGEs from different food groups is reasonably consistent. Unlike the national food and
nutrient composition databases, which contain nutrient information for an extensive range of food and
drinks, there is no equivalent database for GHGEs from food and drink available. The lack of
standardised GHGE data was one of the big challenges for this project, so assumptions based on the
published data had to be made to develop a database of GHGE for food. The project was completed in
four months (July to October 2010) and this should be viewed as a scoping report. The ‘Livewell diet’ is
the first step in estimating what future diets could look like and is the starting point for more detailed
future work in this area. In time, as more detailed and accurate GHGE data becomes available, this work
can be updated and developed.
3. THE DIET OF THE UK POPULATION
The purpose of this section of the report is to describe the diet of the UK adult population and compare
it with recommended intakes of energy and nutrients and the Eatwell plate. The data presented is taken
from the National Diet and Nutrition Survey (NDNS) carried out in 2000/01 (Henderson et al. 2003)
and is based on reported consumption data – not purchase or expenditure data.
3.1 Dietary intakes in the UK
The dietary habits of the UK population are based on data from the NDNS of adults aged 19-64 years
carried out in 2000/01 (Henderson et al. 2003). This is a national cross-sectional survey to assess the
dietary habits and the nutritional status of a representative sample of men and women. Dietary intakes
were assessed using self-completed seven-day weighed dietary records, where the participant is
required to weigh (wherever possible) and record all food and drink consumed during a seven-day
period.
A total of 833 men and 891 women aged 19-64 years completed the survey. Although the 2000/01
NDNS is almost 10 years out of date, it was used in this project because it is the most recent complete
national dietary survey. The NDNS is currently being repeated as a new rolling programme which
started in 2008 and is still ongoing (FSA 2010). Some preliminary results have been published from the
new survey but the sample size is small, with dietary data for only 434 people, and the data at this early
stage is unlikely to be representative of the UK population. It was therefore decided to use the data from
the completed 2000/01 survey which has a much larger sample and would be more representative of
the population. The 2000/01 data, however, was compared with the limited data from the 2008/09
programme for indications of any dietary changes in the population over this time.
The Department of Health published dietary reference values (DRVs) for food energy and nutrients for
the UK in 1991 (DoH 1991). These are guidance values for recommended daily intakes for the population
and the terminology for the DRVs used in this report is described in Box 2.
Livewell Report 2011
15
The energy and nutrient intakes for men and women from the 2000/01 NDNS are shown in Table 1.
Table 1: Energy and nutrient intakes per day of the UK population, based on the NDNS
(2000/01)
Energy and nutrient Intakes
per day
Men
(n=833)
Women
(n=891)
Recommendations:
men (women)
Energy (kJ)
Mean
(SD)
9720 (2446)
6870
(1758)
10,600 (8,100)
kJ/d*
Median 9620 6880
Protein (g)
Mean
(SD)
88 (33) 64 (17) 65 (53) g/d**
Median 87 63
Protein (% food energy)
Mean
(SD)
16.5 (3.6) 16.6 (3.5)
Median 16.1 16.3
Total fat (g)
Mean
(SD)
87 (28) 61 (22)
Median 84 60
Total f
at (% food energy)
Mean
(SD)
35.8 (5.6) 34.9 (6.5) <35% food energy
Median 36.0 34.7
Saturated f
at (g)
Mean
(SD)
33 (12) 23 (10)
Median 31 22
Saturated fat (% food energy)
Mean
(SD)
13.4 (2.9) 13.2 (3.3) <11% food energy
Median 13.4 13.1
Total carbohydrate (g)
Mean
(SD)
275 (79) 203 (59)
Median 269 203
Total carbohydrate (% food
energy)
Mean
(SD)
47.7 (6.0) 48.3 (6.7) >50% food energy
Median 48.0 48.4
Non-milk extrinsic sugar
(NMES) (g)
Mean
(SD)
79 (44) 51 (33)
Median 71 44
NMES (% food energy)
Mean
(SD)
13.6 (6.7) 11.9 (6.5) <11 % food energy
Box 2: Terminology for dietary reference values
Estimated average requirement (EAR): the average amount of energy or nutrients
required for people in different age groups and for men and women.
Reference nutrient intake (RNI): the amount of a nutrient which is enough to meet
the dietary requirements of about 97% of the population. Intakes above this value
are considered adequate.
Livewell Report 2011
16
Median 12.5 10.9
Fibre (g) [non-starch
polysaccharides]
Mean
(SD)
15 (6) 13 (5) 18 (18) g/d
Median 14 12
Iron (mg)
Mean
(SD)
13.2 (4.8) 10.0 (3.7) 8.7 (14.8) mg/d**
Median 12.6 9.6
Calcium (mg)
Mean
(SD)
1007 (411) 777 (269) 700 (700) mg/d**
Median 979 752
Zinc (mg)
Mean
(SD)
10.2 (3.2) 7.4 (2.1) 9.5 (7.0) mg/d**
Median 9.9 7.3
Folate (µg)
Mean
(SD)
344 (127) 251 (90) 200 (200) µg/d**
Median 327 245
Vitamin B
12
(µg)
Mean
(SD)
6.8 (5.9) 5.1 (4.6) 1.5 (1.5) µg/d**
Median 5.6 4.4
Sodium (mg)
Mean
(SD)
3313 (1015) 2302 (638)
1600 (1600)
mg/d**
Median 3234 2247
Note: vitamin and mineral intakes are from food sources only and do not include supplements, and sodium does not include salt
added to food in cooking or at the table. * EAR = estimated average requirement, **RNI = reference nutrient intake (DoH 1991).
The mean energy intakes for both men and women were lower than the estimated average requirement
(EAR) for this age group (DoH 1991), which strongly suggests that participants in the survey have
under-reported their habitual dietary intakes. This is probable since 66% of men and 53% of women in
the survey were overweight or obese, suggesting that their habitual energy intake is likely to be higher
than the estimated energy requirements. Under-reporting is a well recognised problem in self-reported
dietary intake studies (Garrow 1995). In the feasibility study for the main NDNS, energy intakes were
compared with energy expenditure (measured using doubly labelled water) and it was found that on
average energy intakes were under-reported by about 25% (Henderson et al. 2003). If a correction was
made for this in the data, the average energy intakes for both men (12.9MJ) and women (9.1MJ) would
exceed the recommendations – the implication being that as a population we consume more food than
we require. This would be consistent with the high prevalence of overweight and obesity in the UK.
The survey shows that the population is failing to meet some of the recommendations for both macro-
and micro-nutrients. The UK diet is too high in saturated fat, sugar (non-milk extrinsic sugar (NMES))
5
and salt, and too low in fibre compared with the dietary reference values. The greatest sources of
saturated fat in the diet are meat and meat products (22%) and milk and dairy products (24%), and the
main source of NMES is from drinks such as soft drinks, fruit juice and alcoholic drinks (37%) and table
sugar (19%).
The sodium intake in Table 1 is only the sodium in food and does not include salt added in cooking or at
the table. Total sodium intake was estimated in a sub-sample of the participants using urinary analysis,
which showed that the total intake was about 4,310mg/day for men and 3,186mg/day for women
(equivalent to 11.0g and 8.1g of salt respectively). These intakes are significantly higher than the
recommended maximum of 6g/day set by the Food Standards Agency. The mean intake of the other
5
The effects of sugar depend on their physical presentation (i.e. free in solution or an integral part of the cellular structure). Non-
milk extrinsic sugar is not located within the cellular structure and is found in food such as fruit juice, honey and ‘added’ sugar.
Livewell Report 2011
17
micronutrients listed in Table 1 met the dietary requirements, with the exception of iron intake which
among women was below the recommended intake. The intake of other vitamins and micronutrients
were within dietary recommendations (LRNI) for more than 90% of the UK population (full details can
be found in the NDNS report (Henderson et al. 2003)). The intake of protein was between 23g/day and
11g/day higher than the dietary reference value for both men and women respectively and accounted for
about 16-17% of food energy. The absolute intake of some of these nutrients is likely to be even higher
than presented because of dietary under-reporting in the survey. Overall the results show that for public
health the diet of the UK population needs to change in order to meet dietary recommendations.
This data is taken from dietary intakes of adults in 2000/01 but the first wave of results from the NDNS
rolling programme suggest that the diets in 2008/09 have changed very little in terms of energy and
nutrient intakes (FSA 2010). The energy intakes in 2008/09 NDNS are reported to be 9.48MJ for men
and 6.92MJ for women, with intakes of saturated fat (13.0% and 12.6% for men and women
respectively) and NMES (13.0% and 12.1% for men and women respectively) still not meeting dietary
recommendations. A more recent FSA survey of sodium intake suggests that intakes of salt may have
reduced slightly (9.7g for men and 7.7g for women) but again are still higher than dietary
recommendations (FSA 2008).
3.2 Comparison of the UK diet with the Eatwell plate
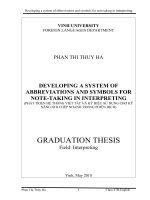
The Eatwell plate: The Food Standards Agency’s Eatwell plate shown in Figure 1 (see page 18) is a
health education tool designed to illustrate the proportion in which food should be eaten to make up a
healthy diet (www.Eatwell.gov.uk/healthydiet/Eatwellplate/). The plate is divided into five food
segments, with the proportions of each segment based on the dietary reference values for the
population. These proportions were used in the national food guidelines developed in 1994 for the
original plate called ‘the balance of good health’ (Hunt et al. 1995). The plate aims to translate scientific
nutrient information into actual food in a pictorial form, making it easier for the consumer to
understand. The purpose was to provide a single source of dietary information to convey a consistent
message to the public about how to achieve a healthy balanced diet. In 2007, ‘the balance of good
health’ was re-launched by the FSA as the Eatwell plate.
The plate shows the relative proportions of what consumers should eat from each of the five food
groups. The plate is divided into the following food groups:
fruit and vegetables 33%
bread, rice, potato, pasta and other starchy food 33%
meat, fish, eggs, beans and other non-dairy sources of protein 12%
milk and dairy 15%
food and drink high in fat and/or sugar 8%
TOTAL 101%*
* As noted in the original document by Gatenby et al. (1995) the total adds up to 101% due to rounding up.
A more detailed description of the range of food included in each segment is described in Appendix 1.
The size of each segment was calculated on the relative consumption of food within each segment to
ensure that a national average diet would be consistent with the dietary reference values (Gatenby et al.
1995). The segments are based on the weight of the food but do not include frequency of servings,
portion size or any specifications of the proportion of different types of food within each segment. The
plate should be used as a guide for achieving a balance over a period of time, such as a week (not at each
meal). It applies to most of the population since it refers to the proportions of food and drinks to be
consumed, rather than quantity or portion sizes. In conjunction with the plate, the FSA has expanded
some of the recommendations about the five sections (Box 3).
THE EATWELL PLATE
8%
33%
33%
12%
15%
* As noted in the original document by Gatenby et al. (1995) the total adds up to 101% due to rounding up.
Fruit and vegetables
Bread, rice, potato, pasta & other starchy foods
Milk & dairy
Food & drinks high in fat & / or sugar
Meat, sh, eggs, beans and other non-dairy sources of protein
Figure 1: The Eatwell Plate (Food Standards Agency)
The plate shows consumers how the relative proportions of what they eat should come
from each food group. The plate is divided into ve food groups:
Total 101%*
Source: Department of Health in association with the Welsh Assembly Government, the Scottish Government and the Food Standards Agency Northern Ireland.
© CROWN COPYRIGHT
Livewell Report 2011
19
There are a number of adjustments and considerations that need to be taken into account not only when
using the plate, but also when comparing it with the diet of the UK population:
1. The volumes of milk and fruit juices included have to be halved to compensate for their high
water content (and therefore weight).
2. Soft drinks are included in the plate as their sugar content (by weight) to compensate for the
weight of water.
3. Not all dairy products are included in the ‘milk and dairy’ section of the plate. Butter, cream and
ice-cream are grouped under ‘high fat and/or sugar food’, as they are principally considered a
source of fat and energy.
4. Alcohol and miscellaneous food such as sauces, pickles, tea and coffee are not included in the
plate.
5. There is no comprehensive list of food published which clearly describes to which of the five
Eatwell sections it should belong, and for some types of food it is not clear where they fit.
6. The plate is based on basic food commodities and does not include composite dishes.
Most composite dishes, such as pizza, casseroles, macaroni cheese and sandwiches, span several food
groups on the plate. As the plate is designed as a tool to educate about the balance of food groups, it is
difficult in its current form to accommodate composite dishes (Gatenby et al. 1995). This relies on the
consumer being able to identify the different food groups in composite dishes and visualise their
proportions, but it is not known whether most consumers today can do this. The lack of composite
dishes also makes it more difficult to compare the UK dietary intake from surveys such as the NDNS
with the Eatwell proportions.
Comparison of the UK diet with the Eatwell plate recommendations: The aim was to try and
display the UK diet in the five Eatwell food groups, in order to estimate how far it is from a ‘healthy
balanced diet’. To estimate the contribution of the different food and drinks in the current UK diet, 106
food groups (excluding toddlers’ drinks, supplements, sweeteners and water) from the NDNS were
allocated to one of the five food groups in the Eatwell plate (see Appendix 2). Adjustments were made
for the weight of liquids such as milk, fruit juice and soft drinks, as described above. The NDNS food
group for meat includes composite dishes such as lasagne, shepherd’s pie and casseroles, while beans
and pulses in composite dishes are included in the category of ‘vegetables’. It is not possible to separate
out the main ingredients to match the Eatwell groups.
Box 3: Food Standards Agency recommend that we should try to eat:
plenty of ‘fruit and vegetables’ (at least five portions a day)
plenty of ‘bread, rice, potato, pasta and other starchy food’ (choose wholegrain
varieties)
some ‘milk and dairy food’ (low-fat alternatives or high-fat versions only infrequently
or in small portions)
some ‘meat, fish, eggs, beans and other non-dairy sources of protein’ (low-fat
alternatives and eat two portions of fish a week including one of oily fish)
just a small amount of ‘food and drinks high in fat and/or sugar’
Livewell Report 2011
20
It was also not clear to which segment some individual food belonged – chips, for example, which were
not separated into fried or oven baked/microwaved. In this project chips were assigned to the ‘high fat
and/or sugar food’ group, but it could be argued that they should come under the ‘starchy food’ group.
The differences between the NDNS and Eatwell food groups are not ideal, but this will be the case for
any data based on consumers reporting what they eat. While the NDNS food groups do not match
exactly the Eatwell food groups, in the absence of any other national dietary consumption data it was
used as the most reliable source of data.
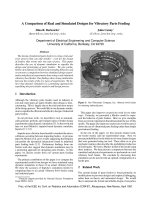
Figure 2 (see page 21) shows the difference between the Eatwell plate and the UK diet for the whole
population and for men and women separately. Even allowing for any differences between the NDNS
food groups and the Eatwell food groups, it is clear that the UK diet does not have the right balance of
food recommended for a healthy diet. The diet tends to be too high in ‘meat, fish, eggs, beans and other
non-dairy sources of protein’ and ‘food and drinks high in fat and/or sugar’, and low in fruit and
vegetables and starchy food. Women report consuming a higher proportion of fruit and vegetables than
men, while men report consuming more ‘meat, fish, eggs and other non-dairy proteins’. Taking into
account the issue of under-reporting, the real picture is likely to be worse since people tend to under-
report unhealthy food (e.g. high fat/sugar food) and overestimate their intake of more healthy food (e.g.
fruit and vegetables).
Figure 3 (see page 22) shows the top ten food groups from the NDNS contributing to each of the Eatwell
groups (a complete list of food contributing to the Eatwell groups is shown in Appendix 3). Seventy per
cent of the ‘meat, fish, eggs and other non-dairy proteins’ group comes from meat and meat products,
with the highest contribution from ‘chicken and turkey dishes’ and ‘beef, veal and dishes’. Fish
contributes about 13.5%, eggs and egg dishes 8.3% and baked beans, nuts and seeds 7.9%.
As previously suggested, including composite dishes in the meat groups can overestimate the actual
amount of meat in the diet. Two large dietary surveys in England and Ireland, in which it was possible
to disaggregate the meat content from composite dishes, showed that meat intake was overestimated in
these surveys by 33-50% (Cosgrove et al. 2004, Prynne et al. 2009). This does not alter the reported
nutrient composition of the diet but will overestimate the amount of meat reported. It was not possible
to disaggregate the amount of meat from the composite dishes with the 2000/01 NDNS data, but these
other surveys suggest that the amount of meat in the diet could be slightly lower than reported.
Conversely, including composite meat dishes such as lasagne or shepherd’s pie within the meat group
will underestimate the amount of vegetables and starchy food in the diet. Given the range of composite
dishes in the different NDNS food groups (Appendix 2) some of these differences will balance out across
the five Eatwell plate segments. While this may slightly alter the proportions of the Eatwell plate in
Figure 3, it does not change the overall picture – that the diet needs to be rebalanced and other protein
sources need to replace some of the meat currently consumed in the diet.
In summary, the UK population is failing to meet the guidelines for a healthy diet or the proportions of
the Eatwell plate, with higher than recommended intakes of saturated fat, NMES and salt and lower
intakes of fruit, vegetables and fibre. To rebalance the Eatwell plate there needs to be a reduction in
food from ‘meat, fish, eggs and other non-dairy proteins’ and ‘high fat and/or sugar food and drinks’
and the energy replaced with a higher intake of starchy food and fruit and vegetables.
Since the vast majority of protein in the diet comes from meat and meat products, even allowing for the
overestimation of meat, there is some scope to rebalance the different sources of protein in order to
reduce the amount coming from meat and meat products – not least because they are the highest
contributor of saturated fat in the diet and also have high GHGEs. Therefore a reduction in meat
consumption could have a beneficial impact on health by reducing the intake of saturated fat (Friel et al.
2009). Clearly, a significant change in the diet of the UK population is needed to achieve a healthy
balanced diet.
UK diet for women
UK diet for men
24%
15%
14%
20%
27%
13%
16%
25%
20%
26%
Eatwell plate (recommended)
33%
FRUIT AND
VEGETABLES
12%
MEAT, FISH,
EGGS, BEANS AND
OTHER NON-DAIRY
SOURCES OF
PROTEIN
33%
BREAD, RICE,
POTATO, PASTA &
OTHER STARCHY
FOODS
15%
MILK & DAIRY
8%
FOOD & DRINKS
HIGH IN FAT & /
OR SUGAR
UK diet for men & women
15%
22%
23%
25%
15%
Figure 2: The UK diet displayed in the Eatwell plate food groups
1. Apples and pears
not canned 12.8%
2. Bananas 11.1%
3. Other vegetables
(not raw) 11.0%
4. Fruit juice 10.1%
5. Other fruit, not
canned 9.5%
6. Salad & other
vegetables (raw) 8.7%
7. Tomatoes (raw) 6.8%
8. Vegetable dishes 6.8%
9. Citrus fruit not
canned 5.2%
10. Leafy green
vegetables(not raw) 4.8%
1. Semi-skimmed milk 45.1%
2. Whole milk 16.3%
3. Yogurt 14.2%
4. Skimmed milk 10.4%
5. Other cheese 9.4%
6. Other milk 2.0%
7. Other diary desserts 1.2%
8. Cottage cheese 0.9%
9. Fromage frais 0.6%
1. White bread 25.4%
2. Other potatoes,
potato salads and
dishes 21.5%
3. Rice 10.8%
4. Pasta 10.6%
5. Wholegrain and
high bre cereals 8.3%
6. Other breads 7.0%
7. Wholemeal bread 6.0%
8. Pizza 4.6%
9. Other breakfast
cereals 2.9%
10. Other cereals 1.9%
23%
FrUit anD vegetabLeS
1. Chips 22.3%
2. Buns, cakes and
pastries 11.7%
3. Fried or roast
potatoes and fried
potato products 7.7%
4. Biscuits 7.5%
5. Sugar 7.2%
6. Chocolate
confectionary 5.9%
7. Carbonated soft
drinks, not diet 5.6%
8. Crisps and savoury
snacks 4.7%
9. Other cereals-based
puddings 3.9%
10. Ice cream 3.8%
15%
FooD & DrinKS high in
Fat & / or SUgar
25%
breaD, riCe, potato, paSta
& other StarChy FooDS
15%
miLK & Dairy
1. Chicken and turkey
dishes 20.3%
2. Beef and veal
dishes 15.5%
3. Baked beans 7.0%
4. Eggs 6.7%
5. Bacon and ham 6.6%
6. Meat pies and
pastries 6.3%
7. Oily sh 5.4%
8. Sausages 4.2%
9. Pork and pork
dishes 3.9%
10. White sh coated
and/or fried 3.9%
Figure 3: The top ten food contributors to each of the Eatwell segments from the UK diet.
22%
meat, FiSh, eggS, beanS anD other
non-Dairy SoUrCeS oF protein
Fruit & vegetables
Bread, rice, potato, pasta
& other starchy foods
Meat, sh, eggs, beans*
and other non-dairy
sources of protein
Milk & dairy
Food & drinks high
in fat & / or sugar
* beans (except baked beans)
and pulses in the UK diet
are included in the fruit
& vegetable section
Livewell Report 2011
23
3.3 Greenhouse gas emissions from the UK diet
The second aim of the project was to estimate the GHGEs of the UK diet based on the dietary data from
the NDNS 2000/01 and provide more detailed information about the main sources of GHGEs in the
diet. It is stated in the recent report How Low Can We Go? (HLCWG) that the annual food-related
GHGEs are approximately 152,183 ktCO
2
e per year (Audsley et al. 2009). Dietary intake data tends to
be expressed in terms of ‘intake per person per day’, and the NDNS data is specifically for adults aged
19-64 years. The annual GHGE figure therefore had to be converted into the equivalent of ‘GHGE per
adult per day’ to make the dietary intake data and GHGE data comparable. The first task was to collate
the GHGE values for individual food and drinks commodities and link them with the food and drink
categories in the NDNS data.
Merging GHGE data with food and dietary intake data: A database was created using GHGE
figures taken mainly from the HLCWG report (Audsley et al. 2009), and as far as possible the individual
food types were aligned with the NDNS food groups. The HLCWG report divides the total food-related
GHGEs from the LCA into two stages with a nominal boundary set by the regional distribution centre
(RDC).
1. Pre-RDC: Primary production up to and including transport to the RDC.
2. Post-RDC: Post-primary commodity production beyond the RDC, which includes
processing, packaging, distribution to the retail storage, retail outlets, food preparation,
washing up and food waste disposal.
Primary production was defined as all activities and emissions arising from commodity production up
to and including transport to the RDC, and for most products this was as the raw commodity. Audsley et
al. describe the RDC as only a nominal boundary as it is not always easy to determine from data sources
where the primary production ends and the processing begins for different food. For example, for liquid
milk the manufacturing, processing and packaging was included in the pre-RDC, while for wheat the
pre-RDC included up to the milling of the wheat; but processing it into products such as bread and
biscuits was included in the post-RDC values. More detail can be found in the HLCWG report (Audsley
et al. 2009).
Emissions from the pre-RDC and post-RDC of the whole food chain have been estimated to account for
approximately 56% and 44% of the total food-related emissions respectively. It is recognised that
different stages of the life cycle can vary considerably between products – for some products the
primary production (pre-RDC) will have a greater contribution to the total GHGE than the processing,
storage and preparation (post-RDC) and vice versa. However, only the primary production values (pre-
RDC) are reported for individual food commodities in the HLCWG report and at the time of completing
this project there was no detailed data relating to individual food for post-RDC. The database created,
therefore, was based on only the pre-RDC values for the food and drink groups and then a constant
value for the GHGE post-RDC was added (in the ratio of 56:44 for pre-RDC and post-RDC) to give an
estimate of the total GHGEs for the diet. Taking the diet as a whole, it was assumed that a lot of the
variation between food in the post-RDC emission would average out across the diet. This is recognised
as a limitation; given more time, future work could weight the different food groups according to the
intensity of the different stages of the post-RDC GHGEs.
GHGE figures vary for the same food item depending on where in the world the food is produced: in the
HLCWG report these are classified into the UK, the rest of Europe and the rest of the world. Using
import and export data taken from UK trade information (www.uktradeinfo.com) a GHG figure for
individual food was recalculated based on the ratios of imports and home production in the UK. The
HLCWG pre-RDC values are based on basic food commodities rather than the actual food consumed:
for example there is a value for milk but not for processed items such as cheese or yogurts. Some
additional values were taken from a Defra report (Wiltshire et al. 2009), but as these values included
GHGEs up to manufactured and packaged food, adjustments were made to represent GHGEs of only the
Livewell Report 2011
24
primary production. The estimated pre-RDC GHGE figure for some processed food was based on the
amount of the basic food commodity needed to produce it, using information from a recent Swedish
study as a guide for these calculations (e.g. it takes 3kg of oranges to make 1kg of orange juice) (Wallén
et al. 2004). A list of GHGE figures (kgCO
2
e/kg of product) was matched with the food groups in the
NDNS data. As discussed above, a limitation of the NDNS dataset is that the food groups contained
composite dishes, unlike the GHGE data which is based on the primary produce.
There were several other adjustments that had to be made so that the GHGE data and dietary data were
compatible. Data for GHGE tends to be expressed as kgCO
2
e/kg of primary products, while dietary and
nutrient data is based on the weight of cooked and/or edible portions of food items. The weight of some
food varies between the raw product and the actual food consumed. For example, the weight can
increase through hydration when cooked (e.g. rice, pasta) and decrease when cooked (e.g. meat), and
the edible portion of a food can differ from the primary product (e.g. banana with and without the skin).
Since the weight of the food from the NDNS data is based on cooked and edible portions, adjustments
were made to the GHG values of the primary produce to account for these differences.
Dietary intake data in the NDNS is expressed as the ‘weight, in grams, of food and drink consumed per
adult per day (g/day)’, while the total GHGEs from the food and drink are expressed as ‘ktCO
2
e/year for
the whole population’. It was calculated that the GHGEs per day based on the whole UK population
(2001) were equivalent to 7.05kgCO
2
e/person/day. The conversion of GHGEs to these units does not
take into account the different energy needs across the population by age or sex. On average adults have
higher energy requirements than younger children and the elderly, and men have higher energy needs
than women. It follows that those with greater energy needs will have higher GHGEs because they will
need to eat more food.
Adjusting for the different energy requirements within the population, it was calculated that the
equivalent food-related GHGE of the adult population matching the NDNS sample (aged 19-64 years)
was 7.50kgCO
2
e/adult/day. The population figure was taken from the National Office of Statistics 2001
UK adult population aged 19-64 years to match the NDNS population. The total GHGE can be split into
pre-RDC (4.20kgCO
2
e/adult/day) and post-RDC (3.30kgCO
2
e/adult/day) emissions using the
estimated 56:44 ratio. Taking account also of the different average energy requirements of men
(10.6kJ/day) and women (8.1kJ/day), the total GHGEs were calculated to be 8.51kgCO
2
e/man/day for
men and 6.50kgCO
2
e/woman/day for women.
Estimate of the GHGE of the UK diet: Based on the NDNS data, the GHGEs of the UK diet of
adults were estimated to be 7.14kgCO
2
e/adult/day (Table 2). Consistent with the calculation of the
annual GHGEs of 152,183 ktCO
2
e/year, the figure from the NDNS data includes all food and drink
consumed, as well as alcohol. The pre-RDC GHGE figure of 3.04kgCO
2
e/adult/day was corrected for the
estimated 25% under-reporting of intake in the NDNS, and then a value for post-RDC (44% of the total)
was added to give the total GHGEs. Despite the margin of errors and uncertainties in the estimated
GHGE and NDNS data, the values for total GHGEs derived from the analysis of the NDNS data are of
the same magnitude to that which was calculated per adult from the annual food related emissions
reported in the HLCWG report (152,183kgCO
2
e/year equivalent to 7.50kgCO
2
e/adult/day).
Livewell Report 2011
25
Table 2: GHGE estimates from UK dietary intakes based on the NDNS compared with the
estimated annual GHGEs from food and drink
GHGEs from the UK diet
(kgCO
2
e/adult/day)
All Men Women
Pre-RDC from NDNS (uncorrected for under-reporting) 3.01 3.50 2.55
Pre-RDC from NDNS (corrected for under-reporting) 4.00 4.65 3.39
TOTAL GHGEs from NDNS data (pre-RDC + post-
RDC)
7.14 8.30 6.05
Estimated GHGE calculated from the annual figure of
152,183kgCO
2
e/year*
7.50 8.51 6.50
* UK population based on 2001 figures for adults aged 19-59 years (Office of National Statistics, www.statatistics.gov.uk [accessed
July 2010]).
Figure 4 (see page 26) shows the approximate percentage contribution of GHGEs from different food
groups in the UK diet, based on the pre-RDC figures. The ‘meat, fish, eggs and other non-dairy proteins’
group contributes the highest (57%) of the total GHGEs. This is due to a combination of high GHGEs of
these food and high levels of consumption. The breakdown of the contribution of the different protein
sources are shown in Table 3. Meat, meat dishes and meat products account for about 48% of the total
GHGEs from the diet, with beef and veal dishes alone accounting for 21% of the total. Milk is the
biggest component of the milk and dairy group, with semi-skimmed milk being most commonly
consumed. Cheese contributes about 35% to this group, with the remainder coming from consumption
of yogurts, fromage frais and other dairy-based desserts.
Table 3: GHGEs from sources in the ‘meat, fish, eggs and other non-dairy proteins’ group
Protein sources % total GHG
emissions
Red meat and meat dishes (beef, lamb, pork) 27.3
Processed meat (bacon, ham, burgers, kebabs, sausages) 9.0
Chicken and turkey dishes (incl. coated chicken) 7.5
Meat products (pies, pastries) and other meat 3.8
Liver and liver dishes 0.5
Fish and fish dishes 6.6
Eggs and egg dishes 1.9
Baked beans 0.3
Nuts and seeds 0.1
Total emissions from ‘meat, fish, eggs and other non-dairy
sources of protein’
57.0%
These figures serve to show where the majority of GHGEs are coming from in the diet. There are some
limitations in using this data – for example, GHGEs for meat and meat products could be overestimated
as the NDNS food group for meat includes composite meat dishes as discussed earlier. The GHGE
values are also based predominantly on pre-RDC emissions, so could overestimate some food which has
higher pre- than post-RDC GHGEs compared with other food groups such as meat vs. vegetables, or
high fat and/or high sugar processed food. The milk and dairy group in the Eatwell plate does not
include all dairy products (i.e. cream, ice-cream and butter), but based on the amount of these types of
food consumed they contribute less than 1% of the diet’s total GHGEs. There are also other food items
that have dairy products included as raw ingredients (e.g. milk chocolate, baked products) which would