Báo cáo khoa học: Glutamine stimulates the gene expression and processing of sterol regulatory element binding proteins, thereby increasing the expression of their target genes docx
Bạn đang xem bản rút gọn của tài liệu. Xem và tải ngay bản đầy đủ của tài liệu tại đây (721.25 KB, 12 trang )
Glutamine stimulates the gene expression and processing
of sterol regulatory element binding proteins, thereby
increasing the expression of their target genes
Jun Inoue, Yuka Ito, Satoko Shimada, Shin-ich Satoh, Takashi Sasaki, Tsutomu Hashidume,
Yuki Kamoshida, Makoto Shimizu and Ryuichiro Sato
Department of Applied Biological Chemistry, Graduate School of Agricultural and Life Sciences, University of Tokyo, Japan
Introduction
Because amino acids are indispensable nutrients for cell
growth, cell culture media usually contain large
amounts of them. In addition to their role as substrates
for protein synthesis, glucogenic substrates and nitro-
gen carriers, amino acids often act as critical regulators
of the transcription of certain genes. For example,
amino acid supplementation with tryptophan and
glutamine induce the gene expression of collagenase
and argininosuccinate synthetase, respectively [1,2].
Amino acid starvation also regulates the transcription
of several genes, including fatty acid synthase, aspara-
gine synthetase and C⁄ EBP homologous protein [3–5].
Amino acid metabolism is strongly linked to both
glucose and fatty acid metabolism. Under certain
Keywords
glutamine; processing; Sp1; SREBP;
transcriptional regulation
Correspondence
R. Sato, 1-1-1 Yayoi, Bunkyo-ku, Tokyo
113-8657, Japan
Fax: 81 5841 8029
Tel: 81 5841 5136
E-mail:
(Received 17 March 2011, revised 23 May
2011, accepted 1 June 2011)
doi:10.1111/j.1742-4658.2011.08204.x
Here we show that the larger the amount of glutamine added to the med-
ium, the more the expression of genes related to lipid homeostasis is pro-
moted by the activation of sterol regulatory element binding proteins
(SREBPs) at the transcriptional and post-translational levels in human hep-
atoma HepG2 cells. Glutamine increases the mRNA levels of several
SREBP targets, including SREBP-2. The gene expression of SREBP-1a,
a predominant form of SREBP-1 in most cultured cells and a target of the
general transcription factor Sp1, is significantly augmented by glutamine
via an increased binding of Sp1 to the SREBP-1a promoter. In contrast,
the increased expression of SREBP targets including SREBP-2 is due to
stimulation of the processing of SREBP proteins by glutamine. It is also
shown that glutamine accelerates SREBP processing through increased
transport of the SREBP ⁄ SREBP cleavage-activating protein complex from
the endoplasmic reticulum to the Golgi apparatus. The processing of acti-
vating transcription factor 6 is activated by the same proteases as SREBPs
in the Golgi in response to endoplasmic reticulum stress and is not induced
by glutamine. Taken together, these results clearly demonstrate that gluta-
mine brings about not only the induction of SREBP-1a transcription but
also the stimulation of SREBP processing, thereby facilitating the gene
expression of SREBP targets in cultured cells.
Abbreviations
ATF6, activating transcription factor 6; CPT1A, carnitine palmitoyltransferase 1A; ER, endoplasmic reticulum; GAPDH, glyceraldehyde-3-
phosphate dehydrogenase; GFAT, glutamine:fructose-6-phosphate amidotransferase; HMG, 3-hydroxy-3-methylglutaryl; Insig, insulin-inducing
gene; LDL, low density lipoprotein; MTP, microsomal triglyceride transfer protein; PI3K, phosphatidylinositol 3-kinase; PLAP, placental
alkaline phosphatase; p70S6K, p70 ribosomal protein S6 kinase; SCAP, SREBP cleavage-activating protein; SQS, squalene synthase;
SREBP, sterol regulatory element-binding protein; S1P, site-1 protease; S2P, site-2 protease.
FEBS Journal 278 (2011) 2739–2750 ª 2011 The Authors Journal compilation ª 2011 FEBS 2739
physiological conditions amino acids are metabolized
to either glucose precursors or acetoacetyl-CoA.
Acetoacetyl-CoA is then converted to acetyl-CoA and
it subsequently enters into the tricarboxylic acid cycle,
or is used as a precursor of fatty acids in response to
their demands. Under fasting conditions, the acetyl-
CoA provided by the oxidation of free fatty acids
increases the consumption of amino acids as precur-
sors of the oxaloacetate required for condensation
with acetyl-CoA [6]. Although the acetyl-CoA
provided as a metabolite of amino acids can be a sub-
strate for cholesterol synthesis, the interplay between
amino acid and cholesterol metabolism remains largely
unknown.
Cholesterol and fatty acid synthesis are strictly
regulated at the transcriptional level. SREBPs are a
family of transcription factors which consists of the
SREBP-1a, SREBP-1c and SREBP-2 proteins that
control the transcription of genes related to
cholesterol and fatty acid metabolism [7]. SREBPs are
synthesized as membrane proteins located on the
endoplasmic reticulum (ER) and are processed to lib-
erate the N-terminal halves that function as transcrip-
tion factors in the nucleus. The proteolytic processing
of SREBPs is tightly regulated by the interaction
between two ER membrane proteins, SREBP cleav-
age-activating protein (SCAP) and the insulin-induc-
ing gene (Insig). When cells are depleted of sterols,
SCAP escorts SREBPs from the ER to the Golgi.
Thereafter, SREBPs are processed by two proteases,
site-1 protease (S1P) and site-2 protease (S2P) within
the Golgi. Once the ER membrane cholesterol content
increases, SCAP binds to cholesterol, induces confor-
mational change and becomes attached to Insig,
thereby remaining on the ER membrane. There-
fore, cholesterol is a critical determinant of SREBP
activation.
In the present study, we report that glutamine treat-
ment results in an increase in the promoter activities of
a number of SREBP targets, such as the low density
lipoprotein (LDL) receptor, 3-hydroxy-3-methylgluta-
ryl (HMG) CoA synthase and squalene synthase (SQS)
genes in human hepatoma HepG2 cells. We further
investigated the molecular mechanism by which
glutamine affects the expression of the genes involved
in cholesterol homeostasis. The results clearly demon-
strate that glutamine stimulates SREBP processing and
the gene expression of SREBP targets. The same con-
centrations of alanine, proline and glutamate treatment
did not influence SREBP processing. Moreover, gluta-
mine treatment also causes an increase in hexosamine
biosynthesis as a substrate, thereby enhancing the
SREBP-1a mRNA levels. To our knowledge, this is
the first report showing that glutamine promotes
SREBP activities and stimulates the gene expression of
SREBP targets.
Results and Discussion
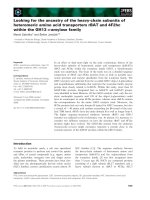
Glutamine stimulates the promoter activities of
SREBP targets
More than 50 years ago, Eagle et al. [8] reported the
importance of glutamine in a culture medium for cell
proliferation. Because cholesterol is essential for the
constituent of membrane, we examined whether gluta-
mine regulates the expression of genes involved in cho-
lesterol homeostasis. To investigate the effect of
glutamine on the transcription of genes related to cho-
lesterol metabolism, a variety of reporter assays were
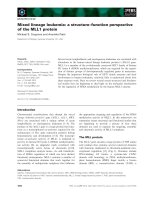
preformed in HepG2 cells. The promoter activities of
the LDL receptor, HMG CoA synthase and SQS were
increased by the addition of a 4- or 10-fold excess of
glutamine in DMEM, while the promoter activity of
microsomal triglyceride transfer protein (MTP) was
attenuated in a dose-dependent manner (Fig. 1A). In
contrast, carnitine palmitoyltransferase 1A (CPT1A)
promoter activity was not affected by glutamine
(Fig. 1A). Since these observed glutamine effects mim-
icked SREBP actions, we next determined whether
treatment with sterols, which almost completely inhibit
SREBP processing, affects the glutamine-induced pro-
moter activities. The glutamine-induced promoter
activities of both HMG CoA synthase and SQS were
abolished by sterols (Fig. 1B). When one or two of the
sterol regulatory elements (SREs) in the HMG CoA
synthase or SQS promoter, respectively, was mutated
(SREKO), the glutamine stimulatory effects were
greatly reduced (Fig. 1B). Moreover, the glutamine
effect on the HMG CoA synthase promoter activity
was also observed in human intestinal epithelial Caco2
cells (Fig. 1C). From these results, it seems likely that
the glutamine actions are mediated by the activation
of SREBP.
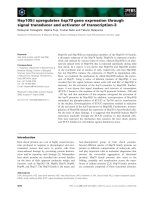
Next, we sought to confirm whether glutamine
causes an elevation of the endogenous mRNA levels
of SREBP targets. HepG2 cells were treated with a
10-fold excess of glutamine for 12 h. Quantitative real-
time PCR analyses revealed that glutamine treatment
caused a significant increase in the mRNA levels of
both HMG CoA synthase and the LDL receptor, and
the glutamine effects were completely abolished by the
addition of sterols (Fig. 2). Taken together, glutamine
is evidently capable of stimulating the SREBP-
mediated expression of genes related to cholesterol
metabolism.
Glutamine stimulates SREBP activities J. Inoue et al.
2740 FEBS Journal 278 (2011) 2739–2750 ª 2011 The Authors Journal compilation ª 2011 FEBS
Glutamine enhances the mRNA levels of SREBP
family members
There are a couple of possible explanations for the glu-
tamine-mediated promotion of SREBP functions. The
most likely are, first, an increase in the gene expression
of SREBPs, and second, the enhancement of SREBP
processing by glutamine. We therefore investigated the
effect of glutamine on the gene expression of SREBP
family members, SREBP-1 and SREBP-2. SREBP-1
exists in two forms, designated 1a and 1c. SREBP-1a
is the predominant isoform in most cultured cells,
including HepG2 cells [9], and is a more potent
transcription factor than SREBP-1c [10]. Accordingly,
we examined the effect of glutamine on the gene
expression of SREBP-1a and SREBP-2 in HepG2 cells
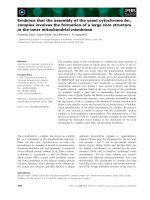
in the following experiments. The mRNA levels of
both SREBP-1a and SREBP-2 were significantly
elevated by treatment with a 10-fold excess of gluta-
mine for 12 h in HepG2 cells (Fig. 3A). It has been
demonstrated that SREBP-2 is an SREBP target gene,
and that the transcription of SREBP-1a gene is
predominantly regulated by the general transcription
factor Sp1 [11,12]. We next compared the glutamine-
induced gene expression of SREBPs under various
conditions. When HepG2 cells were cultured with both
glutamine and sterols, the increased SREBP-1a mRNA
levels were not reduced by sterols, which suppressed
SREBP-2 expression robustly (Fig. 3A), implying that
the gene expression of SREBP-2 is induced by the acti-
vation of the SREBP in response to the higher gluta-
mine concentration. In contrast, the elevation of the
SREBP-1a levels by glutamine was completely
abolished by azaserine, an inhibitor of glutamine:fruc-
tose-6-phosphate amidotransferase (GFAT), whereas
the SREBP-2 mRNA level was not affected. These
0.0
0.5
1.0
1.5
2.0
2.5
3.0
pHMG S
3.5
4.0
WT
SREKO
B
Relative luciferase activity
0.0
0.5
1.0
1.5
2.0
2.5
3.0
pLDLR pHMG S pSQS pMTP pCPT1A
Relative luciferase activity
A
HepG2
**
**
**
**
**
*
0.0
0.5
1.0
1.5
2.0
2.5
pCPT1ApHMG S
Relative luciferase activity
C
Caco2
*
**
3.5
No addition
4 × Gln
10 × Gln
****
0
1
2
3
pSQS
4
5
WT SREKO
HepG2
****
No addition
10 × Gln
10 × Gln
+ Sterols
No addition
4 × Gln
10 × Gln
Fig. 1. Glutamine stimulates the promoter activities of SREBP tar-
gets. HepG2 cells (A and B) and Caco-2 cells (C) were transfected
with 200 ng of the reporter constructs consisting of the indicated
gene promoters and 200 ng of pEF-b-Gal. The cells were cultured
with medium A (A and B) or medium B (C) for 36 h and then re-fed
with the low amino acid medium supplemented with the indicated
concentration of glutamine (4 · Gln, 16 m
M; 10 · Gln, 40 mM) for
12 h in the presence or absence of sterols (10 lgÆmL
)1
of choles-
terol plus 1 lgÆmL
)1
of 25-hydroxycholesterol). Luciferase assays
were performed as described in Materials and methods. The pro-
moter activities without glutamine addition are represented as 1.
All data are presented as means ± SD of three independent experi-
ments performed in triplicate. *P < 0.05; **P < 0.01.
0.0
0.5
1.0
1.5
2.0
2.5
3.0
3.5
4.0
HMG S LDLR
Relative mRNA level
0.0
0.5
1.0
1.5
2.0
2.5
3.0
**
**
No addition
10 × Gln
10 × Gln
+ Sterols
Fig. 2. Glutamine enhances the gene expression of endogenous
SREBP targets in HepG2 cells. HepG2 cells were cultured with the
low amino acid medium containing a 10-fold excess of glutamine
(10 · Gln, 40 m
M) for 12 h in the presence or absence of sterols
(10 lgÆmL
)1
of cholesterol plus 1 lgÆmL
)1
of 25-hydroxycholesterol)
and total RNA was isolated. Real-time PCR analysis was per-
formed, and relative mRNA levels were obtained after normalization
to GAPDH mRNA. The mRNA levels without glutamine addition are
represented as 1. All data are presented as means ± SD of three
independent experiments performed in triplicate. **P < 0.01.
J. Inoue et al. Glutamine stimulates SREBP activities
FEBS Journal 278 (2011) 2739–2750 ª 2011 The Authors Journal compilation ª 2011 FEBS 2741
results imply the involvement of the O-glycosylation of
Sp1 in the induction of SREBP-1a transcription by
glutamine. The gene expression of SREBP-1c, which
represented less than 20% of the SREBP-1a gene
expression in our experiments, was regulated in a
similar manner to SREBP-2 (data not shown). It has
been reported that glutamine treatment stimulated
O-glycosylation of Sp1 in Caco2 cells, in turn causing
an increase in Sp1 activity through induced nuclear
localization [13]. To examine whether glutamine treat-
ment promotes O-glycosylation of Sp1 in HepG2 cells,
we performed immunoblotting analyses using the RL2
antibody, which recognizes N-acetylglucosamine
attached to a serine or threonine residue. Glutamine
elevated the O-glycosylated Sp1 level, whereas azaser-
ine completely abolished this effect and further
reduced the basal O-glycosylated Sp1 (Fig. 3B). More-
over, we examined whether glutamine induces the
translocation of Sp1 from the cytosol to the nucleus.
As shown in Fig. 3C, the amount of nuclear Sp1 was
**
**
0.0
0.5
1.0
1.5
2.0
SREBP-2
0.0
0.5
1.0
1.5
2.0
2.5
SREBP-1a
Relative mRNA level
*
**
A
2.5
3.0
CB
10 × Gln
+
Azaserine
+
+––
–
IP: anti-Sp1
IB: anti-O-GlcNAc
IB: anti-Sp1
1.0 1.2 0.7
Cytosol
Nuclear
Time after Gln (h)
IB: anti-Sp1
024
1.0 0.7 0.8
1.0 1.7 1.9
No addition
10 × Gln
10 × Gln + Sterols
10 × Gln + Azaserine
D
0.0
0.1
0.2
SREBP-1a promoter
0.4
anti-Sp1
0.3
0.0
0.1
0.2
SREBP-1a-distal
0.4
IgG anti-Sp1
0.3
% of input
IP: IgG
No addition
10 × Gln
E
0.0
0.5
1.0
1.5
2.0
SREBP-1a
2.5
siLuc siSp1
0.0
0.2
0.4
0.8
1.0
Sp1
1.2
siLuc siSp1
0.6
Relative mRNA level
**
No addition
10 × Gln
Fig. 3. Glutamine increases the mRNA levels of SREBPs and O-glycosylated Sp1. (A) HepG2 cells were cultured with the low amino acid
medium supplemented with a 10-fold excess of glutamine (10 · Gln, 40 m
M) for 12 h in the presence or absence of sterols (10 lgÆmL
)1
of
cholesterol plus 1 lgÆmL
)1
of 25-hydroxycholesterol) or 5 lM azaserine. Real-time PCR analysis was performed, and relative mRNA levels
were obtained after normalization to GAPDH mRNA. The mRNA levels without the glutamine addition are represented as 1. All data are pre-
sented as means ± SD of three independent experiments performed in triplicate. *P < 0.05; **P < 0.01. (B) HepG2 cells were cultured with
the low amino acid medium supplemented with or without a 10-fold excess of glutamine (10 · Gln, 40 m
M) in the presence or absence of
5 l
M azaserine for 12 h. The whole cell extracts were subjected to immunoprecipitation (IP) with anti-Sp1 antibody. Aliquots of immunopre-
cipitates were subjected to SDS ⁄ PAGE and immunoblot (IB) analysis with anti-O-GlcNAc or anti-Sp1 antibodies, and the signals were quanti-
fied with a Fujifilm LAS-3000 Luminoimager. Fold change was calculated by the ratio of the intensity between the O-glycosylated Sp1 and
the whole Sp1 signals. The ratio in the absence of both glutamine and azaserine was set as 1. The same results were obtained in more than
three separate experiments. (C) HepG2 cells were cultured with the low amino acid medium for 4 h and then re-fed with the medium sup-
plemented with a 10-fold excess of glutamine (10 · Gln, 40 m
M) for the indicated periods. The nuclear and cytosol fractions were prepared
as described previously [29] and the extracts were subjected to IB with Sp1 antibody; the signals were quantified with a Fujifilm LAS-3000
Luminoimager. The intensity at time 0 was set as 1. The same results were obtained in more than three separate experiments. (D) HepG2
cells were cultured with the low amino acid medium supplemented with a 10-fold excess of glutamine (10 · Gln, 40 m
M) for 6 h and pro-
cessed for chromatin immunoprecipitation analyses as described in Materials and methods. After IP with anti-Sp1 IgG, real-time PCR analy-
sis was performed with a primer set covering the Sp1-binding region or distal region in the human SREBP-1a promoter. The same results
were obtained in two separate experiments. (E) HepG2 cells were transfected with either control (siLuc) or Sp1 siRNA oligonucleotides
(siSp1), cultured with medium A for 96 h and re-fed with the medium containing a 10-fold excess of glutamine (10 · Gln, 40 m
M) for 24 h
before harvest. Real-time PCR analysis was performed, and the relative mRNA levels were obtained after normalization to GAPDH mRNA.
The mRNA levels transfected with siLuc without any glutamine addition are represented as 1. All data are presented as means ± SD of
three independent experiments performed in triplicate. **P < 0.01.
Glutamine stimulates SREBP activities J. Inoue et al.
2742 FEBS Journal 278 (2011) 2739–2750 ª 2011 The Authors Journal compilation ª 2011 FEBS
increased by 2 h after glutamine treatment, accompa-
nied by a reduction in the amount of cytosolic Sp1.
In order to determine whether glutamine increases the
binding of Sp1 to the SREBP-1a promoter region
containing the Sp1-binding elements, we performed a
chromatin immunoprecipitation assay. As shown in
Fig. 3D, glutamine increased the Sp1 binding to the
SREBP-1a promoter region but not the distal region
of the SREBP-1a gene, indicating a glutamine-depen-
dent recruitment of Sp1 to the SREBP-1a promoter.
We next examined whether the activation of Sp1 by
glutamine treatment is involved in the induction of
SREBP-1a gene expression. When endogenous Sp1
expression was reduced to 20% of normal with
gene-specific small interfering RNA (siRNA), the gene
expression of SREBP-1a was significantly decreased in
HepG2 cells (Fig. 3E), indicating that the basal gene
expression of SREBP-1a is under the control of Sp1.
Moreover, the elevation in the mRNA level of
SREBP-1a by glutamine was abolished by the knock-
down of Sp1 expression (Fig. 3E). These results sug-
gest that glutamine treatment facilitates Sp1 function
in HepG2 cells via its increased nuclear localization,
thereby stimulating SREBP-1a transcription.
Induction of SREBP gene expression is not the
initial trigger for the glutamine effects
If induction of the SREBP gene expression serves as
the initial trigger for the glutamine effects, the gene
expression of SREBPs should be induced prior to the
SREBP target gene. To test this prediction, time-
course experiments in the presence of glutamine were
performed in HepG2 cells. At 4 h after the addition of
glutamine, the gene expression of the SREBP targets,
such as HMG CoA synthase and the LDL receptor,
was slightly increased, but then the mRNA levels of
both SREBPs and their target genes became signifi-
cantly elevated at 8 and 12 h (Fig. 4). Based on the
fact that the increase in the mRNA of these genes was
nearly simultaneously observed at 8 h or later, it is
unlikely that the increased SREBP gene expression
served as the initial step for the glutamine effects.
Glutamine stimulates SREBP processing
In the above experiments, HepG2 cells were cultured
with a low amino acid medium in order to detect the
glutamine effects with a high sensitivity. Later it
turned out that the glutamine effects were reproduced
in cells incubated with DMEM which contained 4 mm
glutamine. Indeed, when HepG2 cells were cultured in
DMEM supplemented with a 10-fold excess of gluta-
mine (40 mm), the mRNA levels of SREBP family
members were significantly increased, as had occurred
in the cells cultured in the low amino acid medium
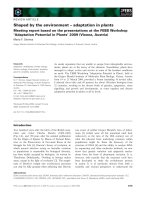
(Fig. S1). To investigate the effect of glutamine on
SREBP processing, HepG2 cells cultured with DMEM
were re-fed with a glutamine-supplemented medium
and incubated for the indicated time (Fig. 5A). The
whole cell extracts were subjected to immunoblotting
using anti-SREBP-1 and anti-SREBP-2 antibodies.
SREBP-1 was detected by an antibody recognizing its
N-terminus [SREBP-1(N)], and SREBP-2 was detected
by antibodies recognizing its N-terminus [SREBP-
2(N)] and C-terminus [SREBP-2(C)]. Two antibodies
recognizing the N-terminus of SREBP-1 and SREBP-2
detect their precursor and mature (nuclear) forms. In
contrast, SREBP-2(C) detects the precursor and the
cleaved form that remains in the Golgi after release of
the N-terminal mature form. As shown in Fig. 5A,
SREBP-1 and SREBP-2 processing was induced by
glutamine, as judged by the increase in the mature and
cleaved forms (‘mature’ or ‘cleaved’ in Fig. 5A). The
fact that the glutamine-induced SREBP processing
started as early as 0.5 h after glutamine treatment indi-
cates that the glutamine-induced post-translational
activation of SREBPs occurs prior to the stimulation
of the gene expression of SREBPs, which required 8 h
or longer (Fig. 4). Similar glutamine-stimulated
SREBP processing was observed when HepG2 cells
Relative mRNA level
0.0
2
4
8
12
0
1.0
2.0
3.0
4.0
6.0
HMG S
LDLR
Time (h)
8.0
0.0
1.0
2.0
3.0
4.0
6.0
8.0
SREBP-1a
SREBP-2
Fig. 4. The gene expression of SREBPs is not induced prior to the
SREBP target gene by glutamine. HepG2 cells were cultured with
the low amino acid medium for 4 h and then re-fed with the med-
ium supplemented with a 10-fold excess of glutamine (40 m
M) for
2, 4, 8 or 12 h, and then total RNA was isolated. Real-time PCR
analysis was performed, and the relative mRNA levels were
obtained after normalization to GAPDH mRNA. The mRNA levels at
time 0 are represented as 1. All data are presented as means ± SD
of three independent experiments performed in triplicate.
J. Inoue et al. Glutamine stimulates SREBP activities
FEBS Journal 278 (2011) 2739–2750 ª 2011 The Authors Journal compilation ª 2011 FEBS 2743
were cultured with the low amino acid medium, which
contained 0.25 mm glutamine (Fig. S2A,B). In order to
examine how high the glutamine concentration must
be to induce SREBP processing, HepG2 cells were
incubated with various concentrations of glutamine
(4, 10, 20, 30 or 40 mm) for 4 h. Figure 5B demon-
strates that SREBP processing is upregulated by gluta-
mine in a dose-dependent manner in HepG2 cells.
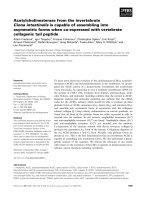
Glutamine accelerates the ER-to-Golgi transport
of the SREBP
⁄
SCAP complex
When SREBP precursors are processed to liberate
N-terminal active forms, the SREBP ⁄ SCAP complex
must be translocated to the Golgi, where two proteases
responsible for SREBP cleavage reside. Therefore, the
glutamine-induced SREBP processing is assumed to be
caused by an acceleration of the ER-to-Golgi translo-
cation of the SREBP ⁄ SCAP. To determine whether
the SREBP translocation is promoted by glutamine,
we adopted two in vitro assays. First, we performed
the reporter assay devised by Sakai et al. [14], which
monitors SREBP processing by determining the
secreted alkaline phosphatase activity. HEK293 cells
were cotransfected with the expression plasmids for
SCAP and the C-terminal half of SREBP-2 that was
fused to the secreted form of placental alkaline
phosphatase (PLAP-BP2). In agreement with previous
studies [14,15], the secreted PLAP activity was
increased when the cells were cultured in cholesterol-
depleted conditions only in the presence of SCAP
(data not shown). As shown in Fig. 6A, the PLAP
secretion was remarkably induced in the presence of
SCAP, and a 10-fold excess of glutamine significantly
enhanced the secretion. Since the PLAP cleavage is
mediated by S1P in this assay, it is possible that
glutamine stimulated the S1P activity. Alternatively,
glutamine might simply accelerate the ER-to-Golgi
transport of the PLAP-BP2 ⁄ SCAP complex. Second,
we used the SCAP-null CHO cells expressing GFP-
SCAP established by Nohturfft et al. [16] to determine
whether glutamine influences the movement of SCAP.
When the cells were cultured in medium C containing
2.5 mm glutamine, GFP-SCAP was diffusively distrib-
uted within the cells (Fig. 6B), which partially over-
lapped with the Golgi marker GM130 (Fig. 6C, D, H).
Treatment with a 10-fold excess of glutamine for 6 h
brought about a remarkable degree of overlap between
GFP-SCAP and GM130 (Fig. 6E–H), indicating that
GFP-SCAP had moved to the Golgi in response to
glutamine treatment. These data indicate that gluta-
mine treatment promotes the ER-to-Golgi transport of
the SREBP ⁄ SCAP complex, thereby stimulating
SREBP processing. Next, we examined whether
activating transcription factor 6 (ATF6) processing is
stimulated by glutamine, because ATF6 is also pro-
cessed by S1P and S2P after its translocation from ER
to the Golgi in response to ER stress. Unexpectedly,
glutamine suppressed the gene expression of ATF6
(Fig. 7A). However, the gene expression of BiP, which
is known to be an ATF6 target gene, was not altered
by glutamine treatment (Fig. 7A). Therefore, we next
Mature
IB: SREBP-1 (N)
A
Precursor
0 0.5 1 2 4
Precursor
Cleaved
IB: actin
B
Time after Gln (h)
410203040 Gln (m
M
)
Mature
Precursor
Mature
IB: SREBP-1 (N)
Precursor
Precursor
Cleaved
IB: actin
Mature
Precursor
8
IB: SREBP-2 (N)
IB: SREBP-2 (C)
IB: SREBP-2 (N)
IB: SREBP-2 (C)
Fig. 5. Glutamine stimulates the processing of both SREBP-1 and
SREBP-2. (A) HepG2 cells were cultured with medium A containing
4m
M glutamine for 48 h and re-fed with the medium containing a
10-fold excess of glutamine (40 m
M) for the indicated period of
time before harvest. The whole cell extracts were subjected to
SDS ⁄ PAGE and immunoblotting (IB) with anti-SREBP-1(N) (2A4),
anti-SREBP-2(N) (Rs004), anti-SREBP-2(C) (1C6) or anti-b-actin anti-
bodies. (B) HepG2 cells were cultured with medium A containing
4m
M glutamine for 40 h and then re-fed with the medium contain-
ing the indicated concentration of glutamine for 4 h. The whole cell
extracts were subjected to SDS ⁄ PAGE and IB with the antibodies
as described in (A). The same results were obtained in more than
three separate experiments.
Glutamine stimulates SREBP activities J. Inoue et al.
2744 FEBS Journal 278 (2011) 2739–2750 ª 2011 The Authors Journal compilation ª 2011 FEBS
determined whether glutamine stimulates ATF6
processing using exogenously expressed flag-tagged
ATF6a. HepG2 cells were transfected with the expres-
sion plasmid for Flag-ATF6a, and then treated with
either tunicamycin, an inhibitor of protein N-glycosyl-
ation, or glutamine. While treatment with tunicamycin,
which causes ER stress, increased the amount of the
processed form of Flag-ATF6a (denoted as N in
Fig. 7B, lanes 1 and 2), glutamine treatment had no
effect (Fig. 7B, lanes 4 and 5). These results indicate
that glutamine stimulates the ER-to-Golgi transport of
the SREBP ⁄ SCAP complex without any significant
influence on the S1P and S2P protease activities.
Cell swelling is not involved in the
glutamine-stimulated SREBP processing
The uptake of glutamine into HepG2 cells is mediated
by a sodium-dependent transporter [17]. When a large
amount of glutamine is taken up by cells, osmotic cell
2.5 m
M
Gln40 m
M
Gln
10
μ
m
B
CD
EF G
GFP - SCAP MergedGM130
0
5
10
15
20
SCAP
+–
A
PLAP-BP2 cleavage
(relative light units)
**
25
1 × Gln
10 × Gln
S1P
SCAP
ER
Golgi
PLAP
PLAP-BP2
Secretion into medium
0
10
20
Gln (m
M)
% of golgi localized
H
**
30
40
2.5 40
GFP-SCAP
Fig. 6. Glutamine stimulates the ER-to-Golgi transport of the
SREBP ⁄ SCAP complex. (A) HEK293 cells were transfected with
pCMV-PLAP-BP2(513-1141), pCMV-b-gal and either pCMV-SCAP or
its empty vector. After transfection, the cells were cultured with
the medium containing either 4 m
M (1 · Gln) or 40 mM (10 · Gln)
glutamine for 16 h. Then, aliquots of the medium were removed
and assayed for the PLAP activity. The data were normalized to the
cellular b-galactosidase activity as described in Materials and meth-
ods. All data are presented as means ± SD of three independent
experiments performed in triplicate. **P < 0.01. (B–G) Stably trans-
fected CHO ⁄ pGFP-SCAP cells were set up as described in Materi-
als and methods. On day 1, the cells were cultured with medium
C, which contained 2.5 m
M (B, C and D) or 40 mM (E, F and G) glu-
tamine, for 6 h. Then, the cells were fixed and incubated with the
primary antibody against GM130, and subsequently incubated with
the Cy3-conjugated secondary antibody. The cells were imaged for
GFP-SCAP (B and E) or GM130 (C and F). Panels D and G are
merged images of GFP-SCAP and the Golgi marker GM130. Scale
bar, 10 lm. (H) Quantification of the percentage of Golgi-localized
GFP-SCAP in (B)–(G). The signals were quantified with an ImageJ.
All data are presented as means ± SD of three independent experi-
ments.
0
0.8
0.6
1.0
1.2
ATF6
A
Relative mRNA level
1.4
10 × Gln
+
Flag-ATF6
++
IB: anti-Flag
Flag-ATF6
α
(P)
IB: anti-
β
-actin
++
Tunicamycin
+–
–– ––
–
––
–
B
Flag-ATF6
α
(P*)
Flag-ATF6
α
(N)
**
0.4
0.2
0
0.8
0.6
1.0
1.2
BiP
1.4
0.4
0.2
1 × Gln
10 × Gln
Fig. 7. Glutamine does not stimulate ATF6 processing. (A) HepG2
cells were cultured with medium A containing 4 m
M glutamine for
48 h and then re-fed with the medium containing either 4 m
M
(1 · Gln) or 40 mM (10 · Gln) glutamine for 24 h. Real-time PCR
analysis was performed, and the relative mRNA levels were
obtained after normalization to GAPDH mRNA. All data are pre-
sented as means ± SD of three independent experiments per-
formed in triplicate. **P < 0.01. (B) HepG2 cells transfected with
pCMV-Flag-ATF6 were treated with 3 lgÆmL
)1
tunicamycin for 4 h
or 40 m
M glutamine for 7 h. The whole cell extracts were sub-
jected to SDS ⁄ PAGE and immunoblotting (IB) with anti-Flag or anti-
b-actin antibodies. Flag-ATF6a(P*) denotes the non-glycosylated
form of pATF6a(P).
J. Inoue et al. Glutamine stimulates SREBP activities
FEBS Journal 278 (2011) 2739–2750 ª 2011 The Authors Journal compilation ª 2011 FEBS 2745
swelling often occurs. A previous report has demon-
strated that culture of CHO-7 cells with a hypotonic
medium caused osmotic cell swelling and the ER stress
that inhibits general protein synthesis, thereby stimu-
lating SREBP processing though a reduction in the
Insig-1 protein due to its rapid rate of turnover [18].
This raises the possibility that glutamine-mediated cell
swelling, if it occurs, could result in the stimulation of
SREBP processing though various ER stress responses.
Since both alanine and proline also induce cell swelling
[19], we examined the effect of these amino acids on
SREBP processing. While glutamine stimulated
SREBP processing, the same concentration of alanine
or proline did not influence SREBP processing
(Fig. 8), implying that an osmotic change, if it did
occur in the cells, was not involved in the stimulation
of SREBP processing by glutamine. In addition, the
effect of glutamate on SREBP processing was also
examined because glutamine is capable of being con-
verted to glutamate [20]. As shown in Fig. 8, treatment
with glutamate did not influence SREBP processing,
indicating that the SREBP processing induced by glu-
tamine is not mediated by glutamate function.
Furthermore, it has been reported that the acceler-
ated SREBP processing driven by osmotic cell swelling
is not inhibited by treatment with sterols because of
the reduction of Insig-1 protein level by cell swelling
[18]. In order to examine the effect of sterols on the
glutamine-induced SREBP processing, HepG2 cells
were treated with glutamine in the presence or absence
of sterols for 4 h, and then immunoblotting analyses
were performed. The stimulation of SREBP processing
by glutamine was completely attenuated by sterols
(Fig. 9). These results suggest that the stimulatory
effect of glutamine on SREBP processing is not medi-
ated by the reduction of Insig-1 protein level caused
by osmotic cell swelling in HepG2 cells.
PI3K-Akt pathway is involved in SREBP-1
processing but not in SREBP-2 processing
Next, we examined how glutamine stimulates SREBP
processing in HepG2 cells. One possible mechanism
could be that glutamine modulates certain protein
kinase signaling pathways, which in turn activates
SREBP processing. It has been reported that glutamine
stimulates Akt phosphorylation in HepG2 cells [21]
and both phosphatidylinositol 3-kinase (PI3K) and
p70 ribosomal protein S6 kinase (p70S6K) in rat
primary hepatocytes [22]. When HepG2 cells were trea-
ted with 40 mm glutamine for 1 h, the levels of active
phosphorylated Akt, which is a substrate of PI3K,
were increased (Fig. 10A). We were unable to detect
phosphorylated p70S6K despite the presence of gluta-
mine (data not shown). It has been shown that SREBP
processing is stimulated by the activation of the PI3K-
Akt [15,23,24] and mTORC-p70S6K1 pathways [25].
Therefore, we next treated cells with the PI3K inhibi-
tor LY294002 and the mTORC1 inhibitor rapamycin
to assess whether these kinase pathways are involved
in glutamine-stimulated SREBP processing. Interest-
ingly, LY294002 inhibited glutamine-stimulated
SREBP-1 processing, whereas it did not affect the stimu-
lation of SREBP-2 processing by glutamine (Fig. 10B).
In contrast, rapamycin did not influence glutamine-
induced SREBP processing (Fig. 10B). Taken together,
these results suggest that the PI3K signaling pathway
plays a key role in SREBP-1 processing in the presence
of glutamine but not in glutamine-stimulated SREBP-2
processing. Recent reports indicate that insulin enhances
SREBP-1 processing because of the phosphorylation of
precursor SREBP-1 that is induced by Akt, which in
turn enhances the affinity of the SREBP-1 ⁄ SCAP
complex for the Sec23 ⁄ 24 proteins of the COPII vesicles
and its transport to the Golgi apparatus [26]. Thus, it is
conceivable that the glutamine-stimulated SREBP-1
processing is mediated by the direct phosphorylation of
the precursor SREBP-1 induced by Akt. Further studies
are required to determine how the glutamine-activated
PI3K pathway is involved in SREBP-1 processing.
In conclusion, the present study shows that
treatment with glutamine causes the stimulation of
Gln– Ala Pro GluTreated amino acid (20 m
M
)
Mature
IB: anti-SREBP-1 (N)
Precursor
Precursor
Cleaved
IB: anti-SREBP-2( C)
IB: anti-
β
-actin
Fig. 8. Treatment with alanine, proline or glutamate does not stim-
ulate SREBP processing. HepG2 cells were cultured with medium
A containing 4 m
M glutamine for 48 h and re-fed with the medium
containing the indicated amino acid at a concentration of 20 m
M for
4 h before harvest. The whole cell extracts were subjected to
SDS ⁄ PAGE and immunoblotting (IB) with anti-SREBP-1(N), anti-
SREBP-2(C) or anti-b-actin antibodies. The same results were
obtained in more than three separate experiments.
Glutamine stimulates SREBP activities J. Inoue et al.
2746 FEBS Journal 278 (2011) 2739–2750 ª 2011 The Authors Journal compilation ª 2011 FEBS
SREBP-1a gene expression in HepG2 cells due to
the activation of hexosamine biosynthesis pathway.
Furthermore, the post-translational processing of
SREBPs is stimulated by treatment with glutamine.
Since it is well known that the activation of SREBPs
stimulates the synthesis of lipids such as fatty acids
and cholesterol, the new concept presented here is that
glutamine acts as a stimulator of SREBP activities in
addition to serving as a nutrient and ⁄ or signaling mol-
ecule. These multiple and combined effects of gluta-
mine may fulfill the cellular demand for lipids that is
physiologically necessary for rapid cellular growth.
Given that serum glutamine concentration is approxi-
mately 1 mm and rarely reaches 10 mm, glutamine has
a low potential for affecting SREBP processing in the
liver. In contrast, because it is assumed that the gluta-
mine concentration in the cells of the small intestine
could transiently and sufficiently increase just after the
intake of glutamine-rich foods, amino acids may
strongly activate SREBPs in vivo, as was observed with
the cultured cells in this study. Further studies are
required to determine whether glutamine-stimulated
SREBP activities contribute to the rapid growth of
cultured cells and whether dietary glutamine activates
SREBP in the liver and intestine in vivo.
Materials and methods
Materials
Cholesterol, 25-hydroxycholesterol, lipoprotein-deficient
serum, dialyzed fetal bovine serum, azaserine, tunicamycin,
LY294002 and rapamycin were purchased from Sigma
(St Louis, MO, USA). DMEM and DMEM ⁄ Ham’s F-12
medium were from Wako (Osaka, Japan).
Low amino acid medium
The low amino acid medium [8] was kindly provided by
Ajinomoto (Kawasaki, Japan). It contains comparatively
low concentrations of 20 amino acids compared with
DMEM. The amino acid concentrations are as follows:
5 lm Trp; 12.5 lm Cys, Met, His; 25 lm Gly, Ala, Ser,
Asn, Glu, Asp, Phe, Typ, Arg, Pro; 50 l m Thr, Val, Leu,
Ile, Lys; 250 lm Gln.
Precursor
10 × Gln
+––
––
Sterols
+
++
IB: SREBP-1 (N)
Mature
Precursor
Mature
IB: actin
Precursor
Cleaved
IB: SREBP-2 (N)
IB: SREBP-2 (C)
Fig. 9. Stimulation of SREBP processing by glutamine is attenu-
ated by sterols. HepG2 cells were cultured with medium A contain-
ing 4 m
M glutamine for 48 h and re-fed with a 10-fold excess of
glutamine (10 · Gln, 40 m
M) containing medium in the presence
or absence of sterols (10 lgÆmL
)1
of cholesterol plus 1 lgÆmL
)1
of
25-hydroxycholesterol) for 4 h before harvest. The whole cell
extracts were subjected to SDS ⁄ PAGE and immunoblotting (IB)
with anti-SREBP-1(N), anti-SREBP-2(N), anti-SREBP-2(C) or anti-b-
actin antibodies. The same results were obtained in more than
three separate experiments.
01 4Time after Gln (h)
IB: p-Akt
IB: Akt
LY294002
+––
––
IB: SREBP-1 (N)
Mature
Precursor
IB: actin
Precursor
Cleaved
Time after Gln (h)
0044
IB: SREBP-2 (C)
B
A
+
04
Rapamycin
Fig. 10. Glutamine activates the PI3K-Akt pathway, and the inhibi-
tor of this pathway differentially affects the processing of SREBP-1
and SREBP-2. (A) HepG2 cells were cultured with medium A con-
taining 4 m
M glutamine for 48 h and re-fed with a 10-fold excess of
glutamine (40 m
M) containing medium for the indicated period of
time before harvest. Whole cell extracts were subjected to
SDS ⁄ PAGE and immunoblotting (IB) with anti-phospho-Akt (Ser473)
and anti-Akt antibodies. (B) HepG2 cells were cultured with med-
ium A containing 4 m
M glutamine for 48 h. After pre-incubation
with or without 10 l
M LY294002 or 25 nM rapamycin for 30 min,
the cells were re-fed with a 10-fold excess of glutamine (40 m
M)
containing medium in the presence or absence of either 10 l
M
LY294002 or 25 nM rapamycin for 4 h before harvest. The whole
cell extracts were subjected to SDS ⁄ PAGE and IB with anti-
SREBP-1(N), anti-SREBP-2(C) or anti-b-actin antibodies. The same
results were obtained in triplicate experiments.
J. Inoue et al. Glutamine stimulates SREBP activities
FEBS Journal 278 (2011) 2739–2750 ª 2011 The Authors Journal compilation ª 2011 FEBS 2747
Cell culture
HEK293T and HepG2 cells were maintained in medium A
(DMEM supplemented with 100 unitsÆmL
)1
penicillin,
100 lgÆmL
)1
streptomycin and 10% fetal bovine serum).
Caco-2 cells were maintained in medium B (DMEM supple-
mented with 100 unitsÆmL
)1
penicillin, 100 lgÆmL
)1
strepto-
mycin, nonessential amino acids and 10% fetal bovine
serum). CHO ⁄ pGFP-SCAP cells were maintained in
medium C (DMEM ⁄ Ham’s F-12 supplemented with 100
unitsÆmL
)1
penicillin, 100 lgÆmL
)1
streptomycin and 5%
lipoprotein-deficient serum). Cells were incubated at 37 °C
under 5% CO
2
atmosphere.
Plasmid constructs
Reporter plasmids, pHMG S containing the human HMG
CoA synthase promoter, pHMG S SREKO containing a
mutated sequence of the SRE, pSQS containing the human
SQS promoter, pSQS SREKO containing two mutated
SREs, pLDLR containing the human LDL receptor pro-
moter, and pMTP containing the human MTP promoter
were described previously [27,28]. A reporter plasmid,
pCPT1A, was constructed by inserting a 2.8-kb PCR
fragment coding the 5¢-promoter region and intron 1
(–286 ⁄ +2540) of the human CPT1A gene into a pGL4
basic vector (Promega, Madison, WI, USA). An expression
plasmid pCMV-PLAP-BP2(513-1141) encodes an 1136
amino acid fusion protein consisting of an initiator methio-
nine followed by the secreted form of human PLAP (amino
acids 2–506), one novel amino acid (Y) generated by blunt
ligation, and the COOH-terminal half of human SREBP-2
(amino acids 513–1141). pCMV-PLAP-BP2(513-1141) was
constructed according to the method reported in a previous
paper [14]. An expression plasmid for pCMV-SCAP was
constructed by inserting a 4.3-kb Bgl II-ClaI PCR fragment
coding full length human SCAP into the same restriction
sites of the pCMV vector (Stratagene, Santa Clara, CA,
USA). An expression plasmid for Flag-ATF6 was con-
structed by inserting a 1.7-kb BglII-XbaI PCR fragment
coding full length human ATF6 into the same restriction
sites of the p3 · FLAG-CMV vector (Sigma).
Antibodies
Monoclonal anti-SREBP-1 (2A4), anti-SREBP-2 (1C6) and
polyclonal anti-Sp1 (PEP2) were obtained from Santa Cruz.
Monoclonal anti-b-actin (AC-15) was from Sigma. Mono-
clonal anti-GM130 (35) was from BD Biosciences (Franklin
Lakes, NJ, USA). Monoclonal anti-O-GlcNAC (RL2) was
from Thermo Scientific (Waltham, MA, USA). Polyclonal
anti-Sp1 used for chromatin immunoprecipitation assays
was from Millipore (Billerica, MA, USA). Polyclonal anti-
Akt and anti-phospho-Akt were from Cell Signaling Tech-
nology (Beverly, MA, USA). Peroxidase-conjugated affinity
purified goat anti-rabbit IgG, peroxidase-conjugated
affinity purified goat anti-mouse IgG and Cy3-conjugated
affinity purified donkey anti-mouse IgG were from Jackson
Immunoresearch Laboratories (West Grove, PA, USA). The
anti-SREBP-2 polyclonal serum (Rs004) has been described
previously [11].
Luciferase assays
HepG2 cells and Caco-2 cells were plated in 12-well plates at
a density of 1.0 · 10
5
cellsÆwell
)1
, cultured with DMEM for
20 h, and then transfected with 200 ng of one of the reporter
plasmids and 200 ng pEF-b-Gal, an expression plasmid for
b-galactosidase, by the calcium phosphate method. Twenty-
four hours later, the medium was replaced with the low
amino acid medium supplemented with 5% dialyzed fetal
bovine serum and the indicated concentration of glutamine.
After incubation for another 12 h, the luciferase and b-galac-
tosidase activities were measured as described previously [28].
Normalized luciferase values were determined by dividing the
luciferase activity by the b-galactosidase activity.
Real-time PCR
Total RNA was extracted from HepG2 cells using an
RNeasy mini kit (Qiagen, Valencia, CA, USA) according
to the manufacturer’s instructions. cDNA was synthesized
and amplified from 2 lg total RNA using a high capacity
cDNA reverse transcription kit (Applied Biosystems, Foster
City, CA, USA). Quantitative real-time PCR (Taqman
probe and SYBR green) analysis was performed on an
Applied Biosystems 7000 sequence detection system.
Expression was normalized to glyceraldehyde-3-phosphate
dehydrogenase (GAPDH) control. The TaqMan ID num-
ber for genes analyzed are as follows: SREBP-2,
Hs00231882_m1; LDL receptor, Hs00181192_m1; HMG-
CoA synthase, Hs00266810_m1; CPT1A, Hs00157079_m1;
Sp1, Hs00916521_m1; GAPDH, 4352934. The sequences of
the primer sets used were as follows: SREBP-1a, 5¢ -TCAG
CGAGGCGGCTTTGGAGCAG-3¢ and 5¢-CATGTCTTC
GATGTCGGTCAG-3¢ [9]; ATF6, 5¢-ATGTCTCCCCTTT
CCTTATATGGT-3¢ and 5¢-AAGGCTTGGGCTGAATT
GAA-3¢; BiP, 5¢-GACCTGGGGACCACCTACTC-3¢ and
5¢-TTCAGGAGTGAAGGCGACAT-3¢.
Chromatin immunoprecipitation assays
Chromatin immunoprecipitation assays were performed as
described previously [14]. Real-time PCR was performed
with the following primers: SREBP-1a promoter region for-
ward (5¢-CGAGGCTGGATAAAATGAATGA-3¢), SRE
BP-1a promoter region reverse (5¢-GGTCTGCGCCACAA
ATCTC-3¢), SREBP-1a distal region forward (5¢-AAAGTA
CATAAAAGACAATGACCATCAC-3¢) and SREBP-1a distal
region reverse (5¢-CTTGAGTTGTTTCTCTGCAGCTT-3¢).
Glutamine stimulates SREBP activities J. Inoue et al.
2748 FEBS Journal 278 (2011) 2739–2750 ª 2011 The Authors Journal compilation ª 2011 FEBS
siRNA experiments
siRNA (150 pmol per six-well plate) for human Sp1
(Stealth RNAi, VHS40867; Invitrogen, Carlsbad, CA,
USA), with luciferase as a control (GL2 Luciferase, Bonac
Co., Fukuoka, Japan), were transfected using lipofectamine
RNAiMAX (Invitrogen) into HepG2 cells according to the
manufacturer’s instructions.
Immunoblotting
Cells were treated as described in the figure captions. The
cells were lysed in RIPA buffer (50 mm Tris ⁄ HCl, pH 8.0,
150 mm NaCl, 0.1% SDS, 0.5% deoxycholate and 1%
Triton X-100) supplemented with protease inhibitors. The
lysates were subjected to SDS ⁄ PAGE, transferred onto a
poly(vinylidene difluoride) membrane and probed with the
antibodies indicated in the figure captions. The immuno-
reactive proteins were visualized using ECL (GE Health-
care, Milwaukee, WI, USA) or Immobilon (Millipore)
western blotting detection reagents. The signals on the
membrane were quantified with a LAS-3000 Luminoimager
(Fujifilm, Tokyo, Japan).
Assays for secreted alkaline phosphatase
HEK293T cells were plated in 12-well plates at a density of
2.0 · 10
5
cellsÆwell
)1
, cultured with medium A for 20 h, and
then transfected with 500 ng of pCMV-PLAP-BP2 (513-
1141), 50 ng of pCMV-b-gal and 300 ng of either pCMV-
SCAP or pcDNA 3 empty vector by the calcium phosphate
method. After 4 h of incubation, the cells were re-fed with
fresh medium A containing the indicated concentration of
glutamine. After incubation for another 24 h, the medium
was collected for determination of secreted PLAP using a
Phospha-Light system (Applied Biosystems), as described
previously [14]. After removal of the medium, the cells were
lysed and then measured for b-galactosidase activity.
To normalize differences in transfection efficiency, the
PLAP activity was divided by the b-galactosidase activity.
Immunofluorescence staining and fluorescence
microscopy
CHO ⁄ pGFP-SCAP cells, a stable cell line expressing GFP-
SCAP [16], were plated on a human fibronectin cellware
four-well culture slide (BD Biocoat, Franklin Lakes, NJ,
USA), cultured with medium C for 20 h, and then re-fed
with fresh medium C containing the indicated concentration
of glutamine. After incubation for another 6 h, the cells were
fixed with 4% paraformaldehyde ⁄ phosphate buffered saline
(NaCl ⁄ P
i
), penetrated with 0.2% Triton X-100 ⁄ NaCl ⁄ P
i
,
blocked with 2% bovine serum albumin ⁄ NaCl ⁄ P
i
, treated
with anti-GM130 serum and subjected to reaction with Cy3-
conjugated secondary antibody. Then the cells were mounted
on glass slides with Mount aqueous mounting medium
(Sigma) and visualized with a laser-scanning IX70 micro-
scope (Olympus, Tokyo, Japan) equipped with a DP71 digi-
tal camera (Olympus). Subcellular localization of GFP-fused
SCAP was also determined.
Acknowledgements
We thank Drs Joseph L. Goldstein, Michael S. Brown
and Andrew J. Brown for generously sharing their
valuable tools. We also thank Dr Ken-ichi Nishida
(Daiichi-Sankyo) for expression plasmids. We are
grateful to Dr Kevin Boru of Pacific Edit for review of
the manuscript. This work was supported by research
grants from the Ministry of Education, Culture,
Sports, Science and Technology of Japan (R.S.), Nag-
ase Science and Technology Foundation (R.S.), the
Salt Science Research Foundation, no. 0916 (J.I.) and
Nestle Nutrition Council, Japan (J.I.).
References
1 Varga J, Li L, Mauviel A, Jeffrey J & Jimenez SA
(1994) L-Tryptophan in supraphysiologic concentrations
stimulates collagenase gene expression in human skin
fibroblasts. Lab Invest 70, 183–191.
2 Quillard M, Husson A & Lavoinne A (1996) Glutamine
increases argininosuccinate synthetase mRNA levels in
rat hepatocytes. The involvement of cell swelling. Eur J
Biochem 236, 56–59.
3 Dudek SM & Semenkovich CF (1995) Essential amino
acids regulate fatty acid synthase expression through an
uncharged transfer RNA-dependent mechanism. J Biol
Chem 270, 29323–29329.
4 Guerrini L, Gong SS, Mangasarian K & Basilico C
(1993) Cis- and trans-acting elements involved in amino
acid regulation of asparagine synthetase gene expres-
sion. Mol Cell Biol 13, 3202–3212.
5 Marten NW, Burke EJ, Hayden JM & Straus DS
(1994) Effect of amino acid limitation on the expression
of 19 genes in rat hepatoma cells. FASEB J 8, 538–544.
6 Dioguardi FS (2004) Wasting and the substrate-to-
energy controlled pathway: a role for insulin resistance
and amino acids. Am J Cardiol 93, 6A–12A.
7 Brown MS & Goldstein JL (1999) A proteolytic pathway
that controls the cholesterol content of membranes, cells,
and blood. Proc Natl Acad Sci USA 96, 11041–11048.
8 Eagle H, Oyama VI, Levy M, Horton CL & Fleischman
R (1956) The growth response of mammalian cells in
tissue culture to L-glutamine and L-glutamic acid.
J Biol Chem 218, 607–616.
9 Shimomura I, Shimano H, Horton JD, Goldstein JL &
Brown MS (1997) Differential expression of exons 1a
and 1c in mRNAs for sterol regulatory element binding
J. Inoue et al. Glutamine stimulates SREBP activities
FEBS Journal 278 (2011) 2739–2750 ª 2011 The Authors Journal compilation ª 2011 FEBS 2749
protein-1 in human and mouse organs and cultured
cells. J Clin Invest 99, 838–845.
10 Toth JI, Datta S, Athanikar JN, Freedman LP &
Osborne TF (2004) Selective coactivator interactions in
gene activation by SREBP-1a and -1c. Mol Cell Biol 24,
8288–8300.
11 Sato R, Inoue J, Kawabe Y, Kodama T, Takano T &
Maeda M (1996) Sterol-dependent transcriptional regu-
lation of sterol regulatory element-binding protein-2.
J Biol Chem 271, 26461–26464.
12 Zhang C, Shin DJ & Osborne TF (2005) A simple pro-
moter containing two Sp1 sites controls the expression
of sterol-regulatory-element-binding protein 1a
(SREBP-1a). Biochem J 386, 161–168.
13 Brasse-Lagnel C, Fairand A, Lavoinne A & Husson
A (2003) Glutamine stimulates argininosuccinate
synthetase gene expression through cytosolic O-glyco-
sylation of Sp1 in Caco-2 cells. J Biol Chem 278,
52504–52510.
14 Sakai J, Rawson RB, Espenshade PJ, Cheng D, Seegm-
iller AC, Goldstein JL & Brown MS (1998) Molecular
identification of the sterol-regulated luminal protease
that cleaves SREBPs and controls lipid composition of
animal cells. Mol Cell 2, 505–514.
15 Du X, Kristiana I, Wong J & Brown AJ (2006) Involve-
ment of Akt in ER-to-Golgi transport of SCAP ⁄ SREBP:
a link between a key cell proliferative pathway and
membrane synthesis. Mol Biol Cell 17, 2735–2745.
16 Nohturfft A, Yabe D, Goldstein JL, Brown MS &
Espenshade PJ (2000) Regulated step in cholesterol
feedback localized to budding of SCAP from ER
membranes. Cell 102, 315–323.
17 Bode BP, Fuchs BC, Hurley BP, Conroy JL, Suetterlin
JE, Tanabe KK, Rhoads DB, Abcouwer SF & Souba
WW (2002) Molecular and functional analysis of gluta-
mine uptake in human hepatoma and liver-derived cells.
Am J Physiol Gastrointest Liver Physiol 283,
G1062–G1073.
18 Lee JN & Ye J (2004) Proteolytic activation of sterol
regulatory element-binding protein induced by cellular
stress through depletion of Insig-1. J Biol Chem 279,
45257–45265.
19 Baquet A, Hue L, Meijer AJ, van Woerkom GM &
Plomp PJ (1990) Swelling of rat hepatocytes stimulates
glycogen synthesis. J Biol Chem 265, 955–959.
20 Kovacevic Z & McGivan JD (1983) Mitochondrial
metabolism of glutamine and glutamate and its physio-
logical significance. Physiol Rev 63, 547–605.
21 van Meijl LE, Popeijus HE & Mensink RP (2010)
Amino acids stimulate Akt phosphorylation, and reduce
IL-8 production and NF-kappaB activity in HepG2
liver cells. Mol Nutr Food Res 54, 1568–1573.
22 Krause U, Rider MH & Hue L (1996) Protein kinase
signaling pathway triggered by cell swelling and
involved in the activation of glycogen synthase and
acetyl-CoA carboxylase in isolated rat hepatocytes.
J Biol Chem 271, 16668–16673.
23 Demoulin JB, Ericsson J, Kallin A, Rorsman C, Ronn-
strand L & Heldin CH (2004) Platelet-derived growth
factor stimulates membrane lipid synthesis through activa-
tion of phosphatidylinositol 3-kinase and sterol regulatory
element-binding proteins. JBiolChem279, 35392–35402.
24 Chang Y, Wang J, Lu X, Thewke DP & Mason RJ
(2005) KGF induces lipogenic genes through a PI3K
and JNK ⁄ SREBP-1 pathway in H292 cells. J Lipid Res
46, 2624–2635.
25 Duvel K, Yecies JL, Menon S, Raman P, Lipovsky AI,
Souza AL, Triantafellow E, Ma Q, Gorski R, Cleaver S
et al. (2010) Activation of a metabolic gene regulatory
network downstream of mTOR complex 1. Mol Cell 39
,
171–183.
26 Yellaturu CR, Deng X, Cagen LM, Wilcox HG, Mans-
bach CM II, Siddiqi SA, Park EA, Raghow R & Elam
MB (2009) Insulin enhances post-translational process-
ing of nascent SREBP-1c by promoting its phosphoryla-
tion and association with COPII vesicles. J Biol Chem
284, 7518–7532.
27 Inoue J, Sato R & Maeda M (1998) Multiple DNA ele-
ments for sterol regulatory element-binding protein and
NF-Y are responsible for sterol-regulated transcription
of the genes for human 3-hydroxy-3-methylglutaryl
coenzyme A synthase and squalene synthase. J Biochem
123, 1191–1198.
28 Sato R, Miyamoto W, Inoue J, Terada T, Imanaka T
& Maeda M (1999) Sterol regulatory element-binding
protein negatively regulates microsomal triglyceride
transfer protein gene transcription. J Biol Chem 274,
24714–24720.
29 Hirano Y, Yoshida M, Shimizu M & Sato R (2001)
Direct demonstration of rapid degradation of nuclear ste-
rol regulatory element-binding proteins by the ubiquitin-
proteasome pathway. J Biol Chem 276, 36431–36437.
Supporting information
The following supplementary material is available:
Fig. S1. DMEM containing 10 · Gln stimulates the
mRNA levels of SREBP family members.
Fig. S2. Glutamine stimulates SREBP processing in
HepG2 cells cultured with the low amino acid medium.
This supplementary material can be found in the
online version of this article.
Please note: As a service to our authors and readers,
this journal provides supporting information supplied
by the authors. Such materials are peer-reviewed and
may be re-organized for online delivery, but are not
copy-edited or typeset. Technical support issues arising
from supporting information (other than missing files)
should be addressed to the authors.
Glutamine stimulates SREBP activities J. Inoue et al.
2750 FEBS Journal 278 (2011) 2739–2750 ª 2011 The Authors Journal compilation ª 2011 FEBS