Cancer Facts & Figures 2012 - Special Section: Cancers with Increasing Incidence Trends pot
Bạn đang xem bản rút gọn của tài liệu. Xem và tải ngay bản đầy đủ của tài liệu tại đây (1.69 MB, 68 trang )
Cancer Facts
& Figures 2012
Special Section:
Cancers with Increasing
Incidence Trends
see page 25
AL
26,440
AZ
31,990
AR
16,120
CA
165,810
CO
22,820
CT 21,530
DE 5,340
FL
117,580
GA
48,130
ID
7,720
IL
65,750
IN
35,060
IA
17,010
KS
14,090
KY
25,160
LA
23,480
ME
8,990
MD 31,000
MA
38,470
MN
28,060
MS
15,190
MO
33,440
MT
5,550
NE
9,030
NV
13,780
NH
8,350
NJ 50,650
NM
9,640
NY
109,440
NC
51,860
ND
3,510
OH
66,560
OK
19,210
OR
21,370
PA
78,340
RI
6,310
SC
26,570
SD
4,430
TN
35,610
TX
110,470
UT
10,620
VT
4,060
VA
41,380
WA
35,790
WV
11,610
WI
31,920
WY
2,650
DC 2,980
HI
6,610
AK
3,640
MI
57,790
PR
N/A
US
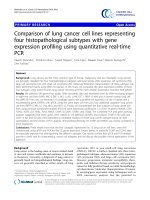
1,638,910
Estimated numbers of new cancer cases for 2012, excluding basal and squamous cell skin cancers and in situ carcinomas except urinary bladder.
Note:
State estimates are offered as a rough guide and should be interpreted with caution. State estimates may not add to US total due to rounding.
Contents
Basic Cancer Facts 1
Age-adjusted Cancer Death Rates, Males by Site, US, 1930-2008* 2
Age-adjusted Cancer Death Rates, Females by Site, US, 1930-2008* 3
Estimated New Cancer Cases and Deaths by Sex, US, 2012* 4
Estimated Numbers of New Cases for Selected Cancers by State, US, 2012* 5
Estimated Numbers of Deaths for Selected Cancers by State, US, 2012* 6
Incidence Rates for Selected Cancers by State, US, 2004-2008* 7
Death Rates for Selected Cancers by State, US, 2004-2008* 8
Selected Cancers 9
Leading New Cancer Cases and Deaths – 2012 Estimates* 10
Probability (%) of Developing Invasive Cancers over Selected Age Intervals by Sex, US, 2006-2008* 14
Five-year Relative Survival Rates (%) by Stage at Diagnosis, 2001-2007* 17
Trends in 5-year Relative Survival Rates (%) by Race, US, 1975-2007* 18
Special Section: Cancers with Increasing Incidence Trends in the US: 1999-2008 25
Tobacco Use 36
Annual Number of Cancer Deaths Attributable to Smoking by Sex and Site, US, 2000-2004* 37
Cancer Disparities 43
Cancer Incidence and Death Rates by Site, Race, and Ethnicity, US, 2004-2008* 44
Geographic Patterns in Lung Cancer Death Rates by State, US, 2004-2008* 45
Nutrition and Physical Activity 48
Environmental Cancer Risks 51
The Global Fight against Cancer 53
The American Cancer Society 54
Sources of Statistics 62
Screening Guidelines for the Early Detection of Cancer in Average-risk Asymptomatic People* 64
*Indicates a figure or table
National Home Office: American Cancer Society Inc.
250 Williams Street, NW, Atlanta, GA 30303-1002
(404) 320-3333
©2012, American Cancer Society, Inc. All rights reserved,
including the right to reproduce this publication
or portions thereof in any form.
For written permission, address the Legal department of
the American Cancer Society, 250 Williams Street, NW,
Atlanta, GA 30303-1002.
This publication attempts to summarize current scientific information about cancer.
Except when specified, it does not represent the official policy of the American Cancer Society.
Suggested citation: American Cancer Society. Cancer Facts & Figures 2012. Atlanta: American Cancer Society; 2012.
Basic Cancer Facts
What Is Cancer?
Cancer is a group of diseases characterized by uncontrolled
growth and spread of abnormal cells. If the spread is not con-
trolled, it can result in death. Cancer is caused by both external
factors (tobacco, infectious organisms, chemicals, and radiation)
and internal factors (inherited mutations, hormones, immune
conditions, and mutations that occur from metabolism). These
causal factors may act together or in sequence to initiate or pro-
mote the development of cancer. Ten or more years often pass
between exposure to external factors and detectable cancer.
Cancer is treated with surgery, radiation, chemotherapy, hormone
therapy, biological therapy, and targeted therapy.
Can Cancer Be Prevented?
All cancers caused by cigarette smoking and heavy use of alcohol
could be prevented completely. The American Cancer Society
estimates that in 2012 about 173,200 cancer deaths will be caused
by tobacco use. Scientific evidence suggests that about one-third
of the 577,190 cancer deaths expected to occur in 2012 will be
related to overweight or obesity, physical inactivity, and poor
nutrition and thus could also be prevented. Certain cancers are
related to infectious agents, such as hepatitis B virus (HBV),
human papillomavirus (HPV), human immunodeficiency virus
(HIV), Helicobacter pylori (H. pylori), and others, and could be pre-
vented through behavioral changes, vaccines, or antibiotics. In
addition, many of the more than 2 million skin cancers that are
diagnosed annually could be prevented by protecting skin from
intense sun exposure and avoiding indoor tanning.
Regular screening examinations by a health care professional
can result in the detection and removal of precancerous growths,
as well as the diagnosis of cancers at an early stage, when they
are most treatable. Cancers of the cervix, colon, and rectum can
be prevented by removal of precancerous tissue. Cancers that
can be diagnosed early through screening include cancers of the
breast, colon, rectum, cervix, prostate, oral cavity, and skin.
However, screening is known to reduce mortality only for cancers
of the breast, colon, rectum, and cervix. A heightened awareness
of changes in the breast or skin may also result in detection of
these tumors at earlier stages. Cancers that can be prevented or
detected earlier by screening account for at least half of all new
cancer cases.
Who Is at Risk of Developing Cancer?
Anyone can develop cancer. Since the risk of being diagnosed
with cancer increases with age, most cases occur in adults who
are middle aged or older. About 77% of all cancers are diagnosed
in persons 55 years of age and older. Cancer researchers use the
word “risk” in different ways, most commonly expressing risk as
lifetime risk or relative risk.
Lifetime risk refers to the probability that an individual will
develop or die from cancer over the course of a lifetime. In the
US, men have slightly less than a 1 in 2 lifetime risk of developing
cancer; for women, the risk is a little more than 1 in 3.
Relative risk is a measure of the strength of the relationship
between risk factors and a particular cancer. It compares the risk
of developing cancer in persons with a certain exposure or trait
to the risk in persons who do not have this characteristic. For
example, male smokers are about 23 times more likely to develop
lung cancer than nonsmokers, so their relative risk is 23. Most
relative risks are not this large. For example, women who have a
first-degree relative (mother, sister, or daughter) with a history
of breast cancer have about twice the risk of developing breast
cancer, compared to women who do not have this family history.
All cancers involve the malfunction of genes that control cell
growth and division. About 5% of all cancers are strongly heredi-
tary, in that an inherited genetic alteration confers a very high
risk of developing one or more specific types of cancer. However,
most cancers do not result from inherited genes but from damage
to genes occurring during one’s lifetime. Genetic damage may
result from internal factors, such as hormones or the metabolism
of nutrients within cells, or external factors, such as tobacco,
chemicals, and excessive exposure to sunlight.
How Many People Alive Today Have Ever
Had Cancer?
The National Cancer Institute estimates that nearly 12 million
Americans with a history of cancer were alive in January 2008.
Some of these individuals were cancer free, while others still had
evidence of cancer and may have been undergoing treatment.
How Many New Cases Are Expected to Occur
This Year?
About 1,638,910 new cancer cases are expected to be diagnosed
in 2012. This estimate does not include carcinoma in situ (nonin-
vasive cancer) of any site except urinary bladder, and does not
include basal and squamous cell skin cancers, which are not
required to be reported to cancer registries.
How Many People Are Expected to Die
of Cancer This Year?
In 2012, about 577,190 Americans are expected to die of cancer,
more than 1,500 people a day. Cancer is the second most com-
mon cause of death in the US, exceeded only by heart disease,
accounting for nearly 1 of every 4 deaths.
What Percentage of People Survive Cancer?
The 5-year relative survival rate for all cancers diagnosed
between 2001 and 2007 is 67%, up from 49% in 1975-1977 (see
page 18). The improvement in survival reflects both progress in
diagnosing certain cancers at an earlier stage and improvements
Cancer Facts & Figures 2012 1
2 Cancer Facts & Figures 2012
in treatment. Survival statistics vary greatly by cancer type and
stage at diagnosis. Relative survival compares survival among
cancer patients to that of people not diagnosed with cancer who
are of the same age, race, and sex. It represents the percentage of
cancer patients who are alive after some designated time period
(usually 5 years) relative to persons without cancer. It does not
distinguish between patients who have been cured and those
who have relapsed or are still in treatment. While 5-year relative
survival is useful in monitoring progress in the early detection
and treatment of cancer, it does not represent the proportion of
people who are cured permanently, since cancer deaths can
occur beyond 5 years after diagnosis.
Although relative survival for specific cancer types provides
some indication about the average survival experience of cancer
patients in a given population, it may or may not predict indi-
vidual prognosis and should be interpreted with caution. First,
5-year relative survival rates for the most recent time period are
based on patients who were diagnosed from 2001 to 2007 and
thus, do not reflect recent advances in detection and treatment.
Second, factors that influence survival, such as treatment proto-
cols, other illnesses, and biological or behavioral differences of
each individual, cannot be taken into account in the estimation
of relative survival rates. For more information about survival
rates, see Sources of Statistics on page 62.
Lung & bronchus
Colon & rectum
Pancreas
Liver
Leukemia
Prostate
Stomach
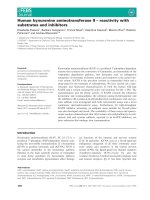
*Per 100,000, age adjusted to the 2000 US standard population.
Note: Due to changes in ICD coding, numerator information has changed over time. Rates for cancer of the liver, lung and bronchus, and colon and rectum are affected
by these coding changes.
Source: US Mortality Volumes 1930 to 1959, US Mortality Data 1960 to 2008, National Center for Health Statistics, Centers for Disease Control and Prevention.
©2012, American Cancer Society, Inc., Surveillance Research
Rate per 100,000 male population
0
20
40
60
80
100
2005200019951990198519801975197019651960195519501945194019351930
Age-adjusted Cancer Death Rates,* Males by Site, US, 1930-2008
How Is Cancer Staged?
Staging describes the extent or spread of the disease at the time of
diagnosis. Proper staging is essential in determining the choice of
therapy and in assessing prognosis. A cancer’s stage is based on the
primary tumor’s size and whether it has spread to other areas of
the body. A number of different staging systems are used to classify
tumors. The TNM staging system assesses tumors in three ways:
extent of the primary tumor (T), absence or presence of regional
lymph node involvement (N), and absence or presence of distant
metastases (M). Once the T, N, and M are determined, a stage of I,
II, III, or IV is assigned, with stage I being early and stage IV being
advanced disease. A different system of summary staging (in situ,
local, regional, and distant) is used for descriptive and statistical
Cancer Facts & Figures 2012 3
analysis of tumor registry data. If cancer cells are present only in
the layer of cells where they developed and have not spread, the
stage is in situ. If cancer cells have penetrated the original layer of
tissue, the cancer is invasive and categorized as local, regional, or
distant stage. (For a description of the summary stage categories,
see the footnotes in the table on page 17, Five-year Relative Survival
Rates (%) by Stage at Diagnosis, 2001-2007.) As the molecular prop-
erties of cancer have become better understood, prognostic models
and treatment plans for some cancer sites (e.g., breast) have incor-
porated the tumor’s biological markers and genetic features in
addition to stage.
Lung & bronchus
Colon & rectum
Pancreas
Uterus
†
Ovary
Breast
Stomach
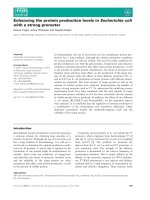
*Per 100,000, age adjusted to the 2000 US standard population. †Uterus cancer death rates are for uterine cervix and uterine corpus combined.
Note: Due to changes in ICD coding, numerator information has changed over time. Rates for cancer of the lung and bronchus, colon and rectum, and ovary are
affected by these coding changes.
Source: US Mortality Volumes 1930 to 1959, US Mortality Data 1960 to 2008, National Center for Health Statistics, Centers for Disease Control and Prevention.
©2012, American Cancer Society, Inc., Surveillance Research
Rate per 100,000 female population
0
20
40
60
80
100
2005200019951990198519801975197019651960195519501945194019351930
Age-adjusted Cancer Death Rates,* Females by Site, US, 1930-2008
What Are the Costs of Cancer?
The National Institutes of Health (NIH) estimates that the over-
all costs of cancer in 2007 were $226.8 billion: $103.8 billion for
direct medical costs (total of all health expenditures) and $123.0
billion for indirect mortality costs (cost of lost productivity due
to premature death). PLEASE NOTE: These estimates are not
comparable to those published in previous years because as of
2011, the NIH is using a different data source: the Medical
Expenditure Panel Survey (MEPS) of the Agency for Healthcare
Research and Quality. The MEPS estimates are based on more
current, nationally representative data and are used extensively
in scientific publications. As a result, direct and indirect costs
will no longer be projected to the current year, and estimates of
indirect morbidity costs have been discontinued. For more
information, please visit nhlbi.nih.gov/about/factpdf.htm.
Lack of health insurance and other barriers prevents many
Americans from receiving optimal health care. According to the
US Census Bureau, almost 51 million Americans were uninsured
in 2009; almost one-third of Hispanics (32%) and one in 10 chil-
dren (17 years of age and younger) had no health insurance
coverage. Uninsured patients and those from ethnic minorities
are substantially more likely to be diagnosed with cancer at a
later stage, when treatment can be more extensive and more
costly. For more information on the relationship between health
insurance and cancer, see Cancer Facts & Figures 2008, Special
Section, available online at cancer.org/statistics.
4 Cancer Facts & Figures 2012
Estimated New Cancer Cases and Deaths by Sex, US, 2012*
Estimated New Cases Estimated Deaths
Both Sexes Male Female Both Sexes Male Female
All Sites 1,638,910 848,170 790,740 577,190 301,820 275,370
Oral cavity & pharynx 40,250 28,540 11,710 7,850 5,440 2,410
Tongue 12,770 9,040 3,730 2,050 1,360 690
Mouth 11,620 7,030 4,590 1,790 1,070 720
Pharynx 13,510 10,790 2,720 2,330 1,730 600
Other oral cavity 2,350 1,680 670 1,680 1,280 400
Digestive system 284,680 156,760 127,920 142,510 80,560 61,950
Esophagus 17,460 13,950 3,510 15,070 12,040 3,030
Stomach 21,320 13,020 8,300 10,540 6,190 4,350
Small intestine 8,070 4,380 3,690 1,150 610 540
Colon
†
103,170 49,920 53,250 51,690 26,470 25,220
Rectum 40,290 23,500 16,790
Anus, anal canal, & anorectum 6,230 2,250 3,980 780 300 480
Liver & intrahepatic bile duct 28,720 21,370 7,350 20,550 13,980 6,570
Gallbladder & other biliary 9,810 4,480 5,330 3,200 1,240 1,960
Pancreas 43,920 22,090 21,830 37,390 18,850 18,540
Other digestive organs 5,690 1,800 3,890 2,140 880 1,260
Respiratory system 244,180 130,270 113,910 164,770 91,110 73,660
Larynx 12,360 9,840 2,520 3,650 2,880 770
Lung & bronchus 226,160 116,470 109,690 160,340 87,750 72,590
Other respiratory organs 5,660 3,960 1,700 780 480 300
Bones & joints 2,890 1,600 1,290 1,410 790 620
Soft tissue (including heart) 11,280 6,110 5,170 3,900 2,050 1,850
Skin (excluding basal & squamous) 81,240 46,890 34,350 12,190 8,210 3,980
Melanoma-skin 76,250 44,250 32,000 9,180 6,060 3,120
Other nonepithelial skin 4,990 2,640 2,350 3,010 2,150 860
Breast 229,060 2,190 226,870 39,920 410 39,510
Genital system 340,650 251,900 88,750 58,360 28,840 29,520
Uterine cervix 12,170 12,170 4,220 4,220
Uterine corpus 47,130 47,130 8,010 8,010
Ovary 22,280 22,280 15,500 15,500
Vulva 4,490 4,490 950 950
Vagina & other genital, female 2,680 2,680 840 840
Prostate 241,740 241,740 28,170 28,170
Testis 8,590 8,590 360 360
Penis & other genital, male 1,570 1,570 310 310
Urinary system 141,140 97,610 43,530 29,330 19,670 9,660
Urinary bladder 73,510 55,600 17,910 14,880 10,510 4,370
Kidney & renal pelvis 64,770 40,250 24,520 13,570 8,650 4,920
Ureter & other urinary organs 2,860 1,760 1,100 880 510 370
Eye & orbit 2,610 1,310 1,300 270 120 150
Brain & other nervous system 22,910 12,630 10,280 13,700 7,720 5,980
Endocrine system 58,980 14,600 44,380 2,700 1,240 1,460
Thyroid 56,460 13,250 43,210 1,780 780 1,000
Other endocrine 2,520 1,350 1,170 920 460 460
Lymphoma 79,190 43,120 36,070 20,130 10,990 9,140
Hodgkin lymphoma 9,060 4,960 4,100 1,190 670 520
Non-Hodgkin lymphoma 70,130 38,160 31,970 18,940 10,320 8,620
Myeloma 21,700 12,190 9,510 10,710 6,020 4,690
Leukemia 47,150 26,830 20,320 23,540 13,500 10,040
Acute lymphocytic leukemia 6,050 3,450 2,600 1,440 820 620
Chronic lymphocytic leukemia 16,060 9,490 6,570 4,580 2,730 1,850
Acute myeloid leukemia 13,780 7,350 6,430 10,200 5,790 4,410
Chronic myeloid leukemia 5,430 3,210 2,220 610 370 240
Other leukemia
‡
5,830 3,330 2,500 6,710 3,790 2,920
Other & unspecified primary sites
‡
31,000 15,620 15,380 45,900 25,150 20,750
*Rounded to the nearest 10; estimated new cases exclude basal and squamous cell skin cancers and in situ carcinomas except urinary bladder. About 63,300
carcinoma in situ of the female breast and 55,560 melanoma in situ will be newly diagnosed in 2012. †Estimated deaths for colon and rectal cancers are combined. ‡More
deaths than cases may reflect lack of specificity in recording underlying cause of death on death certificates or an undercount in the case estimate.
Source: Estimated new cases are based on 1995-2008 incidence rates from 47 states and the District of Columbia as reported by the North American Association of
Central Cancer Registries (NAACCR), represesnting about 95% of the US population. Estimated deaths are based on US Mortality Data, 1994 to 2008, National Center
for Health Statistics, Centers for Disease Control and Prevention.
©2012, American Cancer Society, Inc., Surveillance Research
Cancer Facts & Figures 2012 5
Estimated Numbers of New Cases for Selected Cancers by State, US, 2012*
Melanoma Non-
Female Uterine Colon & Uterine Lung & of the Hodgkin Urinary
State All Sites Breast Cervix Rectum Corpus Leukemia Bronchus Skin Lymphoma Prostate Bladder
Alabama 26,440 3,450 220 2,540 590 630 4,440 1,090 1,000 3,860 1,050
Alaska 3,640 470 † 290 100 120 490 70 160 490 160
Arizona 31,990 4,470 250 2,700 820 960 3,970 1,650 1,390 4,390 1,520
Arkansas 16,120 2,150 130 1,590 370 460 2,760 570 680 2,400 690
California 165,810 25,040 1,450 14,370 4,960 5,070 18,060 9,250 7,460 23,410 6,880
Colorado 22,820 3,420 140 1,750 600 730 2,400 1,470 1,000 3,830 1,070
Connecticut 21,530 3,140 110 1,730 680 550 2,720 1,290 890 3,340 1,170
Delaware 5,340 740 † 410 170 140 800 280 220 850 230
Dist. of Columbia 2,980 460 † 260 80 70 370 80 100 540 90
Florida 117,580 15,540 910 10,200 2,910 3,310 17,860 5,450 4,970 17,160 5,460
Georgia 48,130 6,970 410 4,090 1,170 1,230 6,570 2,150 1,840 7,900 1,680
Hawaii 6,610 1,120 50 680 220 180 860 280 230 740 220
Idaho 7,720 1,000 50 640 210 230 920 400 320 1,320 380
Illinois 65,750 9,090 510 6,030 1,900 1,980 9,190 2,460 2,870 8,950 3,030
Indiana 35,060 4,490 250 3,200 1,070 1,020 5,460 1,450 1,500 4,320 1,690
Iowa 17,010 2,350 90 1,680 540 560 2,330 850 800 2,640 850
Kansas 14,090 1,990 90 1,330 420 440 1,910 610 630 1,890 630
Kentucky 25,160 3,160 180 2,280 630 670 4,430 1,370 1,070 3,200 1,080
Louisiana 23,480 3,320 200 2,350 520 660 3,660 810 930 4,040 930
Maine 8,990 1,170 50 750 300 240 1,340 480 390 1,320 520
Maryland 31,000 4,700 210 2,420 920 780 4,250 1,420 1,280 5,190 1,200
Massachusetts 38,470 5,480 190 2,990 1,250 930 4,920 2,190 1,590 6,180 2,000
Michigan 57,790 7,710 350 5,080 1,770 1,700 8,210 2,700 2,550 9,450 2,830
Minnesota 28,060 4,110 150 2,370 910 900 3,750 1,130 1,290 4,520 1,320
Mississippi 15,190 1,990 140 1,580 330 360 2,550 510 540 2,330 550
Missouri 33,440 4,440 230 3,250 1,060 1,010 5,370 1,280 1,460 4,110 1,510
Montana 5,550 740 † 470 150 170 700 320 250 1,000 270
Nebraska 9,030 1,270 60 910 280 300 1,230 380 440 1,240 430
Nevada 13,780 1,770 120 1,260 330 390 1,930 510 530 1,850 610
New Hampshire 8,350 1,160 † 680 280 240 1,130 470 350 1,260 460
New Jersey 50,650 6,970 390 4,630 1,670 1,460 5,990 2,340 2,160 7,550 2,480
New Mexico 9,640 1,310 70 840 260 310 1,090 560 420 1,430 380
New York 109,440 14,730 850 9,390 3,730 2,970 13,620 4,700 4,680 17,090 5,460
North Carolina 51,860 7,090 390 4,140 1,390 1,410 7,950 2,360 2,050 8,010 2,100
North Dakota 3,510 490 † 350 110 120 460 130 160 530 170
Ohio 66,560 8,990 400 6,020 2,110 1,810 10,270 3,030 2,920 8,560 3,160
Oklahoma 19,210 2,630 170 1,780 470 600 3,370 750 850 2,560 820
Oregon 21,370 3,200 130 1,670 620 610 2,920 1,290 950 3,460 1,020
Pennsylvania 78,340 10,290 460 7,330 2,570 2,340 10,890 3,470 3,510 11,890 4,150
Rhode Island 6,310 870 † 540 200 170 860 290 240 810 330
South Carolina 26,570 3,570 220 2,350 670 700 4,270 1,150 1,040 4,140 1,060
South Dakota 4,430 600 † 420 140 130 620 170 200 700 220
Tennessee 35,610 4,680 270 3,240 850 920 6,140 1,640 1,440 4,900 1,490
Texas 110,470 15,050 1,080 9,700 2,600 3,530 14,810 4,020 4,750 15,730 3,940
Utah 10,620 1,480 70 780 290 370 880 780 480 1,850 420
Vermont 4,060 560 † 330 130 110 550 220 160 580 210
Virginia 41,380 6,190 290 3,250 1,220 1,020 5,550 2,150 1,700 6,860 1,620
Washington 35,790 5,240 220 2,770 1,080 1,050 4,700 2,140 1,600 5,060 1,670
West Virginia 11,610 1,430 80 1,080 330 330 2,070 520 490 1,540 510
Wisconsin 31,920 4,270 190 2,730 1,040 1,110 4,220 1,370 1,460 4,310 1,600
Wyoming 2,650 360 † 240 70 80 330 150 110 480 130
United States 1,638,910 226,870 12,170 143,460 47,130 47,150 226,160 76,250 70,130 241,740 73,510
*Rounded to nearest 10. Excludes basal and squamous cell skin cancers and in situ carcinomas except urinary bladder. †Estimate is fewer than 50 cases.
Note: These estimates are offered as a rough guide and should be interpreted with caution. State estimates may not sum to US total due to rounding and exclusion of state
estimates fewer than 50 cases.
©2012, American Cancer Society, Inc., Surveillance Research
6 Cancer Facts & Figures 2012
Estimated Numbers of Deaths for Selected Cancers by State, US, 2012*
State
All Sites
Brain/
Nervous
System
Female
Breast
Colon &
Rectum
Leukemia Liver
Lung &
Bronchus
Non-
Hodgkin
Lymphoma
Ovary Pancreas Prostate
Alabama
Alaska
Arizona
Arkansas
California
10,290
930
11,090
6,570
56,620
230
†
300
150
1,540
710
70
780
420
4,110
980
80
1,010
610
5,140
390
†
460
260
2,430
320
†
440
180
2,880
3,240
260
2,850
2,160
12,830
320
†
400
170
2,000
300
†
330
150
1,680
600
60
720
370
3,860
560
†
570
290
3,110
Colorado
Connecticut
Delaware
Dist. of Columbia
Florida
7,190
6,940
1,930
1,010
42,170
230
160
50
†
850
510
480
120
80
2,600
680
560
170
100
3,660
300
270
70
†
1,760
270
230
70
†
1,460
1,690
1,780
580
250
12,200
250
230
60
†
1,400
250
210
50
†
1,040
490
510
120
80
2,670
380
380
90
60
2,160
Georgia
Hawaii
Idaho
Illinois
Indiana
15,790
2,380
2,640
23,970
13,240
350
†
90
500
320
1,140
140
170
1,650
850
1,470
240
220
2,300
1,160
600
80
130
990
560
480
120
80
730
350
4,650
580
660
6,590
4,140
470
80
100
760
450
450
60
70
620
340
970
200
190
1,580
790
860
100
160
1,140
560
Iowa
Kansas
Kentucky
Louisiana
Maine
6,410
5,400
9,890
9,150
3,230
180
150
190
210
80
400
370
570
660
180
590
510
890
900
260
290
250
350
330
120
180
160
250
380
90
1,790
1,580
3,530
2,730
970
230
200
310
270
110
190
140
220
220
70
390
340
530
570
200
330
230
360
390
130
Maryland
Massachusetts
Michigan
Minnesota
Mississippi
10,440
12,930
20,430
9,490
6,330
230
300
530
240
140
810
800
1,350
600
440
940
1,060
1,730
800
640
420
500
890
440
240
350
480
660
320
220
2,850
3,570
5,910
2,500
1,960
320
420
720
330
170
280
370
550
260
140
720
910
1,370
600
370
510
600
840
480
310
Missouri
Montana
Nebraska
Nevada
New Hampshire
12,710
2,010
3,450
4,590
2,700
300
60
100
140
70
900
110
210
350
180
1,120
170
360
510
220
550
90
150
170
100
390
50
80
210
80
3,970
580
900
1,490
750
390
70
130
140
80
280
60
90
120
60
800
130
210
340
200
580
110
190
260
120
New Jersey
New Mexico
New York
North Carolina
North Dakota
16,650
3,530
34,140
18,440
1,300
340
90
740
390
†
1,340
240
2,420
1,290
90
1,600
350
3,090
1,530
130
650
140
1,430
690
60
540
170
1,350
580
†
4,200
780
8,880
5,600
320
550
110
1,080
560
50
490
100
1,010
460
†
1,130
240
2,420
1,130
90
720
200
1,610
1,020
70
Ohio
Oklahoma
Oregon
Pennsylvania
Rhode Island
25,030
7,800
7,790
28,790
2,190
570
200
220
570
50
1,750
500
510
1,950
130
2,250
720
670
2,460
170
970
310
310
1,190
100
720
240
270
880
80
7,350
2,440
2,120
7,750
620
800
260
280
1,030
70
600
180
240
810
60
1,710
420
520
1,940
130
1,210
430
410
1,330
90
South Carolina
South Dakota
Tennessee
Texas
Utah
9,670
1,630
13,880
36,820
2,780
220
†
340
900
110
660
110
890
2,650
250
830
160
1,230
3,400
240
350
70
510
1,490
160
300
†
410
1,830
90
2,970
450
4,570
9,780
460
280
60
430
1,180
110
220
50
330
930
90
570
100
790
2,240
210
440
80
580
1,630
270
Vermont
Virginia
Washington
West Virginia
Wisconsin
Wyoming
1,300
14,610
12,170
4,600
11,240
940
†
320
400
100
300
†
80
1,110
800
280
690
60
110
1,290
990
440
920
90
50
570
510
160
510
†
†
440
500
110
350
†
370
4,150
3,270
1,460
3,000
250
†
450
390
160
400
†
†
420
390
120
320
†
90
990
810
220
760
70
60
660
670
160
570
†
United States 577,190 13,700 39,510 51,690 23,540 20,550 160,340 18,940 15,500 37,390 28,170
*Rounded to nearest 10. †Estimate is fewer than 50 deaths.
Note: State estimates may not add to US total due to rounding and exclusion of state estimates fewer than 50 deaths.
©2012, American Cancer Society, In
c., Surveillance Research
Cancer Facts & Figures 2012 7
Incidence Rates* for Selected Cancers by State, US, 2004-2008
All Sites
Breast
Colon &
Rectum
Lung &
Bronchus
Non-Hodgkin
Lymphoma
Prostate
Urinary
Bladder
State Male Female Female Male Female Male Female Male Female Male Male Female
Alabama
†
Alaska
Arizona
Arkansas
California
579.9
531.4
447.5
556.4
512.8
391.1
441.0
360.6
385.6
396.9
117.2
130.4
106.7
109.0
122.4
61.3
55.1
43.4
56.2
51.2
42.0
45.5
32.5
41.4
38.6
106.8
85.3
63.9
109.2
63.3
54.1
64.8
48.2
61.0
45.7
19.8
22.3
18.0
21.7
22.8
13.8
18.2
13.3
15.4
15.6
160.8
141.5
122.9
156.4
146.5
32.8
39.4
32.5
32.8
34.3
7.6
8.6
8.6
8.4
8.1
Colorado
Connecticut
Delaware
Dist. of Columbia
‡
Florida
498.2
590.0
614.3
573.2
531.2
393.5
458.5
446.9
398.3
402.6
122.3
136.2
126.6
126.7
113.6
48.4
57.4
59.6
54.1
51.9
37.0
42.9
42.6
43.7
39.3
57.6
80.2
94.4
80.3
85.1
45.0
60.0
69.5
45.3
59.0
22.0
26.3
24.3
22.7
21.7
15.8
17.9
17.0
12.8
15.3
156.3
162.1
181.7
187.9
137.3
32.1
47.6
44.4
24.4
35.9
8.3
12.3
11.9
7.7
9.1
Georgia
Hawaii
Idaho
Illinois
Indiana
571.9
503.7
532.0
577.0
544.0
395.7
393.3
408.7
433.8
418.6
119.2
122.4
116.5
123.9
115.1
55.7
59.7
46.5
63.9
59.5
40.0
39.8
37.8
46.5
44.2
97.3
70.5
66.8
89.9
99.8
54.5
40.7
49.0
59.8
63.6
21.7
20.3
22.5
24.2
23.0
14.5
12.4
17.1
16.3
17.0
167.4
132.1
162.5
157.7
132.7
33.1
26.2
36.6
40.1
36.7
8.0
6.4
9.2
10.2
9.2
Iowa
Kansas
Kentucky
Louisiana
†
Maine
563.7
556.4
612.1
618.1
612.7
431.4
420.6
456.4
409.9
468.1
122.5
124.4
120.5
118.2
128.9
61.3
57.9
66.7
66.0
58.3
47.1
41.7
47.4
44.7
46.0
88.0
85.0
130.1
105.8
97.2
55.3
53.6
79.5
58.6
66.6
26.4
23.9
24.7
24.0
26.0
18.4
17.6
17.3
17.1
18.6
141.7
158.1
139.8
172.0
163.3
42.1
37.0
40.1
35.0
48.2
8.9
9.3
10.1
8.4
13.5
Maryland
‡
Massachusetts
Michigan
Minnesota
Mississippi
†
533.1
588.6
582.8
573.1
608.1
411.6
459.2
432.7
421.1
392.1
123.4
133.4
120.3
126.4
112.8
52.4
56.8
54.6
53.7
64.7
39.3
42.0
41.6
41.1
45.7
80.0
82.4
89.1
67.6
117.2
57.4
64.1
61.8
49.6
56.0
20.5
24.6
25.1
26.9
21.6
14.2
16.6
18.3
18.1
14.2
157.0
160.8
169.4
184.2
174.1
33.0
45.6
41.7
40.7
31.3
9.7
12.7
10.7
9.7
7.3
Missouri
Montana
Nebraska
Nevada
‡
New Hampshire
547.1
518.7
559.7
507.6
576.3
418.8
410.9
425.4
404.1
455.7
120.6
120.0
125.0
111.7
132.2
59.7
51.2
65.2
51.2
54.3
43.1
39.3
46.9
41.1
41.4
101.3
72.8
82.3
79.0
82.2
63.8
58.2
52.0
66.8
62.2
22.1
22.2
24.4
20.4
23.1
16.0
15.5
17.5
15.7
17.3
131.8
160.7
157.2
135.5
154.8
35.8
36.3
37.2
37.6
46.0
8.4
9.7
9.1
10.6
13.2
New Jersey
New Mexico
New York
North Carolina
North Dakota
595.1
467.4
580.9
576.6
559.3
453.8
369.5
438.4
412.5
417.1
129.7
110.5
124.3
123.3
124.2
60.6
46.2
56.7
55.8
66.4
44.4
35.5
43.0
39.9
44.5
76.7
54.5
77.3
101.6
72.5
56.7
39.4
54.8
57.8
46.2
25.6
18.5
25.5
22.7
23.1
17.7
14.4
17.5
15.6
17.4
171.0
137.6
166.9
158.8
169.5
46.7
25.9
42.5
37.1
40.8
12.2
7.0
11.0
9.1
9.9
Ohio
Oklahoma
Oregon
Pennsylvania
Rhode Island
551.1
566.3
531.6
586.6
603.1
421.2
428.0
431.5
449.4
464.5
119.8
125.6
130.3
124.8
132.5
58.5
56.8
50.0
61.4
59.0
43.6
42.7
38.7
46.0
44.8
94.9
103.2
76.0
88.4
90.8
60.0
65.6
59.8
57.6
63.2
23.2
23.0
24.2
24.9
24.4
16.2
17.7
16.3
17.6
17.5
146.0
151.8
149.2
155.8
155.1
39.0
35.8
38.7
45.1
53.1
9.6
8.7
10.0
11.0
13.4
South Carolina
South Dakota
Tennessee
Texas
†
Utah
569.1
515.1
558.0
529.9
476.2
396.9
386.8
404.6
388.5
344.7
119.9
117.4
117.2
113.7
109.5
55.6
55.8
57.4
54.4
42.2
41.0
40.9
42.2
37.8
31.2
97.9
76.3
108.7
82.3
34.1
53.4
46.6
60.7
49.9
22.3
20.5
20.3
22.1
22.3
23.4
14.1
16.7
16.1
15.8
16.0
165.5
158.5
142.2
143.3
173.7
30.9
34.0
34.4
29.4
28.7
7.8
7.9
8.3
7.0
5.8
Vermont
Virginia
Washington
West Virginia
Wisconsin
Wyoming
552.6
542.1
552.5
581.9
555.8
517.6
453.2
396.9
434.8
441.2
430.9
391.2
130.1
124.2
129.8
112.6
123.4
114.6
46.7
52.3
49.5
64.7
53.2
51.2
41.5
39.5
37.4
47.4
41.0
39.6
81.9
88.0
73.4
115.0
78.1
59.5
62.1
54.3
58.3
73.2
54.3
48.1
23.7
21.2
26.5
23.9
28.3
22.4
17.4
14.2
17.7
17.3
20.1
14.8
152.1
159.4
157.9
140.4
150.9
166.2
43.8
34.0
39.7
40.0
38.7
41.4
13.1
8.4
9.5
11.1
10.0
10.1
United States 553.0 416.5 121.2 55.7 41.4 84.4 55.7 23.4 16.3 152.9 37.6 9.4
*Per 100,000, age adjusted to the 2000 US standard population. †Data for 2005 are limited to cases diagnosed from January-June due to the effect of large migrations of
populations on this state as a result of Hurricane Katrina in September 2005. ‡This state’s data are not included in the rates for the US overall because its cancer registry
did not achieve high-quality data standards for one or more years during 2004-2008 according to the North American Association of Central Cancer Registry (NAACCR)
data quality indicators.
Source: NAACCR, 2011. Data are collected by cancer registries participating in the National Cancer Institute’s SEER program and the Centers for Disease Control and
Prevention’s National Program of Cancer Registries.
American Cancer Society, Surveillance Research, 2012
8 Cancer Facts & Figures 2012
Death Rates* for Selected Cancers by State, US, 2004-2008
All Sites Breast
Colon &
Rectum
Lung &
Bronchus
Non-Hodgkin
Lymphoma Pancreas Prostate
State Male Female Female Male Female Male Female Male Female Male Female Male
Alabama
Alaska
Arizona
Arkansas
California
262.0
212.4
186.7
254.9
197.4
158.7
157.2
132.4
164.1
143.4
24.5
21.7
21.0
24.0
22.5
23.6
21.5
17.5
23.2
18.4
15.2
13.5
11.9
15.6
13.3
90.3
62.3
52.1
93.2
50.3
41.0
46.3
33.9
47.4
33.9
8.5
7.7
7.7
8.6
8.2
5.5
5.1
4.9
5.2
5.1
12.9
11.9
11.4
12.7
11.8
9.4
10.4
7.8
9.5
9.3
29.9
22.5
20.6
26.2
23.6
Colorado
Connecticut
Delaware
Dist. of Columbia
Florida
187.3
216.4
238.5
260.4
209.4
135.7
152.5
167.5
161.1
143.9
20.5
23.2
24.3
27.6
21.9
18.3
18.1
20.8
23.0
18.7
13.3
13.8
15.0
18.1
13.3
46.1
58.5
73.7
68.6
65.1
32.3
39.1
50.3
35.1
40.1
8.2
8.2
9.0
8.8
8.0
4.7
5.4
5.1
3.2
5.0
11.2
14.4
12.1
16.1
11.9
8.8
10.1
9.8
10.1
8.6
24.3
25.7
26.7
41.7
20.3
Georgia
Hawaii
Idaho
Illinois
Indiana
237.1
186.2
197.9
233.3
247.3
149.5
120.7
145.7
162.0
164.8
23.2
17.8
21.2
24.7
24.0
20.7
18.8
15.9
23.2
23.1
14.3
10.7
13.8
16.2
15.6
78.9
51.8
52.0
69.9
82.8
38.9
27.4
34.9
42.0
47.2
8.0
7.2
8.2
9.1
9.9
4.8
4.4
5.8
5.6
5.8
12.8
12.9
11.6
13.2
12.9
8.8
9.4
10.2
10.1
9.5
28.6
16.8
27.3
26.1
25.2
Iowa
Kansas
Kentucky
Louisiana
Maine
224.7
224.7
271.2
268.1
243.4
151.7
151.3
175.1
168.6
164.7
22.1
23.1
23.5
26.8
21.5
21.3
21.8
24.4
25.8
20.9
15.5
14.5
17.0
16.3
15.4
70.0
71.8
103.0
87.8
75.6
39.3
40.9
56.1
45.0
47.3
9.2
9.7
9.3
9.3
9.3
5.6
5.5
6.0
5.5
6.0
12.1
12.7
12.3
14.0
12.7
8.8
9.4
9.3
10.9
10.0
25.1
22.2
25.6
28.6
25.0
Maryland
Massachusetts
Michigan
Minnesota
Mississippi
229.7
227.3
231.1
208.8
276.1
159.7
156.0
162.1
147.6
161.4
25.6
22.3
24.4
21.6
25.5
22.6
20.1
20.6
18.2
25.2
15.0
14.4
15.1
13.0
16.6
67.4
64.0
71.5
57.0
98.9
42.2
42.7
43.9
37.3
43.3
8.1
8.7
9.2
9.5
8.5
5.0
5.4
6.2
5.4
4.6
12.8
13.2
13.6
11.8
13.6
10.5
10.3
9.9
9.3
9.6
27.5
24.1
23.6
25.1
31.7
Missouri
Montana
Nebraska
Nevada
New Hampshire
242.0
208.1
217.1
214.7
223.4
162.7
153.0
147.2
163.0
159.1
25.4
20.7
22.0
23.5
22.8
22.1
17.5
22.9
21.3
20.5
15.0
13.9
15.6
16.4
13.9
83.1
59.5
64.1
62.7
63.4
46.4
42.4
35.9
50.0
43.7
8.5
8.5
9.0
6.8
8.3
5.5
5.6
5.9
4.9
5.1
12.9
12.3
12.2
12.1
12.8
9.5
9.3
8.7
10.0
11.0
23.1
28.0
24.9
24.5
25.1
New Jersey
New Mexico
New York
North Carolina
North Dakota
218.5
193.0
204.6
241.4
212.8
160.6
136.8
148.0
155.5
146.0
26.5
21.5
23.1
24.4
22.3
22.6
19.6
20.2
20.4
22.2
16.0
13.4
14.5
14.2
14.3
59.7
45.5
56.6
81.1
59.3
39.1
29.5
36.4
41.9
35.4
8.5
6.6
8.0
8.0
8.0
5.7
4.8
5.1
5.3
5.1
13.3
11.5
12.6
12.5
12.4
9.9
9.3
9.8
9.7
9.5
23.4
24.6
23.0
27.0
25.9
Ohio
Oklahoma
Oregon
Pennsylvania
Rhode Island
246.5
245.4
217.7
235.6
234.4
165.5
161.5
158.7
161.1
155.0
25.9
24.1
22.5
24.8
22.2
23.3
23.3
19.0
22.7
20.6
16.0
14.9
14.1
15.8
13.5
78.5
84.0
62.9
69.9
69.0
45.0
46.8
44.3
40.3
43.4
9.5
9.2
9.1
9.4
9.1
5.6
5.7
5.9
5.9
4.8
13.1
11.8
12.3
13.5
12.3
9.7
8.7
10.3
9.8
8.7
26.3
23.9
26.0
24.5
23.8
South Carolina
South Dakota
Tennessee
Texas
Utah
245.7
214.2
261.1
217.8
158.3
153.9
142.7
164.0
145.1
112.4
24.3
21.8
24.5
22.6
22.1
20.9
20.5
22.7
20.7
14.6
14.6
14.3
15.6
13.4
10.2
81.7
65.4
93.9
65.7
29.5
39.9
36.3
47.2
36.9
16.9
7.8
8.7
9.3
8.2
7.8
5.1
5.3
5.5
5.2
5.0
12.6
11.2
12.8
11.8
9.7
9.5
9.2
9.4
8.6
7.9
28.5
24.4
26.3
22.6
25.6
Vermont
Virginia
Washington
West Virginia
Wisconsin
Wyoming
214.2
232.7
211.9
257.1
222.8
199.4
155.5
155.5
155.7
174.0
154.3
150.7
21.7
25.1
22.4
23.9
22.1
22.1
20.2
21.0
18.2
24.4
19.4
19.9
15.0
14.4
13.1
16.9
13.6
14.6
62.5
73.0
59.7
89.1
61.4
52.5
43.2
41.3
43.2
50.8
39.2
38.2
7.7
8.3
8.9
9.6
9.5
8.1
5.1
5.1
5.7
6.5
5.9
6.3
11.5
13.1
12.1
11.7
12.8
12.4
9.6
9.9
9.8
7.6
9.7
10.4
24.3
26.3
25.2
21.6
26.7
22.7
United States 223.0 153.2 23.5 20.7 14.5 67.4 40.1 8.6 5.4 12.5 9.4 24.4
*Per 100,000, age adjusted to the 2000 US standard population.
Source: US Mortality Data, National Center for Health Statistics, Centers for Disease Control and Prevention.
American Cancer Society, Surveillance Research, 2012
Cancer Facts & Figures 2012 9
Selected Cancers
Breast
New Cases: An estimated 226,870 new cases of invasive breast
cancer are expected to occur among women in the US during
2012; about 2,190 new cases are expected in men. Excluding can-
cers of the skin, breast cancer is the most frequently diagnosed
cancer in women. The breast cancer incidence rate began to
decline in 2000 after peaking at 142 per 100,000 women in 1999.
The dramatic decrease of almost 7% from 2002 to 2003 has been
attributed to reductions in the use of menopausal hormone ther-
apy (MHT), previously known as hormone replacement therapy,
following the publication of results from the Women’s Health
Initiative in 2002; this study found that the use of combined
estrogen plus progestin MHT was associated with an increased
risk of breast cancer, as well as coronary heart disease. From
2004-2008, the most recent five years for which data are avail-
able, breast cancer incidence rates were stable.
In addition to invasive breast cancer, 63,300 new cases of in situ
breast cancer are expected to occur among women in 2012. Of
these, approximately 85% will be ductal carcinoma in situ
(DCIS). Since 2004, in situ breast cancer incidence rates have
been stable in white women and increasing in African American
women by 2.0% per year.
Deaths: An estimated 39,920 breast cancer deaths (39,510
women, 410 men) are expected in 2012. Breast cancer ranks sec-
ond as a cause of cancer death in women (after lung cancer).
Death rates for breast cancer have steadily decreased in women
since 1990, with larger decreases in younger women; from 2004
to 2008, rates decreased 3.1% per year in women younger than 50
and 2.1% per year in women 50 and older. The decrease in breast
cancer death rates represents progress in earlier detection,
improved treatment, and possibly decreased incidence.
Signs and symptoms: Breast cancer typically produces no
symptoms when the tumor is small and most treatable. There-
fore, it is important for women to follow recommended screening
guidelines for detecting breast cancer at an early stage, before
symptoms develop. Larger tumors may become evident as a pain-
less mass. Less common symptoms include persistent changes to
the breast, such as thickening, swelling, distortion, tenderness,
skin irritation, redness, scaliness, or nipple abnormalities, such
as ulceration, retraction, or spontaneous discharge. Typically,
breast pain results from benign conditions and is not an early
symptom of breast cancer.
Risk factors: Besides being female, increasing age is the most
important risk factor for breast cancer. Potentially modifiable
risk factors include weight gain after age 18, being overweight or
obese (for postmenopausal breast cancer), use of MHT (combined
estrogen and progestin hormone therapy), physical inactivity,
and alcohol consumption. Medical findings that predict higher
risk include high breast tissue density (a mammographic mea-
sure of the amount of glandular tissue relative to fatty tissue in
the breast), high bone mineral density (women with low density
are at increased risk for osteoporosis), and biopsy-confirmed
hyperplasia (overgrowth of cells), especially atypical hyperpla-
sia (overgrowth of cells that do not appear normal). High-dose
radiation to the chest for cancer treatment also increases risk.
Reproductive factors that increase risk include a long menstrual
history (menstrual periods that start early and/or end later in
life), recent use of oral contraceptives, never having children,
and having one’s first child after age 30.
Risk is also increased by a family history of one or more first-
degree relatives with breast cancer (though most women with
breast cancer do not have a family history of the disease). Inher-
ited mutations (alterations) in breast cancer susceptibility genes
account for approximately 5%-10% of all female and male breast
cancer cases, but are very rare in the general population (much
less than 1%). Most of these mutations are located in BRCA1 and
BRCA2 genes, although mutations in other known genes have
also been identified. Individuals with a strong family history of
breast cancer and cancer at other sites, such as ovarian and
colon cancer, should consider counseling to determine if genetic
testing is appropriate. Prevention measures may be possible for
individuals with breast cancer susceptibility mutations. In BRCA1
and BRCA2 mutation carriers, studies suggest that prophylactic
removal of the ovaries and/or breasts decreases the risk of breast
cancer considerably, although not all women who choose this
surgery would have developed breast cancer. Women who con-
sider prophylactic surgery should undergo counseling before
reaching a decision.
The International Agency for Research on Cancer has concluded
that there is limited evidence that tobacco smoking and shift
work, particularly at night, are associated with an increased risk
of breast cancer.
Modifiable factors that are associated with a lower risk of breast
cancer include breastfeeding, moderate or vigorous physical
activity, and maintaining a healthy body weight. Two medications,
tamoxifen and raloxifene, have been approved to reduce breast
cancer risk in women at high risk. Raloxifene appears to have a
lower risk of certain side effects, such as uterine cancer and
blood clots.
Early detection: Mammography can often detect breast cancer
at an early stage, when treatment is more effective and a cure is
more likely. Numerous studies have shown that early detection
with mammography saves lives and increases treatment options.
Steady declines in breast cancer mortality among women since
1990 have been attributed to a combination of early detection and
improvements in treatment. Mammography is a very accurate
screening tool, both for women at average and increased risk;
10 Cancer Facts & Figures 2012
however, like most medical tests, it is not perfect. On average,
mammography will detect about 80%-90% of breast cancers in
women without symptoms. Although the majority of women with
an abnormal mammogram do not have cancer, all suspicious
lesions should be biopsied for a definitive diagnosis. Annual
screening using magnetic resonance imaging (MRI) in addition
to mammography is recommended for women at high lifetime risk
of breast cancer starting at age 30. (For more information, see
Breast Cancer Facts & Figures 2011-2012 at cancer.org/statistics.)
Concerted efforts should be made to improve access to health
care and to encourage all women 40 and older to receive regular
mammograms. For more information on the American Cancer
Society’s recommendations for breast cancer screening, see
page 64.
Treatment: Taking into account tumor size, extent of spread, and
other characteristics, as well as patient preference, treatment
usually involves lumpectomy (surgical removal of the tumor and
surrounding tissue) or mastectomy (surgical removal of the
breast). Numerous studies have shown that for women whose
cancer has not spread to the skin, chest wall, or distant organs,
long-term survival for lumpectomy plus radiation therapy is
similar to that for mastectomy. For women undergoing mastec-
tomy, significant advances in reconstruction techniques provide
several options for breast reconstruction, including the timing
of the procedure (i.e., during mastectomy or in the time period
following the procedure).
Removal of some of the underarm lymph nodes during surgery is
usually recommended to determine whether the tumor has
spread beyond the breast. In women with early stage disease,
sentinel lymph node biopsy, a procedure in which only the first
lymph nodes to which cancer is likely to spread are removed, is as
effective as and less damaging than full axillary node dissection,
in which many underarm nodes are removed.
Treatment may also involve radiation therapy, chemotherapy
(before or after surgery), hormone therapy (tamoxifen, aromatase
inhibitors), or targeted therapy. Postmenopausal women with
breast cancer that tests positive for hormone receptors benefit
from treatment with an aromatase inhibitor (e.g., letrozole,
anastrozole, or exemestane), either after, or instead of, tamoxifen.
For women whose cancer tests positive for HER2/neu, approved
targeted therapies include trastuzumab (Herceptin) and, for
advanced disease, lapatinib (Tykerb). The US Food and Drug
Administration (FDA) revoked approval of bevacizumab (Avastin)
for the treatment of metastatic breast cancer in 2011 because
subsequent studies have shown minimal benefit and some
potentially dangerous side effects.
Leading New Cancer Cases and Deaths – 2012 Estimates
*Excludes basal and squamous cell skin cancers and in situ carcinoma except urinary bladder.
©2012, American Cancer Society, Inc., Surveillance Research
Male
Prostate
241,740 (29%)
Lung & bronchus
116,470 (14%)
Colon & rectum
73,420 (9%)
Urinary bladder
55,600 (7%)
Melanoma of the skin
44,250 (5%)
Kidney & renal pelvis
40,250 (5%)
Non-Hodgkin lymphoma
38,160 (4%)
Oral cavity & pharynx
28,540 (3%)
Leukemia
26,830 (3%)
Pancreas
22,090 (3%)
All sites
848,170 (100%)
Female
Breast
226,870 (29%)
Lung & bronchus
109,690 (14%)
Colon & rectum
70,040 (9%)
Uterine corpus
47,130 (6%)
Thyroid
43,210 (5%)
Melanoma of the skin
32,000 (4%)
Non-Hodgkin lymphoma
31,970 (4%)
Kidney & renal pelvis
24,520 (3%)
Ovary
22,280 (3%)
Pancreas
21,830 (3%)
All sites
790,740 (100%)
Estimated New Cases*
Male
Lung & bronchus
87,750 (29%)
Prostate
28,170 (9%)
Colon & rectum
26,470 (9%)
Pancreas
18,850 (6%)
Liver & intrahepatic bile duct
13,980 (5%)
Leukemia
13,500 (4%)
Esophagus
12,040 (4%)
Urinary bladder
10,510 (3%)
Non-Hodgkin lymphoma
10.320 (3%)
Kidney & renal pelvis
8,650 (3%)
All sites
301,820 (100%)
Female
Lung & bronchus
72,590 (26%)
Breast
39,510 (14%)
Colon & rectum
25,220 (9%)
Pancreas
18,540 (7%)
Ovary
15,500 (6%)
Leukemia
10,040 (4%)
Non-Hodgkin lymphoma
8,620 (3%)
Uterine corpus
8,010 (3%)
Liver & intrahepatic bile duct
6,570 (2%)
Brain & other nervous system
5,980 (2%)
All sites
275,370 (100%)
Estimated Deaths
Cancer Facts & Figures 2012 11
It is recommended that all patients with ductal carcinoma in
situ (DCIS) be treated to avoid potential progression to invasive
cancer. Treatment options for DCIS include lumpectomy with
radiation therapy or mastectomy; either of these options may be
followed by treatment with tamoxifen if the tumor is hormone
receptor-positive. Removal of axillary lymph nodes is not gener-
ally needed. A report by a panel of experts convened by the
National Institutes of Health concluded that in light of the non-
invasive nature and favorable prognosis of DCIS, the primary
goal for future research is the ability to accurately group patients
into risk categories that will allow the most successful outcomes
with the minimum necessary treatment.
Survival: The 5-year relative survival rate for female breast cancer
patients has improved from 63% in the early 1960s to 90% today.
The 5-year relative survival for women diagnosed with localized
breast cancer (cancer that has not spread to lymph nodes or
other locations outside the breast) is 99%; if the cancer has
spread to nearby lymph nodes (regional stage) or distant lymph
nodes or organs (distant stage), the survival rate falls to 84% or
23%, respectively. For all stages combined, relative survival rates
at 10 and 15 years after diagnosis are 82% and 77%, respectively.
Caution should be used when interpreting long-term survival
rates because they represent patients who were diagnosed many
years ago and do not reflect recent advances in detection and
treatment. For example, 15-year relative survival is based on
patients diagnosed as early as 1990.
Many studies have shown that being overweight adversely
affects survival for postmenopausal women with breast cancer.
In addition, women who are more physically active are less likely
to die from the disease than those who are inactive.
For more information about breast cancer, see the American
Cancer Society’s Breast Cancer Facts & Figures 2011-2012, avail-
able online at cancer.org/statistics.
Childhood Cancer
New cases: An estimated 12,060 new cases are expected to
occur among children 0 to 14 years of age in 2012. Childhood
cancers are rare, representing less than 1% of all new cancer
diagnoses. Overall, childhood cancer incidence rates increased
slightly by 0.5% per year from 2004 to 2008, a consistent trend
since 1975.
Deaths: An estimated 1,340 cancer deaths are expected to occur
among children 0 to 14 years of age in 2012, about one-third of
these from leukemia. Although uncommon, cancer is the second
leading cause of death in children, exceeded only by accidents.
Mortality rates for childhood cancer have declined by 66% over
the past four decades, from 6.5 (per 100,000) in 1969 to 2.2 in
2008. The substantial progress in reducing childhood cancer
mortality is largely attributable to improvements in treatment
and high rates of participation in clinical trials.
Signs and symptoms: Early symptoms are usually nonspecific.
Parents should ensure that children have regular medical check-
ups and be alert to any unusual, persistent symptoms. Signs of
childhood cancer include an unusual mass or swelling; unex-
plained paleness or loss of energy; sudden tendency to bruise; a
persistent, localized pain; prolonged, unexplained fever or illness;
frequent headaches, often with vomiting; sudden eye or vision
changes; and excessive, rapid weight loss. Major categories of
pediatric cancer and specific symptoms include:
• Leukemia (34% of all childhood cancers), which may be
recognized by bone and joint pain, weakness, pale skin,
bleeding, and fever
• Brain and other nervous system (27%), which may cause
headaches, nausea, vomiting, blurred or double vision,
dizziness, and difficulty walking or handling objects
• Neuroblastoma (7%), a cancer of the nervous system that is
most common in children younger than 5 years of age and
usually appears as a swelling in the abdomen
• Wilms tumor (5%), a kidney cancer that may be recognized
by a swelling or lump in the abdomen
• Non-Hodgkin lymphoma (4%) and Hodgkin lymphoma (4%),
which affect lymph nodes but may spread to bone marrow
and other organs, and may cause swelling of lymph nodes in
the neck, armpit, or groin, as well as weakness and fever
• Rhabdomyosarcoma (3%), a soft tissue sarcoma that can
occur in the head and neck, genitourinary area, trunk, and
extremities, and may cause pain and/or a mass or swelling
• Retinoblastoma (3%), an eye cancer that is typically recognized
because of discoloration of the eye pupil and usually occurs
in children younger than 5 years of age
• Osteosarcoma (3%), a bone cancer that most often occurs in
adolescents and commonly appears as sporadic pain in the
affected bone that may worsen at night or with activity, with
eventual progression to local swelling
• Ewing sarcoma (1%), another type of cancer that usually
arises in bone, is most common in adolescents, and typically
appears as pain at the tumor site.
(Proportions are provided for all races combined and may vary
according to race/ethnicity.)
Treatment: Childhood cancers can be treated by a combination
of therapies (surgery, radiation, and chemotherapy) chosen based
on the type and stage of the cancer. Treatment is coordinated by a
team of experts, including pediatric oncologists, pediatric nurses,
social workers, psychologists, and others who assist children and
their families. Because these cancers are uncommon, outcomes
are more successful when treatment is managed by a children’s
cancer center. If the child is eligible, placement in a clinical trial,
which compares a new treatment to the best current treatment,
should also be considered.
12 Cancer Facts & Figures 2012
Survival: For all childhood cancers combined, the 5-year relative
survival rate has improved markedly over the past 30 years, from
58% in the mid-1970s to 83% today, due to new and improved
treatments. However, rates vary considerably depending on cancer
type, patient age, and other characteristics. For the most recent
time period (2001-2007), the 5-year survival among children 0-14
years of age for Hodgkin lymphoma is 95%; Wilms tumor, 88%;
non-Hodgkin lymphoma, 86%; leukemia, 83%; neuroblastoma,
74%; brain and other nervous system tumors, 71%; osteosarcoma,
70%; and rhabdomyosarcoma, 68%.
Pediatric cancer patients may experience treatment-related side
effects not only during treatment, but many years after diagnosis
as well. Late treatment effects include impairment in the function
of specific organs, secondary cancers, and cognitive impairments.
The Children’s Oncology Group (COG) has developed long-term
follow-up guidelines for screening and management of late effects
in survivors of childhood cancer. For more information on child-
hood cancer management, see the COG Web site at survivorship
guidelines.org. The Childhood Cancer Survivor Study, which has
followed more than 14,000 long-term childhood cancer survivors,
has also provided important and valuable information about the
late effects of cancer treatment; for more information, visit ccss.
stjude.org.
Colon and Rectum
New cases: An estimated 103,170 cases of colon and 40,290 cases
of rectal cancer are expected to occur in 2012. Colorectal cancer
is the third most common cancer in both men and women.
Colorectal cancer incidence rates have been decreasing for most
of the past two decades, which has largely been attributed to
increases in the use of colorectal cancer screening tests that
allow the detection and removal of colorectal polyps before they
progress to cancer. From 2004 to 2008, annual declines in white
men were much larger than those in African American men, 2.9%
versus 0.8%, respectively; whereas, among women, declines
among whites (2.2% per year) and African Americans (1.7% per
year) were similar. In contrast to the overall declines, colorectal
cancer incidence rates have been increasing by 1.7% per year
since 1992 among adults younger than 50 years of age, for whom
screening is not recommended for those at average risk.
Deaths: An estimated 51,690 deaths from colorectal cancer are
expected to occur in 2012, accounting for 9% of all cancer deaths.
Mortality rates for colorectal cancer have declined in both men
and women over the past two decades; from 2004 to 2008, the
rate declined by 2.7% per year in men and by 2.5% per year in
women. This decrease reflects declining incidence rates and
improvements in early detection and treatment.
Signs and symptoms: Early stage colorectal cancer does not
typically have symptoms; therefore, screening is usually neces-
sary to detect colorectal cancer in its early stages. Advanced
disease may cause rectal bleeding, blood in the stool, a change in
bowel habits, and cramping pain in the lower abdomen. In some
cases, blood loss from the cancer leads to anemia (low red blood
cells), causing symptoms such as weakness and excessive
fatigue. Due to an increase in colorectal cancer incidence in
younger adults in recent years, timely evaluation of symptoms
consistent with colorectal cancer in adults under age 50 is espe-
cially important.
Risk factors: The risk of colorectal cancer increases with age;
91% of cases are diagnosed in individuals 50 years of age and
older. Modifiable factors associated with increased risk include
obesity, physical inactivity, a diet high in red or processed meat,
alcohol consumption, long-term smoking, and possibly very low
intake of fruits and vegetables. Hereditary and medical factors
that increase risk include a personal or family history of colorectal
cancer and/or polyps, a personal history of chronic inflammatory
bowel disease, and certain inherited genetic conditions (e.g.,
Lynch syndrome, also known as hereditary nonpolyposis
colorectal cancer, and familial adenomatous polyposis [FAP]).
Studies have also found that individuals with type 2 diabetes are
at higher risk of colorectal cancer.
Consumption of milk and calcium and higher blood levels of
vitamin D appear to decrease colorectal cancer risk. Studies
suggest that regular use of nonsteroidal anti-inflammatory
drugs, such as aspirin, and menopausal hormone therapy also
reduce risk. However, these drugs are not recommended for the
prevention of colorectal cancer among individuals at average
risk because they can have serious adverse health effects.
Early detection: Beginning at age 50, men and women who are
at average risk for developing colorectal cancer should begin
screening. Screening can result in the detection and removal of
colorectal polyps that might have become cancerous, as well as
the detection of cancer at an early stage, when treatment is usu-
ally less extensive and more successful. In 2008, the American
Cancer Society collaborated with several other organizations to
release updated colorectal cancer screening guidelines. These
joint guidelines emphasize cancer prevention and draw a dis-
tinction between colorectal screening tests that primarily detect
cancer and those that can detect both cancer and precancerous
polyps. There are a number of recommended screening options
that vary by the extent of bowel preparation, as well as test per-
formance, limitations, time interval, and cost. For detailed
information on colorectal cancer screening options, see Colorec-
tal Cancer Facts & Figures 2011-2013 at cancer.org/statistics; see
page 64 for the American Cancer Society’s screening guidelines
for colorectal cancer
Treatment: Surgery is the most common treatment for colorectal
cancer. For cancers that have not spread, surgical removal may
be curative. A permanent colostomy (creation of an abdominal
opening for elimination of body waste) is rarely needed for colon
cancer and is infrequently required for rectal cancer. Chemo-
therapy alone, or in combination with radiation, is given before
Cancer Facts & Figures 2012 13
or after surgery to most patients whose cancer has penetrated
the bowel wall deeply or spread to lymph nodes. Adjuvant che-
motherapy (anticancer drugs in addition to surgery or radiation)
for colon cancer in otherwise healthy patients 70 years of age
and older is equally effective as in younger patients; toxicity in
older patients can be limited if certain drugs (e.g., oxaliplatin)
are avoided. Patients who have chemotherapy soon after surgery
have better survival than those who begin later. Three targeted
monoclonal antibody therapies are approved by the FDA to treat
metastatic colorectal cancer: bevacizumab (Avastin) blocks the
growth of blood vessels to the tumor, and cetuximab (Erbitux)
and panitumumab (Vectibix) block the effects of hormone-like
factors that promote cancer growth.
Survival: The 1- and 5-year relative survival rates for persons
with colorectal cancer are 83% and 64%, respectively. Survival
continues to decline to 58% at 10 years after diagnosis. When
colorectal cancers are detected at an early, localized stage, the
5-year survival is 90%; however, only 39% of colorectal cancers are
diagnosed at this stage, in part due to the underuse of screening.
After the cancer has spread regionally to involve adjacent organs
or lymph nodes, the 5-year survival drops to 69%. When the
disease has spread to distant organs, the 5-year survival is 12%.
Kidney
New cases: An estimated 64,770 new cases of kidney (renal) can-
cer are expected to be diagnosed in 2012. Kidney cancer includes
renal cell carcinoma (92%), renal pelvis carcinoma (7%), and
Wilms tumor (1%), a childhood cancer that usually develops
before age 5 (see Childhood Cancer, page 11). From 2004 to 2008,
kidney cancer incidence rates increased by 4.1% per year in men
and 3.3% per year in women, primarily due to an increase in
early stage disease. Early stage kidney cancer does not typically
produce symptoms, and some of the increase in kidney cancer
rates over the past two decades may be due to incidental diagno-
sis during abdominal imaging performed for other reasons.
Deaths: An estimated 13,570 deaths from kidney cancer are
expected to occur in 2012. Death rates for kidney cancer
decreased by 0.6% per year in women and by 0.4% per year in
men from 2004 to 2008.
Signs and symptoms: Early stage kidney cancer usually has no
symptoms. Symptoms that may develop as the tumor progresses
include blood in the urine, a pain or lump in the lower back or
abdomen, fatigue, weight loss, fever, or swelling in the legs and
ankles.
Risk factors: Tobacco use is a strong risk factor for kidney
cancer, with the largest increased risk for cancer of the renal
pelvis, particularly for heavy smokers. Additional risk factors for
renal cell carcinoma include obesity, to which an estimated 30%
of cases can be attributed; hypertension (high blood pressure);
chronic renal failure; and occupational exposure to certain
chemicals, such as trichloroethylene, an industrial agent used as
a metal degreaser and chemical additive. Radiation exposure
(e.g., in medical procedures) slightly increases risk. A small
proportion of renal cell cancers are the result of rare hereditary
conditions, such as von Hippel-Lindau disease.
Early detection: There are no reliable screening tests for people
at average risk.
Treatment: Surgery (traditional or laparoscopic, i.e., minimally
invasive, performed through very small incisions) is the primary
treatment for most kidney cancers. Patients who are not surgical
candidates may be offered ablation therapy, a procedure that
uses heat or cold to destroy the tumor. Kidney cancer tends to be
resistant to both traditional chemotherapy and radiation ther-
apy. Improved understanding of the biology of kidney cancer has
led to the development of new targeted therapies that control
cancer growth by blocking the tumor’s blood supply or through
other mechanisms. Since 2005, six of these agents have been
approved by the FDA for the treatment of metastatic disease:
sorafenib (Nexavar), sunitinib (Sutent), temsirolimus (Torisel),
everolimus (Afinitor), bevacizumab (Avastin), and pazopanib
(Votrient).
Survival: The 1- and 5-year relative survival rates for cancers of
the kidney are 84% and 70%, respectively. More than half of cases
are diagnosed at the local stage, for which the 5-year relative
survival rate is 91%. Five-year survival is lower for renal pelvis
(50%) than for renal cell (71%) carcinoma.
Leukemia
New cases: An estimated 47,150 new cases of leukemia are
expected in 2012. Leukemia is a cancer of the bone marrow and
blood and is classified into four main groups according to cell
type and rate of growth: acute lymphocytic (ALL), chronic lym-
phocytic (CLL), acute myeloid (AML), and chronic myeloid (CML).
Almost 90% of leukemia cases are diagnosed in adults 20 years
of age and older, in whom the most common types are AML and
CLL. Among children and teens, ALL is most common, accounting
for three-fourths of leukemia cases (see Childhood Cancer, page
11). From 2004 to 2008, overall leukemia incidence rates increased
slightly by 0.5% per year, a consistent trend since 1992.
Deaths: An estimated 23,540 deaths are expected to occur in
2012. Death rates for leukemia have been declining for the past
several decades; from 2004 to 2008, rates decreased by 0.8% per
year among males and by 1.4% per year among females.
Signs and symptoms: Symptoms may include fatigue, paleness,
weight loss, repeated infections, fever, bruising easily, and nose-
bleeds or other hemorrhages. In acute leukemia, these signs can
appear suddenly. Chronic leukemia typically progresses slowly
with few symptoms and is often diagnosed during routine blood
tests.
Risk factors: Exposure to ionizing radiation increases risk of
several types of leukemia. Medical radiation, such as that used
14 Cancer Facts & Figures 2012
in cancer treatment, is a substantial source of radiation expo-
sure. Leukemia may also occur as a side effect of chemotherapy.
Children with Down syndrome and certain other genetic abnor-
malities have higher incidence rates of leukemia. Some recent
studies suggest that obesity may also be associated with an
increased risk of leukemia. Family history is one of the strongest
risk factors for CLL. Cigarette smoking and exposure to certain
chemicals such as benzene, a component in gasoline and cigarette
smoke, are risk factors for AML. There is limited evidence that
parental smoking and maternal exposure to paint increases the
risk of childhood leukemia. Infection with human T-cell leukemia
virus type I (HTLV-I) can cause a rare type of CLL called adult
T-cell leukemia/lymphoma. The prevalence of HTLV-I infection
is geographically localized and is most common in southern
Japan and the Caribbean; infected individuals in the US tend to
be descendants or immigrants from endemic regions.
Early detection: Leukemia can be difficult to diagnose early
because symptoms often resemble those of other, less serious
conditions. When a physician does suspect leukemia, diagnosis
can be made using blood tests and a bone marrow biopsy.
Treatment: Chemotherapy is the most effective method of
treating leukemia. Various anticancer drugs are used, either in
combination or as single agents. Imatinib (Gleevec), nilotinib
(Tasigna), and dasatinib (Sprycel) are very effective targeted
drugs for the treatment of CML. These drugs are also sometimes
used to treat a certain type of ALL. Some people with CLL may
not need treatment right away, unless the leukemia is progress-
ing or causing symptoms. Recent clinical trials have shown that
adults with AML who are treated with twice the conventional
dose of daunorubicin experience higher and more rapid rates of
remission. Antibiotics and transfusions of blood components are
used as supportive treatments. Under appropriate conditions,
stem cell transplantation may be useful in treating certain types
of leukemia.
Survival: Survival rates vary substantially by leukemia type,
ranging from a 5-year relative survival of 24% for patients
diagnosed with AML to 81% for those with CLL. Advances in
treatment have resulted in a dramatic improvement in survival
over the past three decades for most types of leukemia. For
example, from 1975-1977 to 2001-2007, the 5-year relative sur-
vival rate for ALL increased from 41% to 67% overall, and from
58% to 91% among children. In large part due to the discovery of
the targeted cancer drug imatinib (Gleevec), the 5-year survival
rate for CML increased from 31% for cases diagnosed during
1990-1992 to 55% for those diagnosed during 2001-2007.
Probability (%) of Developing Invasive Cancers over Selected Age Intervals by Sex, US, 2006-2008*
Birth to 39 40 to 59 60 to 69 70 and Older Birth to Death
All sites
†
Male 1.45 (1 in 69) 8.68 (1 in 12) 16.00 (1 in 6) 38.27 (1 in 3) 44.85 (1 in 2)
Female 2.15 (1 in 46) 9.10 (1 in 11) 10.34 (1 in 10) 26.68 (1 in 4) 38.08 (1 in 3)
Urinary Male 0.02 (1 in 5,035) 0.38 (1 in 266) 0.92 (1 in 109) 3.71 (1 in 27) 3.84 (1 in 26)
bladder
‡
Female 0.01 (1 in 12,682) 0.12 (1 in 851) 0.25 (1 in 400) 0.98 (1 in 102) 1.15 (1 in 87)
Breast Female 0.49 (1 in 203) 3.76 (1 in 27) 3.53 (1 in 28) 6.58 (1 in 15) 12.29 (1 in 8)
Colon & Male 0.08 (1 in 1,236) 0.92 (1 in 109) 1.44 (1 in 70) 4.32 (1 in 23) 5.27 (1 in 19)
rectum Female 0.08 (1 in 1,258) 0.73 (1 in 137) 1.01 (1 in 99) 3.95 (1 in 25) 4.91 (1 in 20)
Leukemia Male 0.16 (1 in 614) 0.22 (1 in 445) 0.34 (1 in 291) 1.24 (1 in 81) 1.57 (1 in 64)
Female 0.14 (1 in 737) 0.15 (1 in 665) 0.21 (1 in 482) 0.81 (1 in 123) 1.14 (1 in 88)
Lung & Male 0.03 (1 in 3,631) 0.91 (1 in 109) 2.26 (1 in 44) 6.69 (1 in 15) 7.66 (1 in 13)
bronchus Female 0.03 (1 in 3,285) 0.76 (1 in 132) 1.72 (1 in 58) 4.91 (1 in 20) 6.33 (1 in 16)
Melanoma Male 0.15 (1 in 677) 0.63 (1 in 158) 0.75 (1 in 133) 1.94 (1 in 52) 2.80 (1 in 36)
of the skin
§
Female 0.27 (1 in 377) 0.56 (1 in 180) 0.39 (1 in 256) 0.82 (1 in 123) 1.83 (1 in 55)
Non-Hodgkin Male 0.13 (1 in 775) 0.45 (1 in 223) 0.60 (1 in 167) 1.77 (1 in 57) 2.34 (1 in 43)
lymphoma Female 0.09 (1 in 1,152) 0.32 (1 in 313) 0.44 (1 in 228) 1.41 (1 in 71) 1.94 (1 in 51)
Prostate Male 0.01 (1 in 8,499) 2.63 (1 in 38) 6.84 (1 in 15) 12.54 (1 in 8) 16.48 (1 in 6)
Uterine cervix Female 0.15 (1 in 650) 0.27 (1 in 373) 0.13 (1 in 771) 0.18 (1 in 549) 0.68 (1 in 147)
Uterine corpus Female 0.07 (1 in 1,373) 0.77 (1 in 130) 0.87 (1 in 114) 1.24 (1 in 81) 2.61 (1 in 38)
*For people free of cancer at beginning of age interval. †All sites excludes basal and squamous cell skin cancers and in situ cancers except urinary bladder.
‡Includes invasive and in situ cancer cases. §Statistic is for whites only.
Source: DevCan: Probability of Developing or Dying of Cancer Software, Version 6.6.0. Statistical Research and Applications Branch, National Cancer Institute, 2011.
www.srab.cancer.gov/devcan.
American Cancer Society, Surveillance Research, 2012
Liver
New Cases: An estimated 28,720 new cases of liver cancer
(including intrahepatic bile duct cancers) are expected to occur
in the US during 2012. More than 80% of these cases are hepato-
Cancer Facts & Figures 2012 15
cellular carcinoma (HCC), originating from hepatocytes, the
predominant liver cell type. Liver cancer incidence rates increased
by 3.6% per year in men and by 3.0% per year in women from
2004 to 2008, trends that have persisted since 1992.
Deaths: An estimated 20,550 liver cancer deaths (6,570 women,
13,980 men) are expected in 2012. From 2004 to 2008, death rates
for liver cancer increased by 2.2% per year in men and were stable
in women. Incidence and mortality rates are more than twice as
high in men as in women.
Signs and symptoms: Common symptoms include abdominal
pain and/or swelling, weight loss, weakness, loss of appetite,
jaundice (a yellowish discoloration of the skin and eyes), and
fever. Enlargement of the liver is the most common physical sign,
occurring in 50%-90% of patients.
Risk factors: In the US and other western countries, alcohol-
related cirrhosis, and possibly non-alcoholic fatty liver disease
associated with obesity, account for the majority of liver cancer
cases. Chronic infections with hepatitis B virus (HBV) and hepa-
titis C virus (HCV) are associated with less than half of liver
cancer cases in the US, although they are the major risk factors
for the disease worldwide. In the US, rates of HCC are higher in
immigrants from areas where HBV is endemic, such as China,
Southeast Asia, and sub-Saharan Africa. A vaccine that protects
against HBV has been available since 1982. The HBV vaccination
is recommended for all infants at birth; for all children under 18
years of age who were not vaccinated at birth; and for adults in
high-risk groups, including health care workers. It is also recom-
mended that all pregnant women be tested for HBV. There is no
vaccine available against HCV. The Centers for Disease Control
and Prevention (CDC) recommends routine HCV testing for
individuals at high risk (e.g., injection drug users) so that
infected individuals can receive counseling in order to reduce the
risk of HCV transmission to others. Other preventive measures
for HCV infection include screening of donated blood, organs,
and tissues; instituting infection control practices during all
medical, surgical, and dental procedures; and needle-exchange
programs for injecting drug users. Treatment of chronic HCV
infection with interferon and other drugs may reduce the risk of
liver cancer and is the subject of ongoing research. For more
information on hepatitis infections, including who is at risk,
visit the CDC Web site at cdc.gov/hepatitis/.
Other risk factors for liver cancer, particularly in economically
developing countries, include parasitic infections (schistosomi-
asis and liver flukes) and consumption of food contaminated
with aflatoxin, a toxin produced by mold during the storage of
agricultural products in a warm, humid environment.
Early detection: Screening for liver cancer has not been proven
to improve survival. Nonetheless, many doctors in the US screen
high-risk persons (e.g., HCV-infected persons with cirrhosis)
with ultrasound or blood tests.
Treatment: Early stage liver cancer can sometimes be success-
fully treated with surgery in patients with sufficient healthy
liver tissue; liver transplantation may also be an option. Fewer
surgical options exist for patients diagnosed at an advanced
stage of the disease, often because the portion of the liver not
affected by cancer is also damaged. Patients whose tumors cannot
be surgically removed may choose ablation (tumor destruction)
or embolization, a procedure that cuts off blood flow to the
tumor. Sorafenib (Nexavar) is a targeted drug approved for the
treatment of HCC in patients who are not candidates for surgery.
Survival: The overall 5-year relative survival rate for patients
with liver cancer is 14%. Thirty-nine percent of patients are
diagnosed at an early stage, for which five-year survival is 27%.
Survival decreases to 9% and 4% for patients who are diagnosed
at regional and distant stages of disease, respectively.
Lung and Bronchus
New cases: An estimated 226,160 new cases of lung cancer are
expected in 2012, accounting for about 14% of cancer diagnoses.
The incidence rate has been declining in men over the past two
decades, from a high of 102 (cases per 100,000 men) in 1984 to 72
in 2008. In women, the rate has just begun to decrease after a
long period of increase. From 2004 to 2008, lung cancer incidence
rates decreased by 1.9% per year in men and by 0.3% per year in
women.
Deaths: Lung cancer accounts for more deaths than any other
cancer in both men and women. An estimated 160,340 deaths,
accounting for about 28% of all cancer deaths, are expected to
occur in 2012. Death rates began declining in men in 1991; from
2004 to 2008, rates decreased 2.6% per year. Lung cancer death
rates did not begin declining in women until 2003; from 2004 to
2008, rates decreased by 0.9% per year. Gender differences in lung
cancer mortality patterns reflect historical differences between
men and women in the uptake and reduction of cigarette smoking
over the past 50 years.
Signs and symptoms: Symptoms may include persistent cough,
sputum streaked with blood, chest pain, voice change, and
recurrent pneumonia or bronchitis.
Risk factors: Cigarette smoking is by far the most important
risk factor for lung cancer; risk increases with both quantity and
duration of smoking. Cigar and pipe smoking also increase risk.
Exposure to radon gas released from soil and building materials
is estimated to be the second leading cause of lung cancer in
Europe and North America. Other risk factors include occupa-
tional or environmental exposure to secondhand smoke, asbestos
(particularly among smokers), certain metals (chromium, cad-
mium, arsenic), some organic chemicals, radiation, air pollution,
and paint (occupational). Risk is also probably increased among
people with a medical history of tuberculosis. Genetic suscepti-
bility plays a contributing role in the development of lung cancer,
especially in those who develop the disease at a younger age.
16 Cancer Facts & Figures 2012
Early detection: Recently published results from a large clinical
trial showed that annual screening with chest x-ray does not
reduce lung cancer mortality. Newer tests, such as low-dose
spiral computed tomography (CT) scans and molecular markers
in sputum, have produced promising results in detecting lung
cancers at earlier, more operable stages in high-risk patients.
Results from the National Lung Screening Trial, a clinical trial
designed to determine the effectiveness of lung cancer screening
in high-risk individuals, showed 20% fewer lung cancer deaths
among current and former heavy smokers who were screened
with spiral CT compared to standard chest x-ray. However, it is not
known how relevant these results are to individuals with a lesser
smoking history compared with the study participants, who had
a history of very heavy smoking – the equivalent of at least a
pack of cigarettes per day for 30 years. In addition, the potential
risks associated with screening, including cumulative radiation
exposure from multiple CT scans, and unnecessary lung biopsy
and surgery, have not yet been evaluated. It will take some time
to develop formal guidelines based on a careful evaluation of the
benefits, limitations, and harms associated with screening an
asymptomatic population at high risk for lung cancer. In the
interim, the Society has issued lung cancer screening guidance
for adults who would have met the criteria for participation in
the screening trial. For more information, visit cancer.org/healthy/
findcancerearly.
Treatment: Lung cancer is classified as small cell (14%) or non-
small cell (85%) for the purposes of treatment. Based on type and
stage of cancer, treatments include surgery, radiation therapy,
chemotherapy, and targeted therapies such as bevacizumab
(Avastin), erlotinib (Tarceva), and crizotinib (Xalkori). For local-
ized non-small cell lung cancers, surgery is usually the treatment
of choice, and survival for most of these patients is improved by
giving chemotherapy after surgery. Because the disease has usu-
ally spread by the time it is discovered, radiation therapy and
chemotherapy are often used, sometimes in combination with
surgery. Advanced-stage non-small cell lung cancer patients are
usually treated with chemotherapy, targeted drugs, or some
combination of the two. Chemotherapy alone or combined with
radiation is the usual treatment of choice for small cell lung
cancer; on this regimen, a large percentage of patients experience
remission, though the cancer often returns.
Survival: The 1-year relative survival for lung cancer increased
from 37% in 1975-1979 to 43% in 2003-2006, largely due to
improvements in surgical techniques and combined therapies.
However, the 5-year survival rate for all stages combined is only
16%. The 5-year survival rate is 52% for cases detected when the
disease is still localized, but only 15% of lung cancers are diag-
nosed at this early stage. The 5-year survival for small cell lung
cancer (6%) is lower than that for non-small cell (17%).
Lymphoma
New cases: An estimated 70,130 new cases of lymphoma will
occur in 2012. Lymphoma is cancer of the lymphocytes, a type of
white blood cell, and is classified as Hodgkin (9,060 cases in 2012)
or non-Hodgkin (70,130 cases in 2012). Incidence rates were stable
in men and women for both non-Hodgkin and Hodgkin lymphoma
from 2004 to 2008. However, non-Hodgkin lymphoma (NHL)
encompasses a wide variety of disease subtypes for which inci-
dence patterns vary.
Deaths: An estimated 20,130 deaths from lymphoma will occur
in 2012 (Hodgkin lymphoma, 1,190; non-Hodgkin lymphoma,
18,940). Death rates for NHL began decreasing in 1998 in both
men and women; from 2004 to 2008, rates decreased 2.8% per
year in men and 3.4% per year in women. Death rates for Hodgkin
lymphoma have been decreasing in both men and women for the
past four decades. Declines in lymphoma death rates reflect
improvements in treatment over time.
Signs and symptoms: Symptoms may include swollen lymph
nodes, itching, night sweats, fatigue, unexplained weight loss,
and intermittent fever.
Risk factors: Like most cancers, the risk of developing NHL
increases with age. In contrast, the risk of Hodgkin lymphoma is
highest during adolescence and early adulthood. In most cases of
lymphoma the cause is unknown, although various risk factors
associated with altered immune function have been identified.
Non-Hodgkin lymphoma risk is elevated in persons who receive
immune suppressants to prevent organ transplant rejection, in
people with severe autoimmune conditions, and in people
infected with human immunodeficiency virus (HIV) and human
T-cell leukemia virus type I. Epstein Barr virus causes Burkitt
lymphoma (an aggressive type of NHL that occurs most often in
children and young adults) and is associated with a number of
autoimmune-related NHLs and some types of Hodgkin lym-
phoma. H. pylori infection increases the risk of gastric lymphoma.
A family history of lymphoma and a growing number of common
genetic variations are associated with modestly increased risk.
Occupational and environmental exposures to certain chemicals
may also be associated with moderately increased risk.
Treatment: Non-Hodgkin lymphoma patients are usually treated
with chemotherapy; radiation, alone or in combination with
chemotherapy, is used less often. Highly specific monoclonal
antibodies directed at lymphoma cells, such as rituximab
(Rituxan) and alemtuzumab (Campath), are used for initial
treatment and recurrence of some types of NHL, as are antibodies
linked to a radioactive atom, such as ibritumomab tiuxetan
(Zevalin) and tositumomab (Bexxar). High-dose chemotherapy
with stem cell transplantation and low-dose chemotherapy with
stem cell transplantation (called nonmyeloablative) may be
options if NHL persists or recurs after standard treatment.
Cancer Facts & Figures 2012 17
Hodgkin lymphoma is usually treated with chemotherapy, radia-
tion therapy, or a combination of the two, depending on stage and
cell type of the disease. Bone marrow or stem cell transplanta-
tion may be an option if these are not effective. The FDA recently
approved the targeted drug brentuximab vedotin (Adcetris) to
treat Hodgkin lymphoma (as well as a rare form of NHL) in
patients whose disease has failed to respond to other treatment.
Survival: Survival varies widely by cell type and stage of disease.
For NHL, the overall 1- and 5-year relative survival is 81% and 67%,
respectively; survival declines to 55% at 10 years after diagnosis.
For Hodgkin lymphoma, the 1-, 5-, and 10-year relative survival
rates are 92%, 84%, and 79%, respectively.
Five-year Relative Survival Rates* (%) by Stage at Diagnosis, 2001-2007
All Stages Local Regional Distant All Stages Local Regional Distant
Breast (female) 89 99 84 23 Ovary 44 92 72 27
Colon & rectum 64 90 69 12 Pancreas 6 22 9 2
Esophagus 17 37 18 3 Prostate 99 100 100 29
Kidney
†
70 91 63 11 Stomach 26 62 28 4
Larynx 61 77 42 33 Testis 95 99 96 73
Liver
‡
14 27 9 4 Thyroid 97 100 97 56
Lung & bronchus 16 52 24 4 Urinary bladder
§
78 71 35 5
Melanoma of the skin 91 98 61 15 Uterine cervix 69 91 57 19
Oral cavity & pharynx 61 82 56 34 Uterine corpus 82 96 67 16
*Rates are adjusted for normal life expectancy and are based on cases diagnosed in the SEER 17 areas from 2001-2007, followed through 2008.
†Includes renal pelvis. ‡Includes intrahepatic bile duct. § Rate for in situ cases is 97%.
Local: an invasive malignant cancer confined entirely to the organ of origin. Regional: a malignant cancer that 1) has extended beyond the limits of the organ of origin
directly into surrounding organs or tissues; 2) involves regional lymph nodes by way of lymphatic system; or 3) has both regional extension and involvement of regional
lymph nodes. Distant: a malignant cancer that has spread to parts of the body remote from the primary tumor either by direct extension or by discontinuous metastasis
to distant organs, tissues, or via the lymphatic system to distant lymph nodes.
Source: Howlader N, Krapcho M, Neyman N, et al. (eds). SEER Cancer Statistics Review, 1975-2008, National Cancer Institute, Bethesda, MD,
www.seer.cancer.gov/csr/1975_2008/, 2011.
American Cancer Society, Surveillance Research 2012
Oral Cavity and Pharynx
New cases: An estimated 40,250 new cases of cancer of the oral
cavity and pharynx (throat) are expected in 2012. Incidence
rates are more than twice as high in men as in women. From
2004 to 2008, incidence rates declined by 1.0% per year in women
and were stable in men. However, recent studies have shown
that incidence is increasing for cancers of the oropharynx that
are associated with human papillomavirus (HPV) infection
among white men and women.
Deaths: An estimated 7,850 deaths from oral cavity and pharynx
cancer are expected in 2012. Death rates have been decreasing
over the past three decades; from 2004 to 2008, rates decreased
by 1.2% per year in men and by 2.2% per year in women.
Signs and symptoms: Symptoms may include a sore in the throat
or mouth that bleeds easily and does not heal, a red or white
patch that persists, a lump or thickening, ear pain, a neck mass,
or coughing up blood. Difficulties in chewing, swallowing, or
moving the tongue or jaws are often late symptoms.
Risk factors: Known risk factors include all forms of smoked
and smokeless tobacco products and excessive consumption of
alcohol. Many studies have reported a synergism between smok-
ing and alcohol use, resulting in a more than 30-fold increased
risk for individuals who both smoke and drink heavily. HPV
infection is associated with cancers of the tonsil, base of tongue,
and some other sites within the oropharynx and is believed to be
transmitted through sexual contact.
Early detection: Cancer can affect any part of the oral cavity,
including the lip, tongue, mouth, and throat. Through visual
inspection, dentists and primary care physicians can often detect
premalignant abnormalities and cancer at an early stage, when
treatment is both less extensive and more successful.
Treatment: Radiation therapy and surgery, separately or in
combination, are standard treatments; chemotherapy is added
for advanced disease. Targeted therapy with cetuximab (Erbitux)
may be combined with radiation in initial treatment or used
alone to treat recurrent cancer.
Survival: For all stages combined, about 84% of persons with oral
cavity and pharynx cancer survive 1 year after diagnosis. The 5-year
and 10-year relative survival rates are 61% and 50%, respectively.
Ovary
New cases: An estimated 22,280 new cases of ovarian cancer are
expected in the US in 2012. Ovarian cancer accounts for about
3% of all cancers among women. Incidence rates have been rela-
tively stable since 1992.
Deaths: An estimated 15,500 deaths are expected in 2012. Ovarian
cancer causes more deaths than any other cancer of the female
reproductive system. The death rate for ovarian cancer decreased
by 1.9% per year from 2004 to 2008.
18 Cancer Facts & Figures 2012
Signs and symptoms: Early ovarian cancer usually has no
obvious symptoms. Studies have indicated, however, that some
women may experience persistent, nonspecific symptoms, such
as bloating, pelvic or abdominal pain, difficulty eating or feeling
full quickly, or urinary urgency or frequency. Women who expe-
rience such symptoms daily for more than a few weeks should
seek prompt medical evaluation. The most common sign is
enlargement of the abdomen, which is caused by the accumula-
tion of fluid. Abnormal vaginal bleeding is rarely a symptom of
ovarian cancer, though it is a symptom of cervical and uterine
cancers.
Risk factors: The most important risk factor is a strong family
history of breast or ovarian cancer. Women who have had breast
cancer or who have tested positive for inherited mutations in
BRCA1 or BRCA2 genes are at increased risk. Studies indicate
that preventive surgery to remove the ovaries and fallopian tubes
in these women can decrease the risk of ovarian cancer. Other
medical conditions associated with increased risk include pelvic
inflammatory disease and a genetic condition called Lynch
syndrome. The use of estrogen alone as postmenopausal hormone
therapy has been shown to increase risk in several large studies.
Tobacco smoking increases risk of mucinous ovarian cancer.
Heavier body weight may be associated with increased risk of
ovarian cancer. Pregnancy, long-term use of oral contraceptives,
and tubal ligation reduce the risk of developing ovarian cancer;
hysterectomy also appears to decrease risk.
Early detection: There is currently no sufficiently accurate
screening test proven to be effective in the early detection of
ovarian cancer. Pelvic examination only occasionally detects
ovarian cancer, generally when the disease is advanced. However,
for women who are at high risk of ovarian cancer and women
who have persistent, unexplained symptoms, the combination
of a thorough pelvic exam, transvaginal ultrasound, and a blood
test for the tumor marker CA125 may be offered. Although one
clinical trial in the US showed that these tests had no effect on
ovarian cancer mortality when used as a screening tool, another
large screening trial using these methods is under way in the
United Kingdom, with results expected in 2015.
Trends in 5-year Relative Survival Rates* (%) by Race, US, 1975-2007
All races White African American
1975-77 1987-89 2001-2007 1975-77 1987-89 2001-2007 1975-77 1987-89 2001-2007
All sites 49 56 67
†
50 57 69
†
39 43 59
†
Brain 22 29 35
†
22 28 34
†
25 31 40
†
Breast (female) 75 84 90
†
76 85 91
†
62 71 77
†
Colon 51 60 65
†
51 61 67
†
45 53 55
†
Esophagus 5 10 19
†
6 11 20
†
3 7 13
†
Hodgkin lymphoma 72 79 86
†
72 80 88
†
70 72 81
†
Kidney & renal pelvis 50 57 71
†
50 57 71
†
49 55 68
†
Larynx 66 66 63
†
67 67 65 59 56 52
Leukemia 34 43 57
†
35 44 57
†
33 36 50
†
Liver & intrahepatic bile duct 3 5 15
†
3 6 15
†
2 3 10
†
Lung & bronchus 12 13 16
†
12 13 17
†
11 11 13
†
Melanoma of the skin 82 88 93
†
82 88 93
†
58
‡
79
‡
73
‡
Myeloma 25 28 41
†
25 27 42
†
30 30 41
†
Non-Hodgkin lymphoma 47 51 70
†
47 52 71
†
48 46 62
†
Oral cavity & pharynx 53 54 63
†
54 56 65
†
36 34 45
†
Ovary 36 38 44
†
35 38 43
†
42 34 36
Pancreas 2 4 6
†
3 3 6
†
2 6 4
†
Prostate 68 83 100
†
69 85 100
†
61 72 98
†
Rectum 48 58 68
†
48 59 69
†
45 52 61
†
Stomach 15 20 27
†
14 19 26
†
16 19 27
†
Testis 83 95 96
†
83 95 97
†
73
‡#
88
‡
86
Thyroid 92 95 97
†
92 94 98
†
90 92 95
Urinary bladder 73 79 80
†
74 80 81
†
50 63 64
†
Uterine cervix 69 70 69 70 73 70 65 57 61
Uterine corpus 87 83 83
†
88 84 85
†
60 57 61
*Survival rates are adjusted for normal life expectancy and are based on cases diagnosed in the SEER 9 areas from 1975-77, 1987-89, and 2001 to 2007, and followed
through 2008. †The difference in rates between 1975-1977 and 2001-2007 is statistically significant (p <0.05). ‡The standard error is between 5 and 10 percentage
points. #Survival rate is for cases diagnosed in 1978-1980.
Source: Howlader N, Krapcho M, Neyman N, et al. (eds). SEER Cancer Statistics Review, 1975-2008, National Cancer Institute, Bethesda, MD.
seer.cancer.gov/csr/1975_2008/, 2011.
American Cancer Society, Surveillance Research, 2012
Cancer Facts & Figures 2012 19
Treatment: Treatment includes surgery and usually chemo-
therapy. Surgery usually involves removal of one or both ovaries
and fallopian tubes (salpingo-oophorectomy) and the uterus
(hysterectomy). In younger women with very early stage tumors
who wish to have children, only the involved ovary and fallopian
tube may be removed. Among patients with early ovarian cancer,
more complete surgical staging has been associated with better
outcomes. For women with advanced disease, surgically removing
all abdominal metastases enhances the effect of chemotherapy
and helps improve survival. For women with stage III ovarian
cancer that has been optimally debulked (removal of as much
of the cancerous tissue as possible), studies have shown that
chemotherapy administered both intravenously and directly into
the abdomen improves survival. Studies have also found that
ovarian cancer patients whose surgery is performed by a gyne-
cologic oncologist have more successful outcomes. Clinical
trials are currently under way to test targeted drugs such as
bevacizumab and cediranib in the treatment of ovarian cancer.
Survival: Relative survival varies by age; women younger than
65 are twice as likely to survive 5 years (57%) following diagnosis
as women 65 and older (27%). Overall, the 1-, 5-, and 10-year rela-
tive survival of ovarian cancer patients is 75%, 44%, and 35%,
respectively. If diagnosed at the localized stage, the 5-year survival
rate is 93%; however, only 15% of all cases are detected at this
stage, usually incidentally during another medical procedure.
The majority of cases (63%) are diagnosed at distant stage. For
women with regional and distant disease, 5-year survival rates
are 72% and 27%, respectively.
Pancreas
New cases: An estimated 43,920 new cases of pancreatic cancer
are expected to occur in the US in 2012. Since 2004, incidence
rates of pancreatic cancer have been increasing by 1.5% per year.
Deaths: An estimated 37,390 deaths are expected to occur in 2012,
about the same number in women (18,540) as in men (18,850).
During 2004 to 2008, the death rate for pancreatic cancer increased
by 0.4% per year.
Signs and symptoms: Cancer of the pancreas often develops
without early symptoms. Symptoms may include weight loss,
pain in the upper abdomen that may radiate to the back, and
occasionally glucose intolerance (high blood glucose levels).
Tumors that develop near the common bile duct may cause a
blockage that leads to jaundice (yellowing of the skin and eyes),
which can sometimes allow the tumor to be diagnosed at an
early stage.
Risk factors: Tobacco smoking and smokeless tobacco use
increase the risk of pancreatic cancer; incidence rates are about
twice as high for cigarette smokers as for nonsmokers. Risk also
increases with a family history of pancreatic cancer and a per-
sonal history of pancreatitis, diabetes, obesity, and possibly high
levels of alcohol consumption. Individuals with Lynch syndrome
and certain other genetic syndromes are also at increased risk.
Though evidence is still accumulating, consumption of red meat
may increase risk.
Early detection: At present, there is no widely used method for
the early detection of pancreatic cancer, though research is under
way in this area.
Treatment: Surgery, radiation therapy, and chemotherapy are
treatment options that may extend survival and/or relieve
symptoms in many patients, but seldom produce a cure. Less
than 20% of patients are candidates for surgery because pancre-
atic cancer is usually detected after it has spread beyond the
pancreas; even when surgery is performed, it often cannot
remove all of the cancer. For patients who do undergo surgery,
adjuvant treatment with the chemotherapy drug gemcitabine
lengthens survival. The targeted anticancer drug erlotinib
(Tarceva) has demonstrated a small improvement in advanced
pancreatic cancer survival when used in combination with
gemcitabine. Clinical trials with several new agents, combined
with radiation and surgery, may offer improved survival and
should be considered as a treatment option.
Survival: For all stages combined, the 1-and 5-year relative
survival rates are 26% and 6%, respectively. Even for those people
diagnosed with local disease, the 5-year survival is only 22%.
More than half of patients are diagnosed at a distant stage, for
which 5-year survival is 2%.
Prostate
New cases: An estimated 241,740 new cases of prostate cancer
will occur in the US during 2012. Prostate cancer is the most
frequently diagnosed cancer in men aside from skin cancer. For
reasons that remain unclear, incidence rates are significantly
higher in African Americans than in whites, 241 (per 100,000 men)
versus 149, respectively, in 2008. Incidence rates for prostate
cancer changed substantially between the mid-1980s and mid-
1990s and have since fluctuated widely from year to year, in
large part reflecting changes in prostate cancer screening with
the prostate-specific antigen (PSA) blood test. Since 2004, inci-
dence rates have decreased by 2.7% per year among men 65 years
of age and older and have remained stable among men younger
than 65 years.
Deaths: With an estimated 28,170 deaths in 2012, prostate can-
cer is the second-leading cause of cancer death in men. Prostate
cancer death rates have been decreasing since the early 1990s in
both African Americans and whites. Although death rates have
decreased more rapidly among African American than white
men, rates in African Americans remain more than twice as high
as those in whites. Prostate cancer death rates decreased 3.0%
per year in white men and 3.5% per year in African American
men from 2004 to 2008.
20 Cancer Facts & Figures 2012
Signs and symptoms: Early prostate cancer usually has no
symptoms. With more advanced disease, men may experience
weak or interrupted urine flow; inability to urinate or difficulty
starting or stopping the urine flow; the need to urinate frequently,
especially at night; blood in the urine; or pain or burning with
urination. Advanced prostate cancer commonly spreads to the
bones, which can cause pain in the hips, spine, ribs, or other areas.
Risk factors: The only well-established risk factors for prostate
cancer are increasing age, African ancestry, and a family history
of the disease. About 60% of all prostate cancer cases are diag-
nosed in men 65 years of age and older, and 97% occur in men 50
and older. African American men and Jamaican men of African
descent have the highest documented prostate cancer incidence
rates in the world. The disease is common in North America and
northwestern Europe, but less common in Asia and South Amer-
ica. Genetic studies suggest that strong familial predisposition
may be responsible for 5%-10% of prostate cancers. Recent stud-
ies suggest that a diet high in processed meat or dairy foods may
be a risk factor, and obesity appears to increase risk of aggres-
sive prostate cancer. There is some evidence that risk is elevated
in firefighters.
Prevention: The chemoprevention of prostate cancer is an active
area of research. Two drugs of interest, finasteride and dutasteride,
reduce the amount of certain male hormones in the body and
are already used to treat the symptoms of benign prostate
enlargement. Both drugs have been found to lower the risk of
prostate cancer by about 25% in large clinical trials with similar
potential side effects, including reduced libido and risk of erectile
dysfunction. However, it is not entirely clear which men are most
likely to gain benefit from prophylactic treatment with these
agents, and in December 2010, an advisory committee to the
FDA recommended against approval for both finasteride and
dutasteride for the prevention of prostate cancer based on risk-
benefit analyses.
Early detection: At this time, there are insufficient data to rec-
ommend for or against routine testing for early prostate cancer
detection with the PSA test. The American Cancer Society
recommends that beginning at age 50, men who are at average
risk of prostate cancer and have a life expectancy of at least 10
years receive information about the potential benefits and
known limitations associated with testing for early prostate
cancer detection and have an opportunity to make an informed
decision about testing. Men at high risk of developing prostate
cancer (African Americans or men with a close relative diagnosed
with prostate cancer before age 65) should have this discussion
with their health care provider beginning at age 45. Men at even
higher risk (because they have several close relatives diagnosed
with prostate cancer at an early age) should have this discussion
with their provider at age 40. All men should be given sufficient
information about the benefits and limitations of testing and
early detection to allow them to make a decision based on their
personal values and preferences.
Results from clinical trials designed to determine the efficacy of
PSA testing for reducing prostate cancer deaths have been
mixed; two European studies found a lower risk of death from
prostate cancer among men receiving PSA screening while a
study in the US found no reduction. Current research is explor-
ing new biologic markers for prostate cancer, as well as
alternative ages of screening initiation and timing of testing,
with the goal of identifying and treating men at highest risk for
aggressive disease while minimizing unnecessary testing and
over-treatment of men at low risk for prostate cancer death. See
page 64 for the American Cancer Society’s screening guidelines
for the early detection of prostate cancer.
Treatment: Treatment options vary depending on age, stage,
and grade of cancer, as well as other medical conditions. The
grade assigned to the tumor, typically called the Gleason score,
indicates the likely aggressiveness of the cancer and ranges from
2 (nonaggressive) to 10 (very aggressive). Surgery (open, laparo-
scopic, or robotic-assisted), external beam radiation, or radioactive
seed implants (brachytherapy) may be used to treat early stage
disease. Data show similar survival rates for patients with early
stage disease treated with any of these methods, and there is no
current evidence supporting a “best” treatment for prostate can-
cer. Adjuvant hormonal therapy may be indicated in some cases.
All of these treatments may impact a man’s quality of life through
side effects or complications that include urinary and erectile
difficulties. Accumulating evidence suggests that careful obser-
vation (“active surveillance”), rather than immediate treatment,
can be an appropriate option for men with less aggressive tumors
and for older men.
Hormonal therapy, chemotherapy, radiation, or a combination of
these treatments is used to treat more advanced disease. Hormone
treatment may control advanced prostate cancer for long periods
by shrinking the size or limiting the growth of the cancer, thus
helping to relieve pain and other symptoms. An option for some
men with advanced prostate cancer that is no longer responding
to hormones is a cancer vaccine known as sipuleucel-T (Provenge).
For this treatment, special immune cells are removed from a
man’s body, exposed to prostate proteins in a lab, and then re-
infused back into the body, where they attack prostate cancer
cells. Another option for these men is Abiraterone (Zytiga), which
was recently approved for the treatment of metastatic disease
that is resistant to hormone and chemotherapy.
Survival: More than 90% of all prostate cancers are discovered
in the local or regional stages, for which the 5-year relative sur-
vival rate approaches 100%. Over the past 25 years, the 5-year
relative survival rate for all stages combined has increased from
68% to almost 100%. According to the most recent data, 10- and
15-year relative survival rates are 98% and 91%, respectively.
Obesity and smoking are associated with an increased risk of
dying from prostate cancer.
Cancer Facts & Figures 2012 21
Skin
New cases: The number of basal cell and squamous cell skin
cancers (i.e., nonmelanoma skin cancers, or NMSC) is difficult to
estimate because these cases are not required to be reported to
cancer registries. One report on NMSC occurrence in the US
estimated that 3.5 million cases were diagnosed and 2.2 million
people were treated for the disease in 2006, with some patients
having multiple diagnoses. Most, but not all, of these forms of
skin cancer are highly curable. Melanoma is expected to be
diagnosed in about 76,250 persons in 2012, accounting for less
than 5% of all skin cancer cases but the vast majority of skin can-
cer deaths. Melanoma is 10 times more common in whites than
in African Americans. Although before age 40, incidence rates
are higher in women than in men, after 40, rates are almost
twice as high in men as in women. Melanoma incidence rates
have been increasing for at least 30 years. Since 2004, incidence
rates among whites have been increasing by almost 3% per year
in both men and women.
Deaths: An estimated 12,190 deaths (9,180 from melanoma and
3,010 from other nonepithelial skin cancers) will occur in 2012.
The death rate for melanoma has been declining rapidly in whites
younger than 50 years of age; from 2004 to 2008, rates decreased
by 2.9% per year in men and by 2.3% per year in women. In contrast,
among whites 50 years of age and older, death rates increased by
1.0% per year in men and have been stable in women during this
same time period.
Signs and symptoms: Important warning signs of melanoma
include changes in size, shape, or color of a mole or other skin
lesion or the appearance of a new growth on the skin. Changes
that occur over a few days are usually not cancer, but changes
that progress over a month or more should be evaluated by a
doctor. Basal cell carcinomas may appear as growths that are
flat, or as small, raised, pink or red, translucent, shiny areas that
may bleed following minor injury. Squamous cell cancer may
appear as growing lumps, often with a rough surface, or as flat,
reddish patches that grow slowly. Another sign of basal and
squamous cell skin cancers is a sore that doesn’t heal.
Risk factors: Risk factors vary for different types of skin cancer.
For melanoma, major risk factors include a personal or family
history of melanoma and the presence of atypical or numerous
moles (more than 50). Other risk factors for all types of skin can-
cer include sun sensitivity (sunburning easily, difficulty tanning,
natural blond or red hair color); a history of excessive sun expo-
sure, including sunburns; use of tanning booths; diseases that
suppress the immune system; and a past history of basal cell or
squamous cell skin cancers.
Prevention: Skin should be protected from intense sun expo-
sure by covering with tightly woven clothing and a wide-brimmed
hat, applying sunscreen that has a sun protection factor (SPF) of
15 or higher to unprotected skin, seeking shade (especially at
midday, when the sun’s rays are strongest), and avoiding sun-
bathing and indoor tanning. Sunglasses should be worn to
protect the skin around the eyes. Children in particular should be
protected from the sun because severe sunburns in childhood
may greatly increase risk of melanoma in later life. Tanning beds
and sun lamps, which provide an additional source of UV radia-
tion, are associated with cancer risk and should be avoided. In
2009, the International Agency for Research on Cancer upgraded
their classification of indoor tanning devices from “probably” to
“definitively” carcinogenic to humans after a reassessment of the
scientific evidence.
Early detection: At this time, the best way to detect skin cancer
early is to recognize changes in skin growths, including the
appearance of new growths. Adults should periodically examine
their skin so that they develop an awareness of any changes. New
or unusual lesions or a progressive change in a lesion’s appear-
ance (size, shape, or color, etc.) should be evaluated promptly by
a physician. Melanomas often start as small, mole-like growths
that increase in size and may change color. A simple ABCD
rule outlines the warning signals of the most common type of
melanoma: A is for asymmetry (one half of the mole does not
match the other half); B is for border irregularity (the edges are
ragged, notched, or blurred); C is for color (the pigmentation is
not uniform, with variable degrees of tan, brown, or black); D is
for diameter greater than 6 millimeters (about the size of a pencil
eraser). Other types of melanoma may not have these signs, so be
alert for any new or changing skin growths.
Treatment: Removal and microscopic examination of all suspi-
cious skin lesions are essential. Early stage basal and squamous
cell cancers can be removed in most cases by one of several
methods: surgical excision, electrodesiccation and curettage
(tissue destruction by electric current and removal by scraping
with a curette), or cryosurgery (tissue destruction by freezing).
Radiation therapy and certain topical medications may be used
in some cases. For malignant melanoma, the primary growth
and surrounding normal tissue are removed and sometimes a
sentinel lymph node is biopsied to determine stage. More exten-
sive lymph node surgery may be needed if the lymph nodes
contain cancer. Melanomas with deep invasion or that have spread
to lymph nodes may be treated with surgery, immunotherapy,
chemotherapy, and/or radiation therapy. Advanced cases of
melanoma are treated with palliative surgery, immunotherapy,
and/or chemotherapy, and sometimes radiation therapy. Two
newer targeted drugs, ipilimumab (Yervoy) and vemurafenib
(Zelboraf), have recently been approved by the FDA and may
extend survival in people with advanced melanoma.
Survival: Most basal and squamous cell cancers can be cured,
especially if the cancer is detected and treated early. Melanoma
is also highly curable if detected in its earliest stages and treated
properly. However, melanoma is more likely than other skin
tumors to spread to other parts of the body. The 5-and 10-year
22 Cancer Facts & Figures 2012
relative survival rates for persons with melanoma are 91% and
89%, respectively. For localized melanoma (84% of cases), the
5-year survival rate is 98%; survival declines to 62% and 15% for
regional and distant stage disease, respectively.
Thyroid
New cases: An estimated 56,460 new cases of thyroid cancer are
expected to be diagnosed in 2012 in the US, with 3 in 4 cases
occurring in women. The incidence rate of thyroid cancer has
been increasing sharply since the mid-1990s, and it is the fastest-
increasing cancer in both men and women. Since 2004, incidence
rates have been increasing by 5.5% per year in men and 6.6% per
year in women.
Deaths: An estimated 1,780 deaths from thyroid cancer are
expected in 2012 in the US. From 2004 to 2008, the death rate for
thyroid cancer increased slightly from 0.47 (per 100,000) to 0.50
in men, and from 0.47 to 0.52 in women.
Signs and symptoms: The most common symptom of thyroid
cancer is a lump in the neck that is noticed by a patient or felt by
a health care provider in a clinical exam. Other symptoms
include a tight or full feeling in the neck, difficulty breathing or
swallowing, hoarseness or swollen lymph nodes, and pain in the
throat or neck that does not go away. Although most lumps in
the thyroid gland are not cancerous, individuals who detect an
abnormality should seek timely medical attention.
Risk factors: Risk factors for thyroid cancer include being
female, having a history of goiter (enlarged thyroid) or thyroid
nodules, a family history of thyroid cancer, and radiation expo-
sure related to medical treatment during childhood. Radiation
exposure as a result of radioactive fallout from atomic weapons
testing and nuclear power plant accidents, such as Chernobyl,
has also been linked to increased risk of thyroid cancer, espe-
cially in children. Certain rare genetic syndromes also increase
risk. People who test positive for an abnormal gene that causes a
hereditary form of thyroid cancer can decrease the chance of
developing the disease by surgical removal of the thyroid gland.
Unlike other adult cancers, for which older age increases risk,
80% of newly diagnosed thyroid cancer patients are under 65
years of age.
Early detection: At present, there is no screening test recom-
mended for the early detection of thyroid cancer in people
without symptoms. However, because symptoms usually develop
early, most thyroid cancers (68%) are diagnosed at an early stage.
Tests used in the evaluation of thyroid nodules include: blood
tests to determine levels of hormones related to normal functions
of the thyroid gland; medical imaging techniques to determine
the size and characteristics of the nodule and nearby lymph
nodes; and biopsy to determine if the cells in the nodule are
benign or malignant.
Treatment: Most thyroid cancers are highly curable, though
about 5% of cases (medullary and anaplastic) are more aggressive
and tend to spread to other organs. Treatment depends on the
cell type, tumor size, and extent of the disease. The first choice
of treatment is surgery in nearly all cases. Total removal of the
thyroid gland (thyroidectomy), with or without lymph node
removal, is recommended for most patients. Treatment with
radioactive iodine (I-131) after surgery to destroy any remaining
thyroid tissue may be recommended for more advanced disease.
Hormone therapy is given to replace hormones normally pro-
duced by the thyroid gland after thyroidectomy and to prevent
the body from making thyroid-stimulating hormone, decreasing
the likelihood of recurrence.
Survival: The 5-year relative survival rate for all thyroid cancer
patients is 97%. However, survival varies by stage, age at diagnosis,
and disease subtype. The 5-year survival rate approaches 100%
for localized disease, is 97% for regional stage disease, and 56%
for distant stage disease. For all stages combined, survival is
highest for patients under 45 years of age (almost 100%), and
progressively decreases to 82% for those 75 or older.
Urinary Bladder
New cases: An estimated 73,510 new cases of bladder cancer are
expected to occur in 2012. Since 2004, bladder cancer incidence
rates have been stable in men and decreasing slightly (by 0.3%
per year) in women, trends that have persisted since 1992. Bladder
cancer incidence is about four times higher in men than in
women, and is almost twice as high in white men as in African
American men.
Deaths: An estimated 14,880 deaths will occur in 2012. From 2004
to 2008, death rates were stable in men and decreasing slowly in
women (by 0.5% per year).
Signs and symptoms: The most common symptom is blood in
the urine. Other symptoms may include increased frequency or
urgency of urination and irritation during urination.
Risk factors: Smoking is the most well-established risk factor for
bladder cancer. Smokers’ risk of bladder cancer is approximately
four-fold that of nonsmokers’, and smoking is estimated to cause
about half of all bladder cancer cases in both men and women.
Workers in the dye, rubber, or leather industries, painters, and
people who live in communities with high levels of arsenic in the
drinking water also have increased risk.
Early detection: There is currently no screening method recom-
mended for people at average risk. Bladder cancer is diagnosed
by microscopic examination of cells from urine or bladder tissue
and examination of the bladder wall with a cystoscope, a slender
tube fitted with a lens and light that can be inserted through the
urethra. These tests may be used to screen people at increased
risk due to occupational exposure or certain bladder birth
Cancer Facts & Figures 2012 23
defects, or for follow up after bladder cancer treatment to detect
recurrent or new tumors.
Treatment: Surgery, alone or in combination with other treat-
ments, is used in more than 90% of cases. Localized cancers may
be treated by administering immunotherapy or chemotherapy
directly into the bladder after surgery. More advanced cancers
may require removal of the entire bladder (cystectomy). Chemo-
therapy, alone or with radiation before cystectomy, has improved
treatment results. Timely follow-up care is extremely important
because of the high rate of bladder cancer recurrence.
Survival: For all stages combined, the 5-year relative survival
rate is 78%. Survival declines to 71% at 10 years and 65% at 15
years after diagnosis. Half of all bladder cancer patients are
diagnosed while the tumor is in situ (noninvasive, present only
in the layer of cells in which the cancer developed), for which the
5-year survival is 97%. Patients with invasive tumors diagnosed
at a localized stage have a 5-year survival rate of 71%; 35% of
cancers are detected at this early stage. For regional and distant
staged disease, 5-year survival is 35% and 5%, respectively.
Uterine Cervix
New cases: An estimated 12,170 cases of invasive cervical
cancer are expected to be diagnosed in 2012. Incidence rates
have declined over most of the past several decades in both
white and African American women. Since 2004, rates have
decreased by 2.1% per year in women younger than 50 years of
age and by 3.1% per year in women 50 and older.
Deaths: An estimated 4,220 deaths from cervical cancer are
expected in 2012. Mortality rates declined rapidly in past decades,
due to prevention and early detection as a result of screening
with the Pap test, but have slowed in recent years. From 2004 to
2008, rates decreased by 2.6% per year in African American
women and were stable in white women.
Signs and symptoms: Symptoms usually do not appear until
abnormal cervical cells become cancerous and invade nearby
tissue. When this happens, the most common symptom is abnor-
mal vaginal bleeding. Bleeding may start and stop between
regular menstrual periods, or it may occur after sexual inter-
course, douching, or a pelvic exam. Menstrual bleeding may last
longer and be heavier than usual. Bleeding after menopause or
increased vaginal discharge may also be symptoms.
Risk factors: The primary cause of cervical cancer is infection
with certain types of human papillomavirus (HPV). While women
who begin having sex at an early age or who have had many
sexual partners are at increased risk for HPV infection and
cervical cancer, a woman may be infected with HPV even if she
has had only one sexual partner. In fact, it is important to under-
stand that HPV infections are common in healthy women and
are typically cleared successfully by the immune system; only
rarely does the infection persist and result in cervical cancer.
Persistence of HPV infection and progression to cancer may be
influenced by many factors, including immunosuppression, high
parity (number of childbirths), and cigarette smoking. Long-term
use of oral contraceptives (birth control pills) is also associated
with increased risk of cervical cancer.
Prevention: There are two vaccines approved for the prevention
of the most common types of HPV infection that cause cervical
cancer; Gardasil is recommended for use in females 9 to 26 years
of age, and Cervarix in females 9 to 25 years of age. Gardasil is
also approved for use in males 9 to 26 years of age to prevent anal
cancer and associated precancerous lesions; approximately 90%
of anal cancers have been linked to HPV infection. These vaccines
cannot protect against established infections, nor do they protect
against all HPV types.
Screening can prevent cervical cancer by detecting precancerous
lesions. As screening has become more common, precancerous
lesions of the cervix are detected far more frequently than inva-
sive cancer. The Pap test is the most widely used cervical cancer
screening method. It is a simple procedure in which a small
sample of cells is collected from the cervix and examined under
a microscope. Pap tests are effective, but not perfect. Sometimes
results are reported as normal when abnormal cells are present
(false negative), and likewise, sometimes test results are abnormal
when no abnormal cells are present (false positive). DNA tests
that detect HPV strains associated with cervical cancer may be
used in conjunction with the Pap test, either as an additional
screening test or when Pap test results are uncertain. Fortunately,
most cervical precancers develop slowly, so nearly all cancers
can be prevented if a woman is screened regularly. It is important
for all women, even those who have received the HPV vaccine, to
follow cervical cancer screening guidelines.
Early detection: In addition to preventing cancer, cervical
cancer screening can detect cancer early, when treatment is
most successful. Today, liquid-based Pap tests are used by most
clinicians as an alternative to conventional Pap tests. See page
64 for the American Cancer Society’s screening guidelines for
the early detection of cervical cancer.
Treatment: Preinvasive lesions may be treated by electrocoagu-
lation (the destruction of tissue through intense heat by electric
current), cryotherapy (the destruction of cells by extreme cold),
laser ablation, or local surgery. Invasive cervical cancers are
generally treated with surgery, radiation, or both, and with
chemotherapy in selected cases.
Survival: One- and 5-year relative survival rates for cervical
cancer patients are 87% and 69%, respectively. The 5-year survival
rate for patients diagnosed with localized disease is 91%. Cervical
cancer is diagnosed at an early stage more often in whites (49%)
than in African Americans (42%) and more often in women younger
than 50 years of age (60%) than in women 50 and older (34%).