Báo cáo khoa học: Prohibitin is expressed in pancreatic b-cells and protects against oxidative and proapoptotic effects of ethanol pdf
Bạn đang xem bản rút gọn của tài liệu. Xem và tải ngay bản đầy đủ của tài liệu tại đây (830.86 KB, 13 trang )
Prohibitin is expressed in pancreatic b-cells and protects
against oxidative and proapoptotic effects of ethanol
Jong Han Lee
1
, K. Hoa Nguyen
1
, Suresh Mishra
1,2
and B. L. Gre
´
goire Nyomba
1,2
1 Department of Physiology, Diabetes Research Group, University of Manitoba, Winnipeg, Canada
2 Department of Internal Medicine, Diabetes Research Group, University of Manitoba, Winnipeg, Canada
Introduction
Pancreatic b-cell dysfunction is a prerequisite for the
development of type 2 diabetes. The prevalence of type
2 diabetes is related to lifestyle choices, such as high
calorie diets, lack of physical activity and smoking.
Alcoholism is a known risk factor for type 2 diabetes,
although moderate ethanol consumption may have
health benefits [1]. The diabetogenic effects of ethanol
may include its contribution to excess caloric intake
and obesity, induction of pancreatitis and impairment
of liver function [2]. Recent studies have found that
ethanol increases insulin resistance in liver and skeletal
muscle [3–5]. However, a limited number of studies
Keywords
apoptosis; oxidative stress; prohibitin; b-cells
Correspondence
B. L. G. Nyomba, Diabetes Research Group,
University of Manitoba, 715 McDermot
Avenue Room 834, Winnipeg, Manitoba,
Canada R3E 3P4
Fax: +1 204 789 3940
Tel: +1 204 789 3697
E-mail:
(Received 19 October 2009, revised 12
November 2009, accepted 19 November
2009)
doi:10.1111/j.1742-4658.2009.07505.x
Pancreatic b-cell dysfunction is a prerequisite for the development of type 2
diabetes. Alcoholism is a diabetes risk factor and ethanol increases oxida-
tive stress in b-cells, whereas the mitochondrial chaperone prohibitin
(PHB) has antioxidant effects in several cell types. In the present study we
investigated whether PHB is expressed in b-cells and protects these cells
against deleterious effects of ethanol, using INS-1E and RINm5F b-cell
lines. Endogenous PHB was detected by western blot and immunocyto-
chemistry. Reactive oxygen species were determined by 5-(and-6)-chloro-
methyl-2¢,7¢-dichlorodihydrofluorescein diacetate fluorescence assay, and
mitochondrial activity was assessed by 3-(4,5-dimethylthiazol-2-yl)-
2,5-diphenyl-tetrazolium bromide (MTT) reduction, uncoupling protein 2
expression and ATP production. Cell death was determined by Hoechst
33342 staining, cleaved caspase-3 levels and flow cytometry. PHB was
expressed in b-cells under normal conditions and colocalized with Hoechst
33342 in the nucleus and with the mitochondrial probe Mitofluor in the
perinuclear area. In ethanol-treated cells, MTT reduction and ATP produc-
tion decreased, whereas reactive oxygen species, uncoupling protein 2 and
cleaved caspase-3 levels increased. In addition, flow cytometry analysis
showed an increase of apoptotic cells. Ethanol treatment increased PHB
expression and induced PHB translocation from the nucleus to the mito-
chondria. PHB overexpression decreased the apoptotic effects of ethanol,
whereas PHB knockdown enhanced these effects. The protective effects of
endogenous PHB were recapitulated by incubation of the cells with
recombinant human PHB. Thus, PHB is expressed in b-cells, increases with
oxidative stress and protects the cells against deleterious effects of ethanol.
Abbreviations
CM-H
2
DCF, 5-(and-6)-chloromethyl-2¢,7¢-dichlorodihydrofluorescein; CM-H
2
DCFDA, 5-(and-6)-chloromethyl-2¢,7¢-dichlorodihydrofluorescein
diacetate; FITC, fluorescein isothiocyanate; MTT, 3-(4,5-dimethylthiazol-2-yl)-2,5-diphenyl-tetrazolium bromide; NaCl ⁄ P
i
, phosphate-buffered
saline; PHB, prohibitin; ROS, reactive oxygen species; SEM, standard error of the mean; siRNA, short inhibitory RNA; UCP2, uncoupling
protein 2.
488 FEBS Journal 277 (2010) 488–500 ª 2009 The Authors Journal compilation ª 2009 FEBS
have reported on deleterious effects of ethanol on
b-cells, where ethanol inhibited insulin secretion [6–8].
Excessive ethanol consumption leads to cell injury
through the production of reactive oxygen species
(ROS) and mitochondrial dysfunction [9,10]. Increased
ROS production is one of the earliest events in glucose
intolerance and it may be a mechanism of pancreatic
b-cell dysfunction in type 2 diabetes, as b-cells are very
sensitive to oxidative stress due to their insufficient
antioxidant mechanisms.
Prohibitin (PHB), a 30 kDa evolutionarily conserved
protein, is present in multiple cellular compartments
[11], including the cell nucleus [12], the plasma mem-
brane [13–15] and lipid droplets shed from adipocytes
[16] and breast cancer cells [17]. PHB is an anti-inflam-
matory [18] and tumor suppressor protein, with muta-
tions occurring in various cancers [19]. Recent studies
suggest that PHB may be a regulator of transcription, a
chaperone in the mitochondria [20,21] and a secreted
protein [22] found in the circulation [23]. It is possible
that PHB, in its role as a mitochondrial chaperone, pro-
tects cells against oxidative stress [21,24,25]. However, it
is not known if PHB is expressed or plays a role in pan-
creatic b-cells. The objective of the present study was to
investigate the expression and antioxidant effects of
PHB in pancreatic b-cells exposed to ethanol.
Results
Effects of ethanol and recombinant PHB on b-cell
mitochondrial function and apoptosis
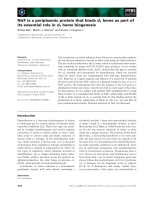
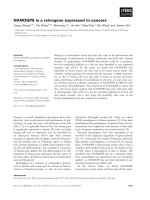
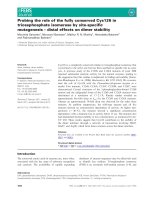
We first generated a dose–response curve of ethanol
toxicity using the 3-(4,5-dimethylthiazol-2-yl)-2,5-
diphenyl-tetrazolium bromide (MTT) assay in INS-1E
cells incubated with ethanol for 24–48 h (Fig. 1). At
24 h there was a statistically significant deleterious
effect starting at 80 mm ethanol (Fig. 1A), confirming
our previous report in RINm5F cells [26]. At this con-
centration, MTT reduction was decreased by 30%
(Fig. 1A); this effect of ethanol did not increase further
after treatment of INS-1E cells for 48 h (Fig. 1B). This
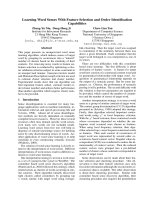
effect was comparable with that observed in RINm5F
cells at a low glucose concentration of 5.5 mm
(Fig. 2A), which is much lower than glucose concen-
trations recommended for b-cell culture [27]. We then
determined ROS production in RINm5F cells and
found that ethanol increased ROS production by 43%,
unlike the low glucose concentration, which decreased
ROS production by 80% compared with the high
glucose concentration (Fig. 2B).
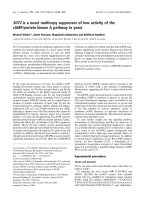
Because oxidative stress can induce uncoupling pro-
tein 2 (UCP2) expression at the expense of ATP synthe-
sis [28], we then determined the level of UCP2 protein
and ATP production in RINm5F cells. Ethanol
increased the UCP2 protein level by 42% (Fig. 2C), in
direct proportion with ROS production, whereas ATP
production decreased by 40% (Fig. 2D), in inverse
proportion with the UCP2 protein level.
Because exogenously applied PHB has been shown
to regulate cell metabolism in adipocytes [29], we were
also interested in the effects of recombinant PHB on
b-cells. In ethanol-exposed cells, ROS production
(Fig. 2B) and UCP2 protein levels (Fig. 2C) were both
significantly reduced, whereas ATP production was
increased, by exogenous PHB treatment (Fig. 2D).
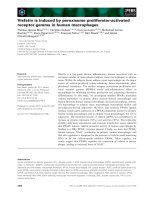
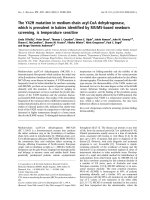
To explore ethanol toxicity further, we examined
b-cell apoptosis using flow cytometry with fluorescein
isothiocyanate (FITC)–annexin V staining, the cleaved
caspase-3 assay and Hoechst 33342 nuclear staining. In
cells exposed to ethanol, flow cytometry revealed the
apoptotic cell number to be increased by approximately
twofold (Fig. 3A–F), whereas the cleaved caspase-3 level
increased by 40% (Fig. 3G). Recombinant PHB pre-
vented b-cell apoptosis, as demonstrated by the normal
number of apoptotic cells shown by flow cytometry
0
20
40
60
80
100
120
0 20 mM 40 mM 60 mM
80 mM
100 mM
*
*
MTT (% of control)
ETOH
0
20
40
60
80
100
120
0 20 mM 40 mM 80 mM 120mM 160 mM 200 mM
ETOH
MTT (% of control)
*
*
*
**
A
B
Fig. 1. Effect of ethanol on MTT reduction in INS-1E cells. INS-1E
cells were incubated for 24 (A) or 48 h (B) in RPMI 1640 medium
containing various concentrations of ethanol. The results are
expressed as a percentage of the control (no ethanol) and shown
as the mean ± SEM. N = 4 experiments. *P < 0.05 versus control.
J. H. Lee et al. Effects of prohibitin in b-cells
FEBS Journal 277 (2010) 488–500 ª 2009 The Authors Journal compilation ª 2009 FEBS 489
(Fig. 3A–F) and a reduction in the cleaved caspase-3
level (Fig. 3G). In addition, with Hoechst staining the
nuclei appeared small and condensed after ethanol expo-
sure (Fig. 4A), also consistent with increased apoptosis,
but had a normal appearance after PHB treatment.
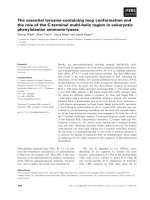
Cellular distribution of exogenous PHB
The fact that exogenous PHB had protective effects
against ethanol prompted us to determine the cellular
distribution of recombinant His-tagged PHB. Using a
fluorescence microscope, the His-tagged PHB did not
localize to the nucleus, but showed a perinuclear distri-
bution and colocalized with the mitochondrial dye
Mitofluor
TM
Red 589, confirming translocation of
exogenous PHB to the mitochondria (Fig. 4B,C). A
western blot of total cellular protein extracts using
anti-PHB serum showed two bands in cells incubated
with recombinant PHB, the top band corresponding to
His-tagged PHB (Fig. 5A). These data indicate that
exogenous PHB enters the cells.
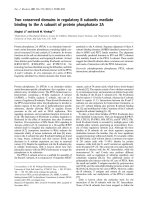
PHB is expressed in b-cells and increased by
ethanol
To determine the expression of PHB in b-cells we first
analyzed the PHB protein level by western blot and
mRNA expression. We confirmed that PHB protein
was present in b-cells, had a tendency to increase at
the low (5.5 mm) compared with the high (25 mm) glu-
cose concentrations, and clearly increased by 92% in
cells treated with ethanol (Fig. 5A,B). PHB mRNA
expression showed a similar expression pattern as the
protein level (Fig. 5C). To confirm mitochondrial
localization, cell extracts were fractionated prior to
western blot analysis. In cells exposed to ethanol, wes-
tern blot analysis showed a decrease in PHB protein in
the nuclear fraction (Fig. 5D) and an increase in the
cytoplasmic fraction (Fig. 5E), suggesting PHB protein
exclusion from the nucleus, whereas examination of
mitochondrial extracts indicated localization of PHB
to the mitochondria (Fig. 5F,G). We also used immu-
nocytochemistry and found endogenous PHB to be
present in the nucleus and in the perinuclear area
(Fig. 6C), the latter suggesting mitochondrial localiza-
tion.
Endogenous PHB protects b-cells against ethanol
toxicity
Because endogenous PHB has been reported to have
antiapoptotic effects in other cell systems [12,30], we
sought to investigate whether it protects b-cells against
ethanol toxicity. PHB overexpression (Fig. 7A)
decreased the cleaved caspase-3 level (Fig. 7B) and
increased MTT reduction (Fig. 7C) in ethanol-treated
cells. PHB had a similar effect in cells treated with
H
2
O
2
. In other experiments, cells were transfected with
ROS (% of control)
0
20
40
60
80
100
120
140
160
180
G1
G2 G2E G2P G2EP
P < 0.01
P < 0.05
P = 0.08
P < 0.01
0
200
400
600
800
G1 G2 G2E G2P G2EP
ATP (nmol·mg
–1
protein)
P < 0.05
P < 0.01
P < 0.01 P < 0.01
UCP2
(arbitrary units)
G1 G2 G2E G2P G2EP
P < 0.01
P < 0.01
P < 0.01
P < 0.05
0
0.2
0.4
0.6
0.8
1.0
1.2
1.4
UCP2
Actin
MTT (% of control)
P < 0.01 P < 0.01
0
20
40
60
80
100
120
G1 G2 G2E G2P G2EP
n = 7 n = 3
AB
CD
Fig. 2. Effect of ethanol and PHB in
RINm5F cells. RINm5F cells were incubated
for 24 h with or without ethanol (E, 80 m
M)
and with or without PHB (P, 10 n
M) in the
presence of glucose (G1: 5.5 m
M, G2:
25 m
M). MTT (A; n = 3–7 experiments),
ROS level (B; n = 3 experiments); UCP2
protein level (C; n = 3 experiments) and
ATP production (D; n = 4 experiments) were
determined as described in Materials and
methods. The results are expressed as the
mean ± SEM percentage of G2 for (A) and
(B); as the mean ± SEM arbitrary units rela-
tive to actin for (C); and as the mean ± SEM
for (D).
Effects of prohibitin in b-cells J. H. Lee et al.
490 FEBS Journal 277 (2010) 488–500 ª 2009 The Authors Journal compilation ª 2009 FEBS
PHB short inhibitory RNA (siRNA) (Fig. 8A,B) prior
to ethanol treatment, and this caused an increase in
cleaved caspase-3 in both RINm5F (Fig. 8C) and
INS-E1 cells (Fig. 8D). In a different approach, apop-
tosis of RINm5F cells was determined by counting free
floating cells (Fig. 8E) and found to be enhanced in
ethanol-treated cells transfected with PHB siRNA.
Discussion
Here we report for the first time that PHB is expressed
in pancreatic b-cells and may protect these cells against
oxidative stress and apoptosis. We induced oxidative
stress and apoptosis with ethanol, which has been
demonstrated in other cell types to cause such deleteri-
ous effects [31,32].
Ethanol has also been shown in a small number of
studies to alter pancreatic b-cell function. Rats chroni-
cally fed ethanol showed reduced b-cell volume [33],
and it has been reported that ethanol inhibits basal
and glucose-stimulated insulin secretion in rat islets
[6,34,35]. In a recent report, ethanol inhibited b-cell
metabolic activity judged by the MTT assay [34], in
agreement with the current study. We found that etha-
nol resulted in b-cell apoptosis with mitochondrial dys-
function shown by decreased MTT metabolism and
ATP production, and increased ROS production and
UCP2 levels. These alterations occurred at a physio-
logically relevant ethanol level of 80 mm (368 mgÆdL
)1
)
found in the blood of clinically nonintoxicated alcohol
drinkers [36]. ROS have been implicated in b-cell dys-
function and apoptosis in rodent models of diabetes
[37–40], and changes in mitochondrial function, includ-
ing increased ROS and UCP2 expression, lower ATP
and a decreased ATP ⁄ ADP ratio have also been docu-
mented in b-cells from patients with type 2 diabetes
% of apoptotic cells
P < 0.05
P < 0.01
P < 0.01
G1 G2 G2E G2P G2EP
0
0.2
0.4
0.6
0.8
1.0
1.2
1.4
1.6
AB
CD
G
G1 G2 G2E G2P G2EP
G1 G2 G2E G2P G2E
P
P < 0.05
Cleaved caspase 3 (arbitrary units)
Cleaved
caspase 3
Actin
~ 19 kDa
~ 17 kDa
Cell number
0
5
10
15
20
25
30
35
40
EF
10
0
10
1
10
2
10
3
10
0
10
1
10
2
10
3
10
0
10
1
10
2
10
3
10
0
10
1
10
2
10
3
10
0
10
1
10
2
10
3
10
0
10
1
10
2
10
3
10
0
10
1
10
2
10
3
10
0
10
1
10
2
10
3
10
0
10
1
10
2
10
3
10
0
10
1
10
2
10
3
PI log
PI log
PI log
PI log
PI log
Annexin V-FITC log
Annexin V-FITC log
Annexin V-FITC log Annexin V-FITC log
Annexin V-FITC log
F
13.7%
5.6%
9.7%
G
F
G
3.1%
F
23.7%
54
76
80
158
124
118
54
132
126
60
F
G
2.5%
10.4%
G
12.4%
F
10.6%
G
3.7%
Fig. 3. Effect of ethanol and PHB on apoptosis in RINm5F cells. RINm5F cells were incubated for 24 h as described in Fig. 2. Apoptosis
was then determined by flow cytometry. Histograms from representative flow cytometry experiments are shown in (A)–(E): (A) G1; (B) G2;
(C) G2E; (D) G2P; (E) G2EP. The percentage of apoptotic cells (percentage of FITC–annexin V versus propidium iodide-positive cells) obtained
from four independent experiments using each treatment are shown as the mean ± SEM in (F). As an additional proof of apoptosis, cleaved
caspase-3 was determined in cell extracts by western blot. (G) Representative blot of n = 3 experiments showing 17 and 19 kDa caspase-3
cleavage bands and the levels of 19 kDa cleaved caspase-3 expressed as the mean ± SEM arbitrary units relative to actin.
J. H. Lee et al. Effects of prohibitin in b-cells
FEBS Journal 277 (2010) 488–500 ª 2009 The Authors Journal compilation ª 2009 FEBS 491
[41]. Our recent study [26] and present data indicate
that ethanol causes oxidative stress in b-cells, which
could be deleterious, especially because these cells have
very low expression of antioxidant enzymes and are
particularly sensitive to oxidative stress [42].
RINm5F cell mitochondrial metabolism, as deter-
mined by MTT, at a 5.5 mm glucose concentration
was 35% less than that recorded at a 25 mm glucose
concentration, whereas ROS production at the lower
glucose concentration was 80% less than that found
at the high glucose concentration. These results are
consistent with increased oxidative phosphorylation,
which is the source of ROS, at glucose concentrations
significantly greater than 5.5 mm in these cells.
Although PHB is known to be expressed in many
tissues, this is the first report of its expression in pan-
creatic b-cells. Under normal conditions, PHB is found
in cell nuclei and the perinuclear area corresponding to
mitochondria, as reported in other cells [12,30]. In
b-cells treated with ethanol, the PHB protein level
increased and was predominantly found in the mito-
chondria. This finding is consistent with reports in
breast cancer cells showing that PHB is exported from
the nucleus upon apoptotic signaling [12,30]. The
increase in PHB and its export from the nucleus with
subsequent mitochondrial localization following etha-
nol exposure prompted us to investigate whether PHB
affected mitochondrial function in these cells. Because
PHB is found in the circulation, we hypothesized that
it may enter the cells.
His-tagged recombinant human PHB was shown to
enter the cells and localize to the mitochondria, espe-
cially in ethanol-treated cells. In addition, exogenous
PHB or overexpression of endogenous PHB pre-
vented metabolic alterations caused by ethanol,
whereas PHB deletion by siRNA enhanced ethanol
toxicity. These findings are reminiscent of recent
reports in granulosa cells, where overexpression of
PHB attenuated the ability of staurosporine and
serum withdrawal to induce apoptosis [12,25,30,43].
When granulosa cells were transfected with a PHB–
green fluorescence protein fusion construct, this
fusion protein moved from the cytoplasm into the
mitochondria and inhibited apoptosis. In a more
recent study, Theiss et al. [24] reported that in
inflammatory bowel diseases, PHB localizes primarily
G2 G2E G2P G2EPG1
A
B
C
D
Fig. 4. Localization of exogenous PHB in
RINm5F cells. RINm5F cells were incubated
for 24 h as described in Fig. 2 (n = 3 experi-
ments). (A) Hoechst 33342 (nuclei) staining;
(B) Mitofluor Red 589 (mitochondria) stain-
ing; (C) anti-His (exogenous PHB)-FITC stain-
ing; (D) merge. The arrows indicate staining
of His-tagged PHB in (C) or both PHB and
Mitofluor in (D).
Effects of prohibitin in b-cells J. H. Lee et al.
492 FEBS Journal 277 (2010) 488–500 ª 2009 The Authors Journal compilation ª 2009 FEBS
to the mitochondria and that PHB overexpression
decreases ROS accumulation in intestinal epithelial
cells and protects these cells from oxidant-induced
depletion of glutathione.
It has been reported that PHB plays a chaperone
role in the stabilization of newly synthesized subunits
of mitochondrial respiratory enzymes [44]. PHB is
essential for normal mitochondrial development and
its deficiency in yeasts and Caenorhabditis elegans is
associated with deficient mitochondrial function [44]
and a reduced life span [45,46]. Our findings in b-cells,
which are in agreement with findings in yeasts, C. ele-
gans, and granulosa and intestinal cells, are in contra-
diction with recent observations in other cell types.
Vessal et al. [29] reported that PHB, when added to
fibroblasts or adipocytes, is a potent inhibitor of mito-
chondrial function. Furthermore, they reported that
PHB inhibits the mitochondrial enzyme pyruvate car-
boxylase, thereby depleting oxaloacetate and inhibiting
anaplerosis and, consequently, oxidative phosphoryla-
tion. As a consequence, mitochondrial glucose and
fatty acid oxidation was inhibited [29]. Through this
mechanism, PHB would be expected to have deleteri-
ous effects on glucose-induced insulin secretion from
pancreatic b-cells, which is dependent on glucose oxi-
dation and mitochondrial ATP biosynthesis [47].
Taken together, these observations suggest cell type
differences in PHB action that need to be confirmed in
further studies.
The present study did not address the mechanism
whereby PHB is excluded from the nucleus or internal-
ized. Rastogi et al. [48] recently reported that PHB
contains a leucine-rich nuclear export signal that facili-
tates its cytoplasmic translocation. PHB internalization
has not been previously reported and its mechanisms
are still unknown, but could involve a lipid raft or
caveolin-dependent process, as PHB is present on the
cell membrane in lipid rafts [17,49]; in some cells, PHB
is abundant in the caveolin-1-rich fractions [50]. Cave-
olins and lipid rafts are involved in the internalization
of various molecules [51,52]. Vessal et al. [29] identified
EH domain 2 as a binding partner for PHB, and both
EH domain 2 and PHB have been identified in lipid
droplets released from 3T3L1 cells [16]. EH domain
G1 G2 G2E G2P G2EP
PHB
Histone H1
PHB
Actin
G1 G2 G2E G2P G2EP
PHB (arbitrary units)
0
0.2
0.4
0.6
0.8
1.0
1.2
1.4
1.6
G1 G2 G2E G2P G2EP
P < 0.05
His-PHB
PHB
Actin
G1 G2 G2E G2P G2EP His -PHB
30 kDa
0
0.2
0.4
0.6
0.8
1.0
1.2
1.4
G1 G2 G2E G2P G2EP
P = 0.06
P < 0.05
Arbitrary units
Heat shock protein 60
PHB
G1 G2 G2E G2P G2EP
0
0.2
0.4
0.6
0.8
1.0
1.2
1.4
1.6
G1 G2 G2E G2P G2EP
P < 0.05
P < 0.01
Fold over G2
AD
E
F
G
B
C
Fig. 5. Effect of ethanol and exogenous PHB on PHB expression and localization of endogenous PHB in RINm5F cells. RINm5F cells were
incubated for 24 h as described in Fig. 2. Cell extracts were immunoblotted with anti-PHB. (A) A representative western blot of recombinant
human PHB run in parallel with cell extracts. The 30 kDa endogenous PHB band is seen below the His-tagged recombinant PHB (exogenous
PHB). (B) Endogenous PHB protein (30 kDa) expressed as the mean ± SEM arbitrary units relative to actin (n = 3 experiments). (C) PHB
mRNA expressed as the mean ± SEM fold of G2 (n = 3 experiments). (D) A representative western blot of PHB in the nuclear fraction with
histone H1 as the nuclear marker (n = 3 experiments). (E) A representative western blot of PHB in the cytoplasmic fraction (n = 3 experi-
ments). (F) Endogenous PHB protein in the mitochondrial fraction, expressed as the mean ± SEM arbitrary units relative to the mitochondrial
marker heat shock protein 60 (n = 3 experiments). (G) A representative western blot of endogenous PHB protein in the mitochondrial
fraction.
J. H. Lee et al. Effects of prohibitin in b-cells
FEBS Journal 277 (2010) 488–500 ª 2009 The Authors Journal compilation ª 2009 FEBS 493
proteins have been shown to be involved in endocyto-
sis and vesicle recycling [53].
In summary, we found that PHB is expressed in
pancreatic b-cells and increases with oxidative stress
induced by ethanol exposure, possibly to protect
b-cells against oxidative and proapoptotic effects of
this drug. If PHB protects against oxidative stress
induced by other b-cell toxins, it could be a target for
diabetes prevention or treatment.
Materials and methods
Materials
His-tagged recombinant human PHB was purchased from
AmProx American Proteomics (Carlsbad, CA, USA). For
overexpression of PHB, pCMV6 XL5 vector containing the
human PHB gene was obtained from Origene Technologies
(Rockville, MD, USA). The following antibodies or
reagents were obtained from Santa Cruz Biotechnology
(Santa Cruz, CA, USA): a rabbit polyclonal anti-PHB
serum (sc-28259), His-probe antibody (sc-10806), anti-his-
tone H1 serum (sc-803), heat shock protein 60 antibody
(sc-13966), anti-rabbit-FITC (sc-2012), mouse PHB siRNA
(sc-37630), control siRNA-A (sc-37007), siRNA transfec-
tion reagent (sc-29528), siRNA transfection medium
(sc-36868) and horseradish peroxidase-conjugated second-
ary antibody (sc-2004). Anti-UCP2 serum (ucp21-s) was
obtained from Alpha Diagnostic International (San Anto-
nio, TX, USA). Anti-cleaved caspase-3 serum (# 9661) and
anti-caspase-3 serum (# 9665) were obtained from Cell Sig-
naling Technology (Danvers, MA, USA). RINm5F rat ins-
ulinoma cells (ATCC # CRL-11605) and RPMI 1640
medium (ATCC # 30-2001) were purchased from the Amer-
ican Type Culture Collection (Manassas, VA, USA).
INS-1E cells were provided by M. Wheeler (University of
Toronto) with permission from C. Wollheim (University of
Geneva). Fetal bovine serum, trypsin ⁄ EDTA, penicillin,
streptomycin and the Vybrant apoptosis assay kit
(#V13242) were obtained from Invitrogen (Burlington, Can-
ada). Electrophoresis and electroblotting materials were
obtained from Bio-Rad (Hercules, CA, USA). The
enhanced chemiluminescence kit was obtained from Amer-
sham Biosciences (Piscataway, NJ, USA). Protease inhibitor
cocktail tablets were purchased from Roche Diagnostics
(Penzberg, Germany). Microplates and cell culture flasks
were obtained from Corning Incorporated (Corning, NY,
USA). The mitochondrial dye Mitofluor
TM
Red 589
(M22424), anti-His-FITC (C6826), Hoechst 33342 (H3570)
and 5-(and-6)-chloromethyl-2¢,7¢-dichlorodihydrofluorescein
A
B
C
D
G2 G2E G2P G2EPG1
Fig. 6. Cellular distribution of endogenous
PHB in RINm5F cells. RINm5F cells were
incubated for 24 h as described in Fig. 2
and then processed for immunocytochemis-
try as described in the Materials and
methods (n = 3 experiments). (A) Hoechst
33342 (nuclei) staining; (B) Mitofluor Red
589 (mitochondria) staining;
(C) anti-PHB ⁄ anti-rabbit-FITC staining;
(D) merge. Arrows indicate staining of PHB.
Effects of prohibitin in b-cells J. H. Lee et al.
494 FEBS Journal 277 (2010) 488–500 ª 2009 The Authors Journal compilation ª 2009 FEBS
diacetate (CM-H
2
DCFDA; P ⁄ N46-0309) were obtained
from Molecular Probes (Burlington, Canada). Ethanol was
obtained from the Pharmaceutical Services of the Health
Sciences Centre (Winnipeg, Canada). Anti-actin serum
(A5441), MTT, ATP bioluminescent assay kit (FL-AA) and
all other chemicals were purchased from Sigma-Aldrich
(Mississauga, Canada). For real-time PCR, Optical 96-well
reaction plates (4306737), Power SYBR green PCR master
mix (4367659) and Optical adhesive film (4311971) were
purchased from Applied Biosystems (Foster City, CA,
USA).
Cell culture and treatment
INS-1E and RINm5F cells were grown in RPMI 1640 med-
ium containing 10% fetal bovine serum, 1% penicillin and
streptomycin at 5% CO
2
and 37 °C. For INS-1E cells, the
medium also contained 50 lm 2-mercaptoethanol. Briefly,
cells were cultured for 1–2 days until 70% confluence. The
cells were subsequently incubated for 24 h with or without
ethanol or recombinant human PHB (10 nm). This PHB con-
centration was chosen as it corresponds to the half-maximal
concentration shown to inhibit insulin-stimulated glucose
oxidation and pyruvate carboxylase in adipocytes [29]. The
ethanol dosage was determined using a dose–response curve
in RINm5F [26] and INS-1E cells (see Results).
PHB siRNA transfection
To transfect with siRNA, INS-1E and RINm5F cells were
cultured in antibiotic-free RPMI 1640 medium for 24 h.
The transfection was performed at 70% of cell conflu-
ency to increase the transfection efficiency. The transfection
was completed by incubating the cells for 7 h in siRNA
transfection medium supplied by the manufacturer without
serum and antibiotics. According to the manufacturer, the
PHB siRNA is a pool of three target-specific 19–25 nucleo-
tide siRNAs with the following sequences:
360 CAGCTTCCTCGTATCTACATTCAAGAGATG
TAGATACGAGGAAGCTGTTTTT;
1179
CCATTCTGCCGTATATTGATTCAAGAGA
TCAATATACGGCAGAATGGTTTTT;
1624
CTCAGAGATTGCCCTTTCTTTCAAGAGA
AGAAAGGGCAATCTCTGAGTTTTT.
The cells were then washed and replaced in fresh normal
growth medium. After 24 h, the cells were incubated in the
medium with or without ethanol for 24 h. Floating (apopto-
tic) cells were resuspended by gently swirling the culture
medium and harvested by mild centrifugation; attached cells
were collected after mild trypsinization [54,55]. Cell count-
ing was performed using a Beckman Coulter Z2 particule
count and size analyzer. The ratio of floating to attached
cells was used as an index of apoptosis.
PHB overexpression
INS-1E cells were cultured for 24 h before transfection with
a pCMV6-XL5 vector containing a human PHB clone. The
transfection was performed at 70% of cell confluency
using a FuGENE HD transfection reagent (Roche Applied
Science, Laval, Canada) according to the protocol supplied
with the manufacturer’s instructions. The cells were then
washed at 24 h and replaced in fresh normal growth med-
ium with or without ethanol or 10 lm H
2
O
2
for 24 h.
MTT assay
For the MTT assay, culture media were replaced by phos-
phate-buffered saline (NaCl ⁄ P
i
) containing 0.5 mgÆmL
)1
MTT and the incubation continued for 3 h. The MTT-
PHB
Vector PHB
Actin
Vector
Vector_ETOH
PHB
PHB_ETOH
Caspase 3
Actin
Cleaved caspase 3
*
*
MTT (% of control)
0
Vector
Vector_ETOH
Vector_H
2
O
2
PHB
PHB_ETOH
PHB_H
2
O
2
20
40
60
80
100
120
A
B
C
Fig. 7. Effect of overexpression of PHB on ethanol-induced apopto-
sis in INS-1E cells. INS-1E cells were transfected with pCMV6-XL5
vector containing the human PHB clone and subsequently incu-
bated with 80 m
M ethanol for 24 h. (A) A representative western
blot of three experiments showing the PHB protein expression
level after transfection. (B) A representative western blot of cas-
pase-3 and cleaved caspase-3 in cell extracts (n = 3 experiments).
(C) MTT reduction after incubation with 80 m
M ethanol (ETOH) or
10 l
M H
2
O
2
, expressed as the mean ± SEM percentage of vector.
*P < 0.05 versus siRNA control.
J. H. Lee et al. Effects of prohibitin in b-cells
FEBS Journal 277 (2010) 488–500 ª 2009 The Authors Journal compilation ª 2009 FEBS 495
containing medium was removed after 3 h and replaced
with 200 lL dimethyl sulfoxide to dissolve the formazan.
The cells were left for 30 min at room temperature. The
reduction of MTT to formazan was quantified by measur-
ing the absorbance at 540 and 630 nm using a Spectra Max
340 plate reader (Molecular Devices, Sunnyvale, CA,
USA). Each experiment was conducted at least three times,
as shown in the Results, and each treatment was conducted
in triplicate.
ROS assay
The production of ROS was determined using the fluores-
cent probe CM-H
2
DCFDA. This probe passes freely
through the cell membrane and is cleaved by intracellular
esterase into its nonfluorescent form 5-(and-6)-chloro-
methyl-2¢,7¢-dichlorodihydrofluorescein (CM-H
2
DCF). CM-
H
2
DCF is oxidized into the highly fluorescent compound
CM-DCF [5-(and-6)-chloromethyl-2¢,7¢-dichlorofluorescein]
in the presence of ROS [56]. Briefly, after cell culture and
treatment, the media were replaced by RPMI 1640 contain-
ing 5 lm CM-H
2
DCFDA and the plates were incubated at
37 °C for 2 h. The medium containing CM-H
2
DCFDA was
removed and replaced with 100 lL NaCl ⁄ P
i
. The oxidized
fluorescent compound was measured at the excitation length
488 nm and emission length 505 nm using the SpectraMax
Gemini XS fluorescence microplate reader with the softmax
pro software (Molecular Devices).
Flow cytometry
Cells were washed with cold NaCl ⁄ P
i
, resuspended in
100 lL annexin-binding buffer and serially stained with
5 lL FITC–annexin V and 1 lL propidium iodide for
15 min at room temperature according to the manufac-
turer’s instructions. After 15 min, the reaction was stopped
by adding 400 lL annexin-binding buffer. The stained cells
were immediately analyzed by flow cytometry using a high-
speed Beckman Coulter EPICS ALTRA flow cytometer
(Beckman Coulter Canada Inc., Mississauga, Canada) ran-
domly analyzing up to 2 · 10
4
cells. Histograms were
acquired and analyzed using the expo 32 multi comp mfa
software, version 1.2B, supplied with the instrument.
ATP measurement
The cellular ATP concentration was measured using an
ATP bioluminescent assay kit according to the manufac-
turer’s instructions. The calibration curve was generated
using serial dilutions of an ATP standard from 2 · 10
)7
to
2 · 10
)3
m. The same amount of cell extract was mixed with
100 lL luciferase assay reagent in disposable polystyrene
siRNA
control
siRNA
control_ETOH
siRNA
PHB
siRNA
PHB_ETOH
Caspase 3
Actin
Cleaved caspase 3
siRNA control
siRNA control_ETOH
siRNA PHB
siRNA PHB_ETOH
Caspase 3
Actin
Cleaved caspase 3
PHB
Actin
siRNA Control
siRNA PHB
Floating/attached cells
Ratio (% of siRNA control)
0
50
100
150
200
250
300
**
#$
*
*
siRNA Control siRNA PHB siRNA PHB_ETOH siRNA Control_ETOH
PHB
Actin
siRNA Control
siRNA PHB
AB
C
E
D
Fig. 8. Effect of PHB siRNA on ethanol-
induced apoptosis in RINm5F and INS-1E
cells. RINm5F (A,C,E) and INS-1E (B,D) cells
were transfected with PHB gene siRNA or
control siRNA and subsequently incubated
with 80 m
M ethanol for 24 h. Representa-
tive western blot of PHB protein expression
(A,B) and caspase-3 (C,D) after siRNA trans-
fection in RINm5F (A,C) and INS-1E (B,D)
cells. (E) Percentage ratio of float-
ing ⁄ attached cells expressed as the
mean ± SEM. *P < 0.05 versus siRNA
control, **P < 0.01 versus siRNA control,
#P < 0.05 versus siRNA control_EtOH,
$P = 0.056 versus PHB siRNA. For each
condition, n = 3 experiments.
Effects of prohibitin in b-cells J. H. Lee et al.
496 FEBS Journal 277 (2010) 488–500 ª 2009 The Authors Journal compilation ª 2009 FEBS
tubes, and incubated at room temperature for 3 min. The
light produced was immediately measured for 30 s with an
LB 9507 Lumat luminometer (Berthold, Bad Wildbad,
Germany).
Protein extraction
To prepare the total protein fraction, culture media were
removed and the cells were incubated with 0.05% tryp-
sin ⁄ 0.02% EDTA. After washing, the cells were resuspended
in 30 lL lysis buffer (1% Igepal, 0.1% SDS, 0.5% deoxy-
cholic acid, 1 mm phenylmethanesulfonyl fluoride in
NaCl ⁄ P
i
, pH 7.2 and protease inhibitors). After vigorous
vortexing, the cells were placed on ice for 30 min, and then
the homogenates were centrifuged at 16 000 g,4°C, for
20 min. The supernatants were collected and stored at –
25 °C until use. The nuclear fraction was prepared as
described previously [57]. After incubation with 0.05% tryp-
sin ⁄ 0.02% EDTA, the cells were resuspended in 400 lL cold
buffer A (10 mm KCl, 0.1 mm EGTA, 0.1 mm EDTA, 1 mm
dithiothreitol, 10 mm Hepes, pH 7.9 and protease inhibitors)
by gently mixing. The cells were placed to swell on ice for
15 min, and then 10 lL 1% Igepal was added. After vigor-
ous vortexing for 10 s, the homogenates were centrifuged at
16 000 g,4°C, for 30 s. The supernatants (cytoplasm frac-
tions) were stored at )25 °C until use. The pellets were resus-
pended in 50 lL ice-cold buffer B (0.4 m NaCl, 1 mm
EGTA, 1 mm EDTA, 1 mm dithiothreitol, 20 mm Hepes,
pH 7.9 and protease inhibitors) by gently mixing. The
nuclear homogenates were centrifuged at 16 000 g,4°C, for
5 min. The supernatants (nuclear fractions) were stored as
above.
The mitochondria fraction was prepared as described
previously [58]. Briefly, cells were collected with 0.05%
trypsin ⁄ 0.02% EDTA. After washing, the cells were
homogenized in 100 lL isotonic buffer (25 mm mannitol,
70 mm sucrose, 1 mm dithiothreitol, 1 mm EGTA, 5 mm
Hepes, pH 7.4 and protease inhibitors). The homogenates
were centrifuged at 600 g,4°C, for 5 min to remove
nuclear and cell debris. The resulting supernatant was sub-
sequently centrifuged at 5500 g,4°C, for 10 min to yield
the mitochondrial fraction. The mitochondrial fraction was
stored at –25 °C until use. The protein concentration in
each fraction was determined by using the Bio-Rad assay
with BSA as the standard.
Western blot analysis
Equal amounts of protein were subjected to SDS ⁄ PAGE
after boiling at 95 °C for 5 min and then transferred to a
nitrocellulose membrane using a semidry blot apparatus
(Trans-Blot SD Cell, Bio-Rad). After transfer, the membrane
was blocked for 1 h at room temperature with 5% nonfat
dry milk in Tris-buffered saline ⁄ 0.1% Tween 20. The mem-
brane was then rinsed twice with Tris-buffered saline ⁄ 0.1%
Tween 20 and incubated with a primary antibody at room
temperature for 1 h. After further washing, the membrane
was incubated with horseradish peroxidase-conjugated sec-
ondary antibody for 1 h and washed twice for 7 min with
Tris-buffered saline ⁄ 0.1% Tween 20. Immune complexes
were detected using the enhanced chemiluminescence detec-
tion kit. The same membrane was subsequently stripped with
15 mL strip buffer (100 mm 2-mercaptoethanol, 2% SDS,
62.5 mm Tris ⁄ HCl, pH 6.7) at 50 °C for 30 min and rep-
robed with anti-actin, anti-heat shock protein 60 or anti-his-
tone H1 serum as appropriate. Quantitative image analysis
was performed using NIH image j software to determine the
intensity of the individual proteins.
Determination of mRNA expression
PHB and actin gene expression was also determined by
real-time PCR, using as primers: PHB: 5¢-GATTTACAG
ACAGTGGTGCACACA-3¢ (forward), 5¢-GGGTTCGTAT
GGCTGGAAAA-3¢ (reverse); actin: 5¢-AGGGAAATCG
TGCGTGACAT-3¢ (forward), 5¢-GAACCGCTCATTGCC
GATAG -3¢ (reverse). The cDNA was synthesized with
1 lg total RNA using SuperScriptII RNaseH reverse trans-
criptase and random primer (Invitrogen). The primers used
in real-time PCR were designed using primer express soft-
ware (version 3.0, Applied Biosystems). The reactions were
performed in triplicate under the following conditions:
5 min at 94 °C, 15 s at 94 °C, 20 s at 60 °C, 40 s at 72 °C
for 40 cycles. Data were analyzed by the DDCt method
using abi 7500 system software, and mRNA levels were
normalized to actin mRNA.
Immunocytochemistry
For immunostaining, RINm5F cells were cultured on
chamber slides (Nalge Nunc International, Tokyo, Japan)
in RPMI 1640 medium supplemented with 10% fetal
bovine serum, 1% penicillin and streptomycin until 70–
80% confluence. After rinsing with NaCl ⁄ P
i
, the cells were
incubated for 24 h with or without ethanol (80 mm) in the
presence of glucose (5.5 or 25 mm) with or without PHB
(10 nm). To detect exogenous His-tagged PHB, the cells
were fixed with 4% paraformaldehyde for 30 min and incu-
bated with NaCl ⁄ P
i
⁄ 1% BSA ⁄ 0.1% Tween 20 for 1 h. The
cells were then serially incubated with the mitochondrial
dye Mitofluor
TM
Red 589 (final concentration 5 lgÆmL
)1
)
for 20 min, anti-His-FITC (1 : 650) for 1 h and Hoechst
33342 (final concentration 2.5 lgÆmL
)1
) for 5 min. To
detect the distribution of endogenous PHB, the cells were
fixed and then incubated with NaCl ⁄ P
i
⁄ 1% BSA ⁄ 0.1%
Tween 20 for 1 h. They were then serially incubated with
rabbit anti-PHB serum (1 : 650) for 1 h, Mitofluor
TM
Red
589 for 20 min, anti-rabbit FITC (1 : 650) for 1 h and
Hoechst 33342 for 5 min. The cells were then examined
under a Nikon Eclipse TE2000-E fluorescence microscope.
J. H. Lee et al. Effects of prohibitin in b-cells
FEBS Journal 277 (2010) 488–500 ª 2009 The Authors Journal compilation ª 2009 FEBS 497
Statistical analysis
The data were analyzed by one-way ANOVA with Tukey
multiple comparisons or Student’s t-test and are presented
as the mean ± standard error of the mean (SEM).
P < 0.05 was considered significant.
Acknowledgement
This study was supported by a grant from the Cana-
dian Institutes of Health Research (MOP60632).
References
1 Goldberg IJ (2003) To drink or not to drink? N Engl J
Med 348, 163–164.
2 Kao WH, Puddey IB, Boland LL, Watson RL &
Brancati FL (2001) Alcohol consumption and the
risk of type 2 diabetes mellitus: atherosclerosis
risk in communities study. Am J Epidemiol 154,
748–757.
3 Onishi Y, Honda M, Ogihara T, Sakoda H, Anai M,
Fujishiro M, Ono H, Shojima N, Fukushima Y, Inukai
K et al. (2003) Ethanol feeding induces insulin resis-
tance with enhanced PI 3-kinase activation. Biochem
Biophys Res Commun 303, 788–794.
4 Sasaki Y & Wands JR (1994) Ethanol impairs insulin
receptor substrate-1 mediated signal transduction during
rat liver regeneration. Biochem Biophys Res Commun
199, 403–409.
5 Wan Q, Liu Y, Guan Q, Gao L, Lee KO & Zhao J
(2005) Ethanol feeding impairs insulin-stimulated
glucose uptake in isolated rat skeletal muscle: role of
Gs alpha and cAMP. Alcohol Clin Exp Res 29 , 1450–
1456.
6 Patel DG & Singh SP (1979) Effect of ethanol and its
metabolites on glucose mediated insulin release from
isolated islets of rats. Metabolism 28, 85–89.
7 Singh SP, Patel DG & Snyder AK (1980) Ethanol inhi-
bition of insulin secretion by perifused rat islets. Acta
Endocrinol (Copenh) 93, 61–66.
8 Singh SP, Patel DG, Snyder AK & Pullen GL (1986)
Ethanol influence on insulin secretion from isolated rat
islets. Experientia 42, 58–60.
9 de la Monte SM, Neely TR, Cannon J & Wands JR
(2001) Ethanol impairs insulin-stimulated mitochondrial
function in cerebellar granule neurons. Cell Mol Life
Sci 58, 1950–1960.
10 Suh SK, Hood BL, Kim BJ, Conrads TP, Veenstra TD
& Song BJ (2004) Identification of oxidized mitochon-
drial proteins in alcohol-exposed human hepatoma cells
and mouse liver. Proteomics 4, 3401–3412.
11 Mishra S, Murphy LC, Nyomba BL & Murphy LJ
(2005) Prohibitin: a potential target for new therapeu-
tics. Trends Mol Med 11, 192–197.
12 Fusaro G, Dasgupta P, Rastogi S, Joshi B &
Chellappan S (2003) Prohibitin induces the transcrip-
tional activity of p53 and is exported from the
nucleus upon apoptotic signaling. J Biol Chem 278,
47853–47861.
13 Wang S, Nath N, Adlam M & Chellappan S (1999)
Prohibitin, a potential tumor suppressor, interacts with
RB and regulates E2F function. Oncogene 18, 3501–
3510.
14 Kolonin MG, Saha PK, Chan L, Pasqualini R & Arap
W (2004) Reversal of obesity by targeted ablation of
adipose tissue. Nat Med 10, 625–632.
15 Terashima M, Kim KM, Adachi T, Nielsen PJ, Reth
M, Kohler G & Lamers MC (1994) The IgM antigen
receptor of B lymphocytes is associated with prohibitin
and a prohibitin-related protein. EMBO J 13, 3782–
3792.
16 Brasaemle DL, Dolios G, Shapiro L & Wang R (2004)
Proteomic analysis of proteins associated with lipid
droplets of basal and lipolytically stimulated 3T3-L1
adipocytes. J Biol Chem 279, 46835–46842.
17 Staubach S, Razawi H & Hanisch FG (2009) Proteo-
mics of MUC1-containing lipid rafts from plasma mem-
branes and exosomes of human breast carcinoma cells
MCF-7. Proteomics 9, 2820–2835.
18 Sharma A & Qadri A (2004) Vi polysaccharide of Salmo-
nella typhi targets the prohibitin family of molecules in
intestinal epithelial cells and suppresses early inflamma-
tory responses. Proc Natl Acad Sci USA 101, 17492–17497.
19 Sato T, Sakamoto T, Takita K, Saito H, Okui K &
Nakamura Y (1993) The human prohibitin (PHB) gene
family and its somatic mutations in human tumors.
Genomics 17, 762–764.
20 Nijtmans LG, Artal SM, Grivell LA & Coates PJ
(2002) The mitochondrial PHB complex: roles in mito-
chondrial respiratory complex assembly, ageing and
degenerative disease. Cell Mol Life Sci 59, 143–155.
21 Nijtmans LG, de Jong L, rtal Sanz M, Coates PJ,
Berden JA, Back JW, Muijsers AO, van der Spek H &
Grivell LA (2000) Prohibitins act as a membrane-bound
chaperone for the stabilization of mitochondrial pro-
teins. EMBO J 19, 2444–2451.
22 Wang P, Mariman E, Keijer J, Bouwman F, Noben JP,
Robben J & Renes J (2004) Profiling of the secreted
proteins during 3T3-L1 adipocyte differentiation leads
to the identification of novel adipokines. Cell Mol Life
Sci 61, 2405–2417.
23 Mengwasser J, Piau A, Schlag P & Sleeman JP (2004)
Differential immunization identifies PHB1 ⁄ PHB2 as
blood-borne tumor antigens. Oncogene 23, 7430–7435.
24 Theiss AL, Idell RD, Srinivasan S, Klapproth JM,
Jones DP, Merlin D & Sitaraman SV (2007) Prohibitin
protects against oxidative stress in intestinal epithelial
cells. FASEB J 21, 197–206.
Effects of prohibitin in b-cells J. H. Lee et al.
498 FEBS Journal 277 (2010) 488–500 ª 2009 The Authors Journal compilation ª 2009 FEBS
25 Liu X, Ren Z, Zhan R, Wang X, Wang X, Zhang Z,
Leng X, Yang Z & Qian L (2009) Prohibitin protects
against oxidative stress-induced cell injury in cultured
neonatal cardiomyocyte. Cell Stress Chaperones 14,
311–319.
26 Dembele K, Nguyen KH, Hernandez TA & Nyomba
BL (2009) Effects of ethanol on pancreatic beta-cell
death: interaction with glucose and fatty acids. Cell Biol
Toxicol 25, 141–152.
27 Hoorens A, Van de Casteele M, Kloppel G & Pipeleers
D (1996) Glucose promotes survival of rat pancreatic
beta cells by activating synthesis of proteins which
suppress a constitutive apoptotic program. J Clin Invest
98, 1568–1574.
28 Chan CB & Kashemsant N (2006) Regulation of insulin
secretion by uncoupling protein. Biochem Soc Trans 34,
802–805.
29 Vessal M, Mishra S, Moulik S & Murphy LJ (2006)
Prohibitin attenuates insulin-stimulated glucose and
fatty acid oxidation in adipose tissue by inhibition of
pyruvate carboxylase. FEBS J 273, 568–576.
30 Zhu B, Zhai J, Zhu H & Kyprianou N (2010) Prohib-
itin regulates TGF-beta induced apoptosis as a down-
stream effector of smad-dependent and -independent
signaling. Prostate 70, 17–26.
31 McDonough KH (2003) Antioxidant nutrients and alco-
hol. Toxicology 189, 89–97.
32 Wu D & Cederbaum AI (2005) Oxidative stress medi-
ated toxicity exerted by ethanol-inducible CYP2E1.
Toxicol Appl Pharmacol 207, 70–76.
33 Koko V, Todorovic V, Nikolic JA, Glisic R, Cakic M,
Lackovic V, Petronijevic L, Stojkovic M, Varagic J &
Janic B (1995) Rat pancreatic B-cells after chronic alco-
hol feeding. A morphometric and fine structural study.
Histol Histopathol 10, 325–337.
34 Shin JS, Lee JJ, Yang JW & Kim CW (2002) Ethanol
decreases basal insulin secretion from HIT-T15 cells.
Life Sci 70, 1989–1997.
35 Tiengo A, Valerio A, Molinari M, Meneghel A &
Lapolla A (1981) Effect of ethanol, acetaldehyde, and
acetate on insulin and glucagon secretion in the
perfused rat pancreas. Diabetes 30, 705–709.
36 Urso T, Gavaler JS & Van Thiel DH (1981) Blood eth-
anol levels in sober alcohol users seen in an emergency
room. Life Sci 28, 1053–1056.
37 Ihara Y, Toyokuni S, Uchida K, Odaka H, Tanaka T,
Ikeda H, Hiai H, Seino Y & Yamada Y (1999) Hyper-
glycemia causes oxidative stress in pancreatic beta-cells
of GK rats, a model of type 2 diabetes. Diabetes 48,
927–932.
38 Kaneto H, Kajimoto Y, Fujitani Y, Matsuoka T,
Sakamoto K, Matsuhisa M, Yamasaki Y & Hori M
(1999) Oxidative stress induces p21 expression in pan-
creatic islet cells: possible implication in beta-cell dys-
function. Diabetologia 42, 1093–1097.
39 Matsuoka T, Kajimoto Y, Watada H, Kaneto H,
Kishimoto M, Umayahara Y, Fujitani Y, Kamada T,
Kawamori R & Yamasaki Y (1997) Glycation-depen-
dent, reactive oxygen species-mediated suppression of
the insulin gene promoter activity in HIT cells. J Clin
Invest 99, 144–150.
40 Tanaka Y, Gleason CE, Tran PO, Harmon JS & Rob-
ertson RP (1999) Prevention of glucose toxicity in HIT-
T15 cells and Zucker diabetic fatty rats by antioxidants.
Proc Natl Acad Sci USA 96, 10857–10862.
41 Anello M, Lupi R, Spampinato D, Piro S, Masini M,
Boggi U, Del PS, Rabuazzo AM, Purrello F & March-
etti P (2005) Functional and morphological alterations
of mitochondria in pancreatic beta cells from type 2
diabetic patients. Diabetologia 48, 282–289.
42 Lortz S, Tiedge M, Nachtwey T, Karlsen AE, Nerup J
& Lenzen S (2000) Protection of insulin-producing
RINm5F cells against cytokine-mediated toxicity
through overexpression of antioxidant enzymes.
Diabetes 49, 1123–1130.
43 Chowdhury I, Xu W, Stiles JK, Zeleznik A, Yao X,
Matthews R, Thomas K & Thompson WE (2007)
Apoptosis of rat granulosa cells after staurosporine and
serum withdrawal is suppressed by adenovirus-directed
overexpression of prohibitin. Endocrinology 148, 206–
217.
44 Artal-Sanz M, Tsang WY, Willems EM, Grivell LA,
Lemire BD, van der SH & Nijtmans LG (2003) The
mitochondrial prohibitin complex is essential for embry-
onic viability and germline function in Caenorhabditis
elegans. J Biol Chem 278, 32091–32099.
45 Coates PJ, Jamieson DJ, Smart K, Prescott AR & Hall
PA (1997) The prohibitin family of mitochondrial pro-
teins regulate replicative lifespan. Curr Biol 7, 607–610.
46 Piper PW, Jones GW, Bringloe D, Harris N, MacLean
M & Mollapour M (2002) The shortened replicative life
span of prohibitin mutants of yeast appears to be due
to defective mitochondrial segregation in old mother
cells. Aging Cell 1, 149–157.
47 MacDonald MJ, Fahien LA, Brown LJ, Hasan NM,
Buss JD & Kendrick MA (2005) Perspective: emerging
evidence for signaling roles of mitochondrial anaplerotic
products in insulin secretion. Am J Physiol Endocrinol
Metab 288, E1–15.
48 Rastogi S, Joshi B, Fusaro G & Chellappan S (2006)
Camptothecin induces nuclear export of prohibitin pref-
erentially in transformed cells through a CRM-1-depen-
dent mechanism. J Biol Chem 281, 2951–2959.
49 Mielenz D, Vettermann C, Hampel M, Lang C, Avram-
idou A, Karas M & Jack HM (2005) Lipid rafts associ-
ate with intracellular B cell receptors and exhibit a B
cell stage-specific protein composition. J Immunol 174,
3508–3517.
50 Rajalingam K, Wunder C, Brinkmann V, Churin Y,
Hekman M, Sievers C, Rapp UR & Rudel T (2005)
J. H. Lee et al. Effects of prohibitin in b-cells
FEBS Journal 277 (2010) 488–500 ª 2009 The Authors Journal compilation ª 2009 FEBS 499
Prohibitin is required for Ras-induced Raf-MEK-ERK
activation and epithelial cell migration. Nat Cell Biol 7,
837–843.
51 Choi KS, Aizaki H & Lai MM (2005) Murine corona-
virus requires lipid rafts for virus entry and cell-cell
fusion but not for virus release. J Virol 79, 9862–9871.
52 Hansen GH, Dalskov SM, Rasmussen CR, Immerdal
L, Niels-Christiansen LL & Danielsen EM (2005)
Cholera toxin entry into pig enterocytes occurs via a
lipid raft- and clathrin-dependent mechanism.
Biochemistry 44, 873–882.
53 George M, Ying G, Rainey MA, Solomon A, Parikh
PT, Gao Q, Band V & Band H (2007) Shared as well as
distinct roles of EHD proteins revealed by biochemical
and functional comparisons in mammalian cells and C.
elegans. BMC Cell Biol 8,3.
54 McGuire TF, Trump DL & Johnson CS (2001) Vitamin
D(3)-induced apoptosis of murine squamous cell carci-
noma cells. Selective induction of caspase-dependent
MEK cleavage and up-regulation of MEKK-1. J Biol
Chem 276, 26365–26373.
55 Zamora M, Merono C, Vinas O & Mampel T (2004)
Recruitment of NF-kappaB into mitochondria is
involved in adenine nucleotide translocase 1
(ANT1)-induced apoptosis. J Biol Chem 279,
38415–38423.
56 Kasono K, Yasu T, Kakehashi A, Kinoshita N,
Tamemoto H, Namai K, Ohno R, Ueba H, Kuroki M,
Ishikawa S et al. (2004) Nicorandil improves diabetes
and rat islet beta-cell damage induced by streptozotocin
in vivo and in vitro. Eur J Endocrinol 151, 277–285.
57 Ma Z, Zhang S, Turk J & Ramanadham S (2002)
Stimulation of insulin secretion and associated
nuclear accumulation of iPLA(2)beta in INS-1 insulino-
ma cells. Am J Physiol Endocrinol Metab 282, E820–
E833.
58 Veluthakal R, Palanivel R, Zhao Y, McDonald P,
Gruber S & Kowluru A (2005) Ceramide induces mito-
chondrial abnormalities in insulin-secreting INS-1 cells:
potential mechanisms underlying ceramide-mediated
metabolic dysfunction of the beta cell. Apoptosis 10,
841–850.
Effects of prohibitin in b-cells J. H. Lee et al.
500 FEBS Journal 277 (2010) 488–500 ª 2009 The Authors Journal compilation ª 2009 FEBS