Báo cáo khoa học: Role of the plasma membrane leaflets in drug uptake and multidrug resistance ppt
Bạn đang xem bản rút gọn của tài liệu. Xem và tải ngay bản đầy đủ của tài liệu tại đây (866.21 KB, 11 trang )
Role of the plasma membrane leaflets in drug uptake and
multidrug resistance
Hagar Katzir*, Daniella Yeheskely-Hayon*, Ronit Regev and Gera D. Eytan
Department of Biology, The Technion – Israel Institute of Technology, Haifa, Israel
Introduction
P-glycoprotein [Pgp; multidrug resistance protein
(MDR) 1] (ABCB1) [1] and the multidrug resistance-
associated protein (MRP) 1 (ABCC1) [2] were recog-
nized as serious impediments to cancer chemotherapy
through their ability to eliminate drugs from cells.
Both proteins are members of the ABC transporters
superfamily [3]. Pgp efficiently exports amphipathic
somewhat basic drugs, such as paclitaxel (taxol), anth-
racyclines and Vinca alkaloids. The hydrophobic parts
of these drugs allow their rapid insertion in the mem-
brane. The hydrophilic residues prevent rapid flipping
of the drug from the extracellular leaflet to the cyto-
plasmic leaflet of the membrane, slowing down entry
into the cell; indeed, for an anthracycline such as
doxorubicin, this takes approximately 1 min, giving
the Pgp pump ample opportunity to deal with the
influx [4–6]. This rate of spontaneous flip-flop is rele-
vant because estimates of the turnover number of Pgp
Keywords
MDR1; MRP1; multidrug resistance;
P-glycoprotein; plasma membrane
Correspondence
G. D. Eytan, Department of Biology,
The Technion – Israel Institute of
Technology, Haifa, Israel
Fax: +972 4 822 5153
Tel: +972 4 829 3406
E-mail:
Website:
*These authors contributed equally to this
work
(Received 5 November 2009, revised 13
December 2009, accepted 18 December
2009)
doi:10.1111/j.1742-4658.2009.07555.x
The present study aimed to investigate the role played by the leaflets of the
plasma membrane in the uptake of drugs into cells and in their extrusion
by P-glycoprotein and multidrug resistance-associated protein 1. Drug
accumulation was monitored by fluorescence resonance energy transfer
from trimethylammonium-diphenyl-hexatriene (TMA-DPH) located at the
outer leaflet to a rhodamine analog. Uptake of dye into cells whose mito-
chondria had been inactivated was displayed as two phases of TMA-DPH
fluorescence quenching. The initial phase comprised a rapid drop in fluo-
rescence that was neither affected by cooling the cells on ice, nor by activ-
ity of mitochondria or ABC transporters. This phase reflects the
association of dye with the outer leaflet of the plasma membrane. The sub-
sequent phase of TMA-DPH fluorescence quenching occurred in drug-
sensitive cell lines with a half-life in the range 20–40 s. The second phase of
fluorescence quenching was abolished by incubation of the cells on ice and
was transiently inhibited in cells with active mitochondria. Thus, the sec-
ond phase of fluorescence quenching reflects the accumulation of dye in the
cytoplasmic leaflet of the plasma membrane, presumably as a result of flip-
flop of dye across the plasma membrane and slow diffusion from the inner
leaflet into the cells. Whereas activity of P-glycoprotein prevented the sec-
ond phase of fluorescence quenching, the activity of multidrug resistance-
associated protein 1 had no effect on this phase. Thus, P-glycoprotein
appears to pump rhodamines from the cytoplasmic leaflet either to the
outer leaflet or to the outer medium.
Abbreviations
CCCP, carbonyl cyanide m-chlorophenylhydrazone; FRET, fluorescence resonance energy transfer; MDR, multidrug resistance;
MRP1, multidrug resistance-associated protein; Pgp, P-glycoprotein; TMA-DPH, trimethylammonium-diphenyl-hexatriene;
TMRM, tetramethylrhodamine methyl ester.
1234 FEBS Journal 277 (2010) 1234–1244 ª 2010 The Authors Journal compilation ª 2010 FEBS
substrates are in the range 1–10 s
)1
, which is fast com-
pared to the flip-flop rates of drugs, such as doxorubi-
cin [6,7].
Pgp has been proposed to function as a ‘hydropho-
bic vacuum cleaner’, extracting its substrates directly
from the lipid core of the membrane rather than from
the aqueous phase [8]. This idea is supported by data
showing that the apparent affinity of a drug for bind-
ing to purified Pgp is highly correlated with its lipid–
water partition coefficient [9]. Subsequently, this model
has been refined and Pgp has been suggested to act as
a plasma membrane flippase, moving drug molecules
from the cytoplasmic leaflet to the extracellular leaflet
[10]. Romsicki and Sharom [11] have shown that Pgp
reconstituted into proteoliposomes transports lipid
analogs from the cytoplasmic leaflet to the extracellu-
lar leaflet. In contrast, it has been demonstrated that
reconstituted Pgp and the bacterial multidrug trans-
porter, LmrP, expel drugs from the cytoplasmic leaflet
of the membrane to the aqueous medium rather than
to the extracellular leaflet [12,13]. The question
remains as to whether the release of drugs from the
cytoplasmic leaflet of the plasma membrane into the
cytoplasm is fast, resulting in a practical equilibrium
between the drug concentrations in the cytoplasmic
leaflet and the cytoplasm, or whether the release is
slow, and drugs taken up into cells accumulate in the
cytoplasmic leaflet prior to being released into the
cytoplasm.
In the latter case, Pgp functioning as a flippase will
have the added advantage of capturing incoming drugs
before they reach the cytoplasm and at a transient high
local concentration. Moreover, in the latter case, Pgp
is expected to handle incoming drugs more efficiently
compared to drugs already present in the cell interior.
By contrast, in the case where drug concentrations in
the cytoplasm and the cytoplasmic leaflet are in equi-
librium, Pgp is expected to treat incoming drugs and
drugs already present within the cell in a similar
manner.
By contrast to Pgp, MRP1 functions as a glutathi-
one–X conjugate pump. It not only transports a vari-
ety of drugs conjugated to glutathione, sulfate or
glucuronate, as well as anionic drugs and dyes, but
also neutral ⁄ basic amphipathic drugs and even oxya-
nions. Previously, it has been assumed that the oxya-
nions arsenite and antimonite and the neutral ⁄ basic
drugs are cotransported by MRP1 with glutathione
[14]. However, recent data indicate that the mechanis-
tic interaction between the transported neutral ⁄ basic
drugs and the glutathione is more complicated [15].
The hydrophilic nature of some MRP1 substrates
makes it unlikely that MRP1 functions as a flippase
and extracts these substrates from the inner leaflet of
the plasma membrane. Rather, MRP1 pumps these
substrates directly from the cytoplasm.
The experiments conducted in the present study were
designed to dissect the cellular uptake of MDR-type
drugs into its constituent steps: uptake into the extra-
cellular leaflet, flip-flop across the lipid core of the
membrane and movement to the cytoplasmic leaflet of
the plasma membrane. First, an awareness of such
data should help to resolve an outstanding question: is
there a kinetic barrier between the cytoplasmic leaflet
of the plasma membrane and the cytoplasm? Such a
putative barrier would result in the cytoplasmic leaflet
constituting a kinetic compartment separate from the
extracellular leaflet and from the interior of the cell. In
the case where the cytoplasmic leaflet does constitute a
separate compartment, the accumulation of drug
within this would be accomplished prior to saturation
of the total cellular content of the drug. By contrast,
in the case where there is no kinetic barrier, drug accu-
mulation within the cytoplasmic leaflet would proceed
in parallel with total drug accumulation within the
cells. Second, measurement of drug accumulation in
the cytoplasmic leaflet should help determine whether
Pgp removes its substrates from the cytoplasmic leaflet,
as predicted by the vacuum cleaner model, whereas
MRP1 extracts its substrates from the cytoplasm.
Tetramethylrhodamine methyl ester (TMRM) served
as a highly fluorescent probe representing the MDR-
type drugs [16]. TMRM accumulation in the plasma
membrane leaflets was assayed in cells over-expressing
either Pgp or MRP1 and their sensitive parental lines.
TMRM accumulation was monitored as fluorescence
resonance energy transfer (FRET) from trimethyl-
ammonium-diphenyl-hexatriene (TMA-DPH) to the
TMRM present in the membrane or very close to it.
Because of its polar nature, TMA-DPH, unlike its ana-
log diphenyl hexatriene, has a high specificity for the
plasma membrane in intact cells [17,18]; TMA-DPH is
located within the lipid bilayer close to the outer sur-
face. The probe has been reported to be useful for
measurements of plasma membrane fluidity and for
studies on cellular exocytosis [19]. Kessel [20] found
similar values for TMA-DPH accumulation in drug-
resistant P388 cells and wild-type cells; no differences
were observed in the fluorescence anisotropy and life-
time of TMA-DPH between these cell lines, which
would indicate that there are no MDR-related differ-
ences in the binding of TMA-DPH to different cellular
components. On the basis of the overlap between the
fluorescence-emission spectrum of TMA-DPH and the
excitation spectrum of TMRM, FRET can occur, pro-
vided that the probe and the drug are sufficiently close.
H. Katzir et al. Cytoplasmic leaflet in drug uptake and resistance
FEBS Journal 277 (2010) 1234–1244 ª 2010 The Authors Journal compilation ª 2010 FEBS 1235
Thus, the degree of TMA-DPH fluorescence quenching
by TMRM may provide information on the amount of
TMRM associated with the plasma membrane, as
described previously for synthetic and natural mem-
brane vesicles [21,22].
Results
FRET from TMA-DPH to TMRM in cells sensitive
to anticancer drugs
The association of the dye, TMRM, with the surface
of cells was monitored as FRET from TMA-DPH
located at the outer leaflet of the plasma membrane to
this dye [23,24]. The background fluorescence of
TMA-DPH in the aqueous medium appeared to be
negligible. Immediately upon the addition of cells to a
medium containing TMA-DPH, the fluorescence of the
latter increased by at least a factor of 100 as a result
of adsorption of dye on the outer leaflet of their
plasma membrane [25]. Steady-state fluorescence was
reached after < 5 min. The fluorescence of TMA-
DPH was observed immediately at the periphery of the
cells (data not shown). After prolonged incubation,
additional fluorescence was observed within the cells.
However, this fluorescence, presumably located in the
mitochondria and endosomes [23], was faint compared
to the fluorescence at the periphery of the cells. The
quenching pattern of TMA-DPH fluorescence by
TMRM was unaffected by the preincubation period of
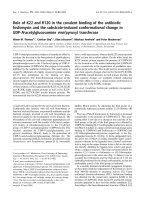
TMA-DPH with the cells (Fig. 1). Upon the addition
of TMRM to cells preincubated with TMA-DPH,
quenching of the fluorescence of the TMA-DPH
occurred in two steps: an initial fast drop in fluores-
cence followed by a slow further fluorescence quench-
ing. The simultaneous addition of the two dyes to cells
resulted in a slow quenching similar to the second step
that was observed when TMRM was added after
TMA-DPH. Presumably, when the two dyes are added
together, the initial quenching of fluorescence occurred
faster than the adsorption of TMA-DPH to the cells
and fluorescence quenching as a result of the added
TMRM prevented the rapid initial drop in fluorescence
observed when TMRM was added to cells preincubat-
ed with TMA-DPH. Thus, the measured FRET
occurred from the TMA-DPH located at the surface of
the plasma membrane and not from TMA-DPH
located within the cells.
The rapid initial quenching of the fluorescence was
essentially complete within 1 s after the addition of
TMRM. The extent of the initial quenching was linear
with the outer concentration of TMRM up to a con-
centration of 25 lm. Because the initial rapid drop in
TMA-DPH was not modulated by low temperatures
(Fig. 1), it reflects the absorption of TMRM to the
outer leaflet of the plasma membrane. After the initial
rapid quenching phase, a slower quenching phase was
observed at ambient temperatures, although not on
ice. Thus, the slower fluorescence quenching reflected
TMRM crossing a lipid barrier located in the plasma
membrane.
The main intracellular accumulation site of rhodam-
ines inside cells is the mitochondria. This accumulation
could be eliminated by poisoning the mitochondria
either with the uncoupler, carbonyl cyanide m-chloro-
phenylhydrazone (CCCP), or the respiration inhibitor,
sodium azide. Poisoning the mitochondria had no
effect on the initial rapid phase of TMA-DPH fluores-
cence quenching by TMRM. By contrast, poisoning
the mitochondria accelerated the second phase of
TMA-DPH fluorescence quenching by TMRM. The
resulting curve could be fitted to a first-order reaction
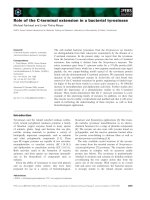
with half-lives in K562, GLC4 and 2008 cells of
36 ± 5, 19 ± 4 and 21 ± 6 s, respectively (Fig. 2).
To determine whether the second phase of TMA-
DPH fluorescence quenching by TMRM in the
B
A
TMA-DPH fluorescence
3 min
C
D
Fig. 1. TMA-DPH fluorescence quenching by TMRM. K562 cells
were incubated in the presence of glucose and sodium azide
(10 m
M)at37°C and their fluorescence was monitored continu-
ously using the excitation and emission wavelengths of TMA-DPH
fluorescence. Trace A: 2 l
M TMA-DPH was added at the time point
marked by the thin arrow and 25 l
M TMRM was added at the time
point marked by the thick arrow. Trace B: 2 l
M TMA-DPH was
added at the time point marked by the thin arrow and, 5 s later,
25 l
M TMRM was added. Trace C: 2 lM TMA-DPH and 25 lM
TMRM were added together at the time point marked by the
arrows. Trace D: Cells were incubated for 10 min at 37 °C with
2 l
M TMA-DPH. Subsequently, the cells were cooled by incubation
on ice for 5 min and, at the time point marked by the arrow, 25 l
M
TMRM was added. The extent of fluorescence drop presented in
trace D was equivalent to 0.26 ± 0.05 of the fluorescence
observed before the addition of the TMRM.
Cytoplasmic leaflet in drug uptake and resistance H. Katzir et al.
1236 FEBS Journal 277 (2010) 1234–1244 ª 2010 The Authors Journal compilation ª 2010 FEBS
presence of CCCP reflects the total cellular uptake of
TMRM, the time course of the quenching was com-
pared with the time course of TMRM uptake into the
cells. The time course of TMRM uptake into cells con-
sists of two stages: a first rapid stage that reflects bind-
ing of TMRM to the outer leaflet of the plasma
membrane and a subsequent uptake of TMRM into
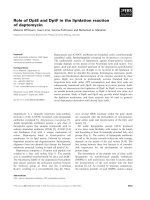
the cells [16]. The uptake of TMRM into K562 and
GLC4 cells occurred with half-lives of 3.7 ± 0.4 and
1.3 ± 0.2 min, respectively (as calculated based on
data presented in Fig. 3). Thus, the FRET was four-
to six-fold faster compared to the total uptake of
TMRM into the cells and the kinetics of the two
movements are separate.
A comparison of TMA-DPH fluorescence quenching
by TMRM observed in normally respiring cells and in
cells whose mitochondria had been poisoned reveals
that the active uptake of TMRM into the mitochon-
dria interferes with the second phase of TMA-DPH
quenching (Fig. 2). Initially, there is significant inhibi-
tion of the quenching in the respiring cells, which is
subsequently relieved, presumably as a result of satura-
tion of the mitochondria with TMRM. As shown in
Table 1, poisoning of the mitochondria with either
CCCP or sodium azide resulted in little change in their
ATP content. These cells relied mainly on glycolysis
for their ATP supply and only poisoning the mito-
chondria and glucose deprivation lead to a reduction
in cellular ATP content. Thus, the effect of the mito-
chondrial poisons on the secondary fluorescence drop
is not the result of an indirect effect mediated by ATP
depletion.
FRET from TMA-DPH to TMRM in multidrug
resistant cells
Over-expression of Pgp by K562 cells had no effect on
the rapid initial drop in TMA-DPH fluorescence
induced by TMRM. By contrast, it eliminated the sec-
ond phase of drop in TMA-DPH fluorescence induced
by TMRM (Fig. 4A). The activity of Pgp completely
cancelled the slow phase of fluorescence drop, both in
cells with active mitochondria and in cells whose mito-
chondria had been poisoned. This effect of the over-
expressed Pgp was partially reversed as a result of the
K562
A
B
5 min
C
TMA-DPH fluorescence
GLC4
A
3 min
B
2008
A
2 min
B
A
B
C
Fig. 2. Effect of poisoning the mitochondria on TMA-DPH fluores-
cence quenching by TMRM. (A) K562, (B) GLC4 or (C) 2008 cells
were incubated at 37 °C either in the absence (trace A) or presence
of either 1 l
M CCCP (trace B) or 10 mM sodium azide (trace C).
2 l
M TMA-DPH was added at the time points marked by the thin
arrows and 25 l
M TMRM was added at the time points marked by
the thick arrows. TMA-DPH fluorescence was monitored continu-
ously. The curves represent at least four separate experiments.
The curves describing the second, slow, phase of TMA-DPH fluo-
rescence quenching by TMRM in the presence of either CCCP or
sodium azide were fitted to the first-order reaction y = a · exp(–k ·
t)+c, where t is the time period elapsed from the addition of the
dye and k is the reaction constant; a and c represent the extent of
the secondary fluorescence drop and the fluorescence remaining
after both phases of fluorescence quenching, respectively. The k
values obtained served to calculate the half-life of the fluorescence
quenching. All fluorescence values are expressed as fractions of
the TMA-DPH fluorescence exhibited by the cells just before the
addition of the TMRM dye. The r
2
values obtained were > 0.95.
H. Katzir et al. Cytoplasmic leaflet in drug uptake and resistance
FEBS Journal 277 (2010) 1234–1244 ª 2010 The Authors Journal compilation ª 2010 FEBS 1237
modulation of Pgp activity by the chemosensitizers,
cyclosporine A, verapamil and reserpine, or by deple-
tion of cellular ATP. These treatments had no signifi-
cant effect on either the initial fast phase of
fluorescence in the Pgp-over-expressing cells or fluores-
cence quenching in wild-type cells (Fig. 5). Inhibition
of Pgp with cyclosporine A caused a parallel increase
in the amount of TMRM taken up by the cells as well
as the extent of the second phase of TMA-DPH fluo-
rescence quenching by TMRM (Figs 6 and 7). By con-
trast to over-expression of Pgp, over-expression of
MRP1 had no apparent effect on fluorescence quench-
ing of TMA-DPH by TMRM (Fig. 4B, C). As
expected, MRP1 activity had no apparent effect on the
rapid initial quenching of TMA-DPH fluorescence.
Moreover, MRP1 over-expression did not affect the
subsequent slow fluorescence quenching of TMA-DPH
fluorescence, either in respiring cells or in cells whose
mitochondria had been poisoned.
Discussion
Cellular uptake of the rhodamine, TMRM, was analy-
sed using FRET from the dye TMA-DPH located at
the surface of the cell plasma membrane to the incom-
ing rhodamine dye. The quenching of TMA-DPH
occurred in two distinct phases: an initial rapid phase
followed by a slower phase with a measurable kinetics.
Because the initial quenching phase was very rapid
and was unaffected by low temperatures, it represents
the adsorption of dye to the cell surface. The subse-
quent phase was eliminated at low temperatures and
thus involves transport across or into the lipid core of
the plasma membrane. This temperature-dependent flu-
orescence quenching phase exhibited the following
characteristics. (a) In the presence of mitochondrial
poisons, it occurred as a single first-order reaction. (b)
Active uptake of the TMRM by respiring mitochon-
dria transiently inhibited the temperature-dependent
fluorescence quenching. This inhibition could be pre-
vented by mitochondrial poisons such as the uncou-
pler, CCCP, and the respiration inhibitor, sodium
azide. Treatment of cells with these poisons did not
deplete the ATP content of the cells. Thus, the fluores-
cence quenching observed in the presence of these
poisons, especially the hydrophilic azide ion, does not
reflect a direct effect on the plasma membrane. (c) The
temperature-dependent fluorescence quenching was
prevented by the activity of over-expressed Pgp.
Fluorescence quenching could be restored by modu-
lation of Pgp activity, either by its specific inhibitors
or by depletion of cellular ATP.
The temperature-dependent fluorescence quenching
reflects the transfer of TMRM from its location at the
surface of the cells toward an inner location. Because
the cationic rhodamine dye is amphipathic, it is practi-
cally insoluble in the lipid core and is expected to be
3
3
GLC4
K562
2
2
1
1
0
0 102030
0.0 2.5 5.0 7.5 10.0
0
Time (min)
Cell-associated TMRM
(nmol 10
–6
cells)
Fig. 3. TMRM uptake into K562 (left) and GLC4 (right) cells. K562 or GLC4 cells were incubated with 25 lM TMRM in the presence (circles)
or absence (squares) of 1 l
M CCCP. Samples were withdrawn at various time points and the amount of TMRM associated with the cells
was determined by the quantitative procedure described in the Experimental procedures. The data describing the dye uptake into the cells
whose mitochondria were poisoned with CCCP were fitted to a first-order reaction with r
2
> 0.95, as described in Fig. 2.
Table 1. Effect of mitochondrial poisons on the cellular ATP con-
tent of K562 cells. K562 cells or their Pgp over-expressing sub-line,
K562 ⁄ ADR, were incubated for 30 min at 37 °C in the absence or
presence of 10 m
M glucose, 10 mM deoxyglucose, 1 lM CCCP or
1m
M azide. Cell samples were withdrawn and their ATP content
was determined. ATP content is expressed as a percentage of the
ATP content of the control K562 cells and their Pgp over-express-
ing cells (4.6 ± 0.6 and 5.3 ± 0.7 nmolÆ10
)6
cells, respectively).
K562
wild-type
Pgp
over-expressing
cells
Control 100 100
Azide + glucose 91 ± 7 88 ± 6
Azide + deoxyglucose 11 ± 2 18 ± 5
CCCP + glucose 89 ± 8 91 ± 6
CCCP + deoxyglucose 16 ± 5 11 ± 3
Cytoplasmic leaflet in drug uptake and resistance H. Katzir et al.
1238 FEBS Journal 277 (2010) 1234–1244 ª 2010 The Authors Journal compilation ª 2010 FEBS
localized at the surfaces of the plasma membrane.
Theoretically, this fluorescence quenching could be the
result of TMRM transfer from the cell surface further
into the outer leaflet of the membrane or flip-flop
across the membrane and residence in the inner leaflet
of the membrane. The observation that active uptake
of the TMRM by the mitochondria delays the temper-
ature-dependent fluorescence quenching is inconsistent
with the possibility that quenching occurs as a result
of dye moving within the outer leaflet of the plasma
membrane. The lipid core of the plasma membrane
constitutes the main barrier to TMRM transport
across the membrane and the mitochondria cannot
affect the TMRM concentration bound at the outer
leaflet. Thus, the temperature-dependent fluorescence
quenching reflects the flip-flop of TMRM from
the outer leaflet of the plasma membrane to the inner
K562/ADR
A
5 min
B
TMA-DPH fluorescence
B
TMA-DPH fluorescence
GLC4/ADR
A
2 min
B
TMA-DPH fluorescence
2008/MRP1
A
2 min
B
A
B
C
Fig. 4. TMA-DPH fluorescence quenching by TMRM in Pgp or
MRP1 over-expressing cells. Pgp over-expressing cells, (A)
K562 ⁄ ADR, or MRP1 over-expressing cells, (B) GLC4 ⁄ MRP1 and
(C) 2008 ⁄ MRP1, were incubated at 37 °C either in the absence
(trace A) or presence (trace B) of 1 l
M CCCP. 2 lM TMA-DPH was
added and the cells were incubated for a further 10 min. 25 l
M
TMRM was added at the time points marked by the arrows. TMA-
DPH fluorescence was monitored continuously. The curves repre-
sent at least four separate experiments. The curves describing the
second phase of TMA-DPH fluorescence quenching by TMRM in
presence of CCCP were fitted as a first-order reaction with
r
2
> 0.95, as described in Fig. 2.
Sensitive K562 cells
A
B
A
B
C
D
3 min
TMA-DPH fluorescence
TMA-DPH fluorescence
D
E
E
Resistant K562/ADR cells
B
A
B
C
D
3 min
D
E
E
Fig. 5. Effect of Pgp modulation on TMA-DPH fluorescence
quenching by TMRM. (A) K562 cells or (B) their Pgp over-express-
ing sub-line, K562 ⁄ ADR, were incubated at 37 °C in the presence
of glucose and 1 m
M azide and either in the absence (trace A) or
presence of 10 l
M cyclosporine (trace B), 100 lM verapamil (trace
C) or 30 l
M reserpine (trace D). Cells presented in trace E were
depleted of ATP by incubation for 30 min at 37 °C in the presence
of deoxyglucose instead of glucose and 1 m
M azide. At the time
points marked by the arrows, 2 l
M TMA-DPH was added and, after
a further 5 min of incubation, 25 l
M TMRM was added. TMA-DPH
fluorescence was monitored continuously. The curves represent at
least four separate experiments.
H. Katzir et al. Cytoplasmic leaflet in drug uptake and resistance
FEBS Journal 277 (2010) 1234–1244 ª 2010 The Authors Journal compilation ª 2010 FEBS 1239
leaflet. The expected distance between TMRM located
at the inner leaflet of the plasma membrane and
TMA-DPH located at the outer leaflet is somewhat
< 3 nm (i.e. a distance that could allow FRET
between these dyes).
The results obtained with FRET from TMA-DPH
to TMRM located at the outer leaflet of the plasma
membrane suggest that uptake of TMRM occurs in
distinct steps: rapid binding to the outer surface of
the cells, flip-flop across the plasma membrane, accu-
mulation of dye in the cytoplasmic leaflet of the
plasma membrane and release into the cell interior.
The initial binding of dye to the cells, evident as the
TMRM-mediated initial drop in TMA-DPH fluores-
cence, appears to be instantaneous, even at low
temperatures. Therefore, it is very rapid, possibly
limited by the diffusion of dye toward the cell. Local-
ization studies of multidrug-type drugs and modula-
tors suggest that, upon association of the TMRM
with the plasma membrane, it is located between the
phosphate of the lipid headgroups and the upper
segments of the lipid hydrocarbon chains [26].
The subsequent accumulation of dye in the cytoplas-
mic leaflet of the plasma membrane comprises a fast
process compared to the total uptake of dye into the
cells, indicating that, in kinetic terms, the cytoplasmic
leaflet comprises a compartment separate from the
cytoplasm. The accumulation of dye in the cytoplas-
mic leaflet is the outcome of a balance between the
rate of flip-flop across the membrane from the outer
leaflet to the cytoplasmic leaflet of the plasma mem-
brane and the release from the cytoplasmic leaflet into
the cell. Analysis using a kinetic model of drug uptake
into cells similar to the previously reported models
[27,28] suggests that a significant accumulation in the
cytoplasmic leaflet of the plasma membrane takes
place only when the release from the plasma mem-
brane into the cytoplasm occurs at a rate similar to
that of the flip-flop of dye across the plasma mem-
brane. In the case where the release into the cytoplasm
is fast compared to the flip-flop, the amount of dye
accumulated in the cytoplasmic leaflet will be insignifi-
cant. By contrast, in the case where diffusion into the
cells is slower than the flip-flop across the plasma
membrane, it will constitute the limiting step of dye
uptake into the cells.
The secondary drop in the TMRM-mediated TMA-
DPH fluorescence observed in cells whose mitochon-
dria were poisoned, reflects the flip-flop rate of dye
from the outer leaflet of the plasma membrane to the
cytoplasmic leaflet. The apparent half-life of the flip-
flop was in the range 20–40 s in the various cell lines
investigated in the present study. This half-life value
was similar to the flip-flop value of doxorubicin
observed in cell-free systems such as liposomes and iso-
lated erythrocyte membranes [4,5]. The half-life of the
flip-flop observed as the drop in TMA-DPH fluores-
cence is a minimum value because the step subsequent
0.0
0.1
0.2
1.0
TMA-DPH fluorescence
5.0
K562
5 min
Sensitive cells
Fig. 6. Effect of various cyclosporine concentrations on TMA-DPH
fluorescence quenching by TMRM in Pgp over-expressing cells,
K562 ⁄ ADR, or K562 sensitive cells, were incubated in the presence
of 1 l
M CCCP, 2 lM TMA-DPH and various concentrations of cyclo-
sporine A (l
M concentrations are indicated) for 15 min and then
25 l
M TMRM was added at the time points marked by the arrows.
TMA-DPH fluorescence was monitored continuously. The curves
represent at least four separate experiments. The curves describing
the second phase of TMA-DPH fluorescence quenching by TMRM
in presence of CCCP were fitted as a first-order reaction with
r
2
> 0.95, as described in Fig. 2.
1.5
1.0
0.20
0.15
0.10
0.5
0.05
Cell associated TMRM
(nmol 10
–6
cells)
Extent of fluorescence drop
(fraction of total fluorescence)
0.1 1.0 10
Sensitive
cells
0.0
C
y
clos
p
orine [µM]
Fig. 7. Effect of cyclosporine A on FRET from TMA-DPH to TMRM
and TMRM uptake in Pgp over-expressing cells. K562 ⁄ ADR cells
were treated as described in Fig. 6. The amount of TMRM that
was associated with cells during 30 min of incubation (circles) was
determined quantitavely as described in the Experimental proce-
dures. The extent of the second phase of fluorescence quenching
by TMRM (squares) was determined by fitting the relevant curves
from Fig. 6 to equations describing a first-order reaction, as
described in Fig. 2.
Cytoplasmic leaflet in drug uptake and resistance H. Katzir et al.
1240 FEBS Journal 277 (2010) 1234–1244 ª 2010 The Authors Journal compilation ª 2010 FEBS
to the flip-flop, namely the release of dye into the cyto-
plasm, can appear to accelerate the rate at which dye
accumulation in the cytoplasmic leaflet of the plasma
membrane reaches steady-state. Fast release of dye will
result in shorter apparent half-life of the flip-flop of
dye across the membrane.
Surprisingly, and of interest, the active uptake of
dye into the mitochondria prevented the accumulation
of dye in the cytoplasmic leaflet of the plasma mem-
brane. Only after a prolonged period, TMRM was
accumulated in the cytoplasmic leaflet of the plasma
membrane, presumably as a result of saturation of the
mitochondria, leading to diminished uptake of TMRM
into the mitochondria. Because there are no reports of
direct contact of mitochondria with the plasma mem-
brane, we have to assume that the mitochondria do
not pump the dye directly from the plasma membrane
but, instead, from the cytoplasm adjacent to the mem-
brane. On the basis of this observation, it can be
deduced that the limiting step in the release of
dye from the plasma membrane is not the actual
release from the membrane but, instead, the movement
away from the plasma membrane into the cell. The
cytoplasm next to the plasma membrane is unstirred
and dense with proteins. Moreover, TMRM and anti-
cancer drugs, such as anthracyclines, are positively
charged and therefore bind to acidic groups in proteins
and membranes. Thus, their movement into the cell
can be envisaged as a series of binding and releasing
events rather than simple diffusion. However, it should
be stressed that although, in kinetic terms, the com-
partment of the plasma membrane includes the cyto-
plasm layer adjacent to the plasma membrane, the
drop in TMA-DPH fluorescence reflects almost exclu-
sively the dye present in the cytoplasmic leaflet. This is
a result of the partition of the dye into the plasma
membrane in preference to remaining soluble in the
aqueous cytoplasm.
The data of the FRET from TMA-DPH to TMRM
suggest that Pgp extracts its substrates directly from
the cytoplasmic leaflet of the plasma membrane. This
is consistent with the suggestion made by Higgins and
Gottesman [10] that Pgp acts as a flippase transporting
its substrates from the cytoplasmic leaflet of the lipid
bilayer to the outer leaflet or to the external medium.
The data reported in the present study, and obtained
in living cells, confirm the finding obtained in reconsti-
tuted proteoliposomes [11,12] and isolated membranes
[29,30] indicating that Pgp and a bacterial multidrug
ABC-transporter extract their substrates from the cyto-
plasmic leaflet of the membrane.
By contrast to Pgp, over-expression of MRP1 does
not affect the presence of TMRM in the cytoplasmic
leaflet, but appears to pump it directly from the cyto-
plasm. Over-expression of MRP1 did not alter the pat-
tern of the drop in TMA-DPH fluorescence observed
in the sensitive parent cell lines. MRP1 transports, on
the one hand, organic anions, such as glutathione con-
jugates, and, on the other hand, basic hydrophobic
drugs, such as daunorubicin and vincristine [14]. It has
been suggested that MRP1 has two binding sites: one
with high affinity for hydrophobic ligands and the
other with high affinity for glutathione [31,32]. The
results obtained in the present study suggest that both
sites are not located within the plasma membrane, but
at its surface. The difference in the transport mecha-
nisms between Pgp and MRP1, as revealed with FRET
from TMA-DPH to TMRM is not the result of higher
resistance levels in the Pgp cells. Inhibition of Pgp with
various concentrations of cyclosporin A allowed for
corresponding levels of TMRM accumulation,
although in no case was the pattern of TMA-DPH
fluorescence drop similar to that observed in sensitive
cells, as is the case in MRP1 over-expressing cells.
The finding that the cytoplasmic leaflet of the
plasma membrane constitutes a kinetic compartment
separate from the cell interior emphasizes the relevance
of Pgp as a flippase to multidrug resistance. Drugs
taken up into cells stay in the cytoplasmic leaflet of the
plasma membrane for a few seconds before reaching
the cell interior. Thus, Pgp that extracts its substrates
from the cytoplasmic leaflet of the plasma membrane
has the opportunity to remove drugs from the cells
before they reach the cell interior. Pgp is adapted to
prevent drugs from entering cells rather than to
remove drugs already present in the cells. By contrast,
transporters such as MRP1 extract their substrates
directly from the cytoplasm and are more adapted to
remove drugs already present inside the cells than to
prevent the access of drugs into the cells. This phe-
nomenon is especially relevant to drug transcellular
transport and multidrug resistance in cell monolayers
such as the blood–brain barrier and the epithelia lining
the intestine and the nephrons. It has been shown that
the tight junctions pose a barrier to the movement of
lipids between the outer leaflets of the apical and baso-
lateral domains of the plasma membrane [33]. By con-
trast, they do not interfere with the movement of lipids
and presumably drugs between the cytoplasmic leaflets
of these domains [33]. Transcellular movement across
cell monolayers of certain drugs and dyes, such as
TMRM, is expected to occur mainly by rapid incorpo-
ration into the outer leaflet of the plasma membrane,
flip-flop across the lipid core of the membrane, lateral
movement in the cytoplasmic leaflet of the plasma
membrane from one membrane domain to the other,
H. Katzir et al. Cytoplasmic leaflet in drug uptake and resistance
FEBS Journal 277 (2010) 1234–1244 ª 2010 The Authors Journal compilation ª 2010 FEBS 1241
flip-flop again across the lipid core of the membrane
and, finally, release from the plasma membrane into
the aqueous phase. Thus, drugs and dyes with a high
partition coefficient (membrane ⁄ aqueous phase) are
expected to cross cell monolayers via lateral movement
in the cytoplasmic leaflet of the plasma membrane,
with little access into the cells’ cytoplasm. Indeed,
kinetic analysis of drug transport across kidney conflu-
ent cell monolayers suggests that hydrophobic drugs
cross the monolayer by lateral transport in the cyto-
plasmic leaflet of the plasma membrane rather than via
the cytoplasm [34].
Experimental procedures
K562, a human leukemia cell line established from a
patient with chronic myelogeneous leukemia in blast trans-
formation [35], was purchased from ATCC (Rockville,
MD, USA) and maintained in RPMI medium (Biological
Industries, Beit-Haemmek, Israel). The K562 Pgp-over-
expressing subline was obtained by sequential exposure of
cells to increasing concentrations of doxorubicin and was
maintained in the presence of 0.5 lm doxorubicin. 2008
parental cells and their MRP1 over-expressing subline [36]
were kindly provided by P. Borst (Netherlands Cancer
Institute, Amsterdam, The Netherlands) and grown in
RPMI-1640 (Sigma-Aldrich, Rehovot, Israel) The CIR
[37], GLC4 cells and MRP1-over-expressing GLC4 ⁄ ADR
cells [38] were cultured in RPMI 1640 either in the
absence or presence of 1 lm doxorubicin. All media were
supplemented with 10% fetal bovine serum, 100 IUÆmL
)1
penicillin and 100 lgÆmL
)1
streptomycin (Invitrogen,
Rehovot, Israel) and the cells were grown at 37 °C under
5% CO
2
⁄ humidified air. TMRM, Silicone oil AR200 and
mineral oil were purchased from Sigma-Aldrich. Cellular
ATP content was measured by the luciferin-luciferase
assay [39].
Measurement of FRET from TMA-DPH to TMRM
Cells were labeled with TMA-DPH (2 lm) by incubation at
37 °C. The fluorescence of TMA-DPH was monitored con-
tinuously with the temperature maintained at 37 °C. In a
typical experiment, 2 · 10
6
cells were incubated with stir-
ring in 2 mL of medium composed of NaCl (132 mm), KCl
(3.5 mm), CaCl
2
(1 mm), MgCl
2
(0.5 mm), glucose (10 mm)
and Hepes-Tris buffer (20 mm, pH 7.4). A concentration of
2 lm TMA-DPH was added, leading to a rapid rise in
TMA-DPH fluorescence. After further incubation for 10–
15 min, TMRM (25 lm) was added. The TMA-DPH fluo-
rescence was monitored continuously in a Varian Cary
Eclipse fluorescence spectrophotometer (Varian Inc., Palo
Alto, CA, USA) using an excitation wavelength of 366 nm
and an emission wavelength of 426 nm.
Quantitative determination of the amount of
TMRM associated with cells
For determination of the amount of TMRM associated
with cells, cells were incubated with the dye in the medium
described above. Samples containing 4 · 10
5
cells in
0.4 mL of medium were withdrawn and placed in an
Eppendorf-style microfuge above a 0.2 mL cushion consist-
ing of 95 parts Silicone oil AR 200 (d
20
= 1.049) and five
parts mineral oil (d
20
= 0.89). After centrifugation for
4 min at 13 200 g at room temperature, the oil cushion
was washed three times with water by suction. Subse-
quently, all of the upper phase, including part of the oil
cushion, was removed, leaving a fraction of the oil above
the cell pellets. The cell pellets were dissolved by the addi-
tion of 0.1 mL of guanidine HCl (5 m) buffered with
Hepes-Tris (50 mm, pH 7.4), centrifugation for 5 min and
incubation for at least 1 h at room temperature. The
dissolved samples were mixed thoroughly with 0.5 mL of
water and centrifuged for 5 min. Samples (0.4 mL) were
withdrawn from the pellets dissolved in the aqueous phase.
The fluorescence of TMRM was determined using an exci-
tation wavelength of 563 nm and an emission wavelength
of 583 nm. To ensure fidelity of the assay, dye-free cell
samples were mixed with known amounts of rhodamines
and processed as above. The rhodamine yield thus
obtained matched the amount expected. To determine the
volume of incubation medium carried through the oil cush-
ion together with the cells, a cell sample was incubated on
ice with 10 lm acidic dye (calcein) and processed as
above. The amount of calcein associated with the cells was
equivalent to < 0.05% of the sample volume. The time
period required to separate cells from the external medium
was equivalent to 0.5 min. All curves were adjusted
accordingly.
References
1 Gottesman MM & Pastan I (1993) Biochemistry of
multidrug resistance mediated by the multidrug trans-
porter. Annu Rev Biochem 62, 385–427.
2 Cole SP, Bhardwaj G, Gerlach JH, Mackie JE, Grant
CE, Almquist KC, Stewart AJ, Kurz EU, Duncan AM
& Deeley RG (1992) Overexpression of a transporter
gene in a multidrug-resistant human lung cancer cell
line. Science 258, 1650–1654.
3 Higgins CF (1992) ABC transporters: from microorgan-
isms to man. Annu Rev Cell Biol 8, 67–113.
4 Regev R & Eytan GD (1997) Flip-flop of doxorubicin
across erythrocyte and lipid membranes. Biochem
Pharmacol 54, 1151–1158.
5 Regev R, Yeheskely-Hayon D, Katzir H & Eytan GD
(2005) Transport of anthracyclines and mitoxantrone
across membranes by a flip-flop mechanism. Biochem
Pharmacol 70, 161–169.
Cytoplasmic leaflet in drug uptake and resistance H. Katzir et al.
1242 FEBS Journal 277 (2010) 1234–1244 ª 2010 The Authors Journal compilation ª 2010 FEBS
6 Urbatsch IL, al-Shawi MK & Senior AE (1994) Charac-
terization of the ATPase activity of purified Chinese
hamster P-glycoprotein. Biochemistry 33, 7069–7076.
7 Ambudkar SV, Cardarelli CO, Pashinsky I & Stein WD
(1997) Relation between the turnover number for
vinblastine transport and for vinblastine-stimulated
ATP hydrolysis by human P-glycoprotein. J Biol Chem
272, 21160–21166.
8 Raviv Y, Pollard HB, Bruggemann EP, Pastan I &
Gottesman MM (1990) Photosensitized labeling of a
functional multidrug transporter in living drug-resistant
tumor cells. J Biol Chem 265, 3975–3980.
9 Romsicki Y & Sharom FJ (1999) The membrane lipid
environment modulates drug interactions with the P-
glycoprotein multidrug transporter. Biochemistry 38,
6887–6896.
10 Higgins CF & Gottesman MM (1992) Is the multidrug
transporter a flippase? Trends Biochem Sci 17, 18–21.
11 Romsicki Y & Sharom FJ (2001) Phospholipid flippase
activity of the reconstituted P-glycoprotein multidrug
transporter. Biochemistry 40, 6937–6947.
12 Shapiro AB & Ling V (1997) Extraction of Hoechst
33342 from the cytoplasmic leaflet of the plasma mem-
brane by P-glycoprotein. Eur J Biochem 250, 122–129.
13 Margolles A, Putman M, van Veen HW & Konings
WN (1999) The purified and functionally reconstituted
multidrug transporter LmrA of Lactococcus lactis medi-
ates the transbilayer movement of specific fluorescent
phospholipids. Biochemistry 38, 16298–16306.
14 Borst P & Elferink RO (2002) Mammalian ABC trans-
porters in health and disease. Annu Rev Biochem 71,
537–592.
15 Borst P, Zelcer N, van de Wetering K & Poolman B
(2006) On the putative co-transport of drugs by multi-
drug resistance proteins. FEBS Lett 580, 1085–1093.
16 Yeheskely-Hayon D, Regev R, Katzir H & Eytan GD
(2009) Competition between innate multidrug resistance
and intracellular binding of rhodamine dyes. Febs J
276, 637–648.
17 Kuhry JG, Fonteneau P, Duportail G, Maechling C &
Laustriat G (1983) TMA-DPH: a suitable fluorescence
polarization probe for specific plasma membrane fluid-
ity studies in intact living cells. Cell Biophys 5,
129–140.
18 Prendergast FG, Haugland RP & Callahan PJ (1981)
1-[4-(Trimethylamino)phenyl]-6-phenylhexa-1,3,5-triene:
synthesis, fluorescence properties, and use as a fluores-
cence probe of lipid bilayers. Biochemistry 20,
7333–7338.
19 Kuhry JG, Duportail G, Bronner C & Laustriat G
(1985) Plasma membrane fluidity measurements on
whole living cells by fluorescence anisotropy of trim-
ethylammoniumdiphenylhexatriene. Biochim Biophys
Acta 845, 60–67.
20 Kessel D (1988) Probing membrane alterations associ-
ated with anthracycline resistance using fluorescent
dyes. Biochem Pharmacol 37, 4253–4256.
21 Ferrer-Montiel AV, Gonzalez-Ros JM & Ferragut JA
(1988) Association of daunomycin to membrane
domains studied by fluorescence resonance energy trans-
fer. Biochim Biophys Acta 937, 379–386.
22 Ferrer-Montiel AV, Gonzalez-Ros JM & Ferragut JA
(1992) Different distribution of daunomycin in plasma
membranes from drug-sensitive and drug-resistant P388
leukemia cells. Biochim Biophys Acta 1104 , 111–116.
23 Chen Y, Pant AC & Simon SM (2001) P-glycoprotein
does not reduce substrate concentration from the extra-
cellular leaflet of the plasma membrane in living cells.
Cancer Res 61, 7763–7769.
24 Mulder HS, van Grondelle R, Westerhoff HV &
Lankelma J (1993) A plasma membrane ‘vacuum
cleaner’ for daunorubicin in non-P- glycoprotein multi-
drug-resistant SW-1573 human non-small cell lung
carcinoma cells. A study using fluorescence resonance
energy transfer. Eur J Biochem 218, 871–882.
25 Griffin EA, Vanderkooi JM, Maniara G & Erecinska
M (1986) Anthracycline binding to synthetic and natu-
ral membranes. A study using resonance energy trans-
fer. Biochemistry 25, 7875–7880.
26 Siarheyeva A, Lopez JJ & Glaubitz C (2006) Localiza-
tion of multidrug transporter substrates within model
membranes. Biochemistry 45, 6203–6211.
27 Eytan GD, Regev R, Oren G & Assaraf YG (1996) The
role of passive transbilayer drug movement in multidrug
resistance and its modulation. J Biol Chem 271, 12897–
12902.
28 Eytan GD (2005) Mechanism of multidrug resistance in
relation to passive membrane permeation. Biomed Phar-
macother 59, 90–97.
29 Shapiro AB & Ling V (1998) Transport of LDS-751
from the cytoplasmic leaflet of the plasma membrane
by the rhodamine-123-selective site of P-glycoprotein.
Eur J Biochem 254, 181–188.
30 Bolhuis H, van Veen HW, Brands JR, Putman M,
Poolman B, Driessen AJM & Konings WN (1996)
Energetics and mechanism of drug transport mediated
by the lactococcal multidrug transporter LmrP. J Biol
Chem 271, 24123–24128.
31 Evers R, de Haas M, Sparidans R, Beijnen J, Wielinga
PR, Lankelma J & Borst P (2000) Vinblastine and
sulfinpyrazone export by the multidrug resistance
protein MRP2 is associated with glutathione export.
Br J Cancer 83, 375–383.
32 Heijn M, Hooijberg JH, Scheffer GL, Szabo G,
Westerhoff HV & Lankelma J (1997) Anthracyclines
modulate multidrug resistance protein (MRP) mediated
organic anion transport. Biochim Biophys Acta 1326,
12–22.
H. Katzir et al. Cytoplasmic leaflet in drug uptake and resistance
FEBS Journal 277 (2010) 1234–1244 ª 2010 The Authors Journal compilation ª 2010 FEBS 1243
33 van Meer G & Simons K (1986) The function of tight
junctions in maintaining differences in lipid composition
between the apical and the basolateral cell surface
domains of MDCK cells. EMBO J 5, 1455–1464.
34 Tran TT, Mittal A, Aldinger T, Polli JW, Ayrton A,
Ellens H & Bentz J (2005) The elementary mass action
rate constants of P-gp transport for a confluent
monolayer of MDCKII-hMDR1 cells. Biophys J 88,
715–738.
35 Lozzio CB & Lozzio BB (1975) Human chronic myelog-
enous leukemia cell-line with positive Philadelphia chro-
mosome. Blood 45 , 321–334.
36 Adachi M, Sampath J, Lan LB, Sun D, Hargrove P,
Flatley R, Tatum A, Edwards MZ, Wezeman M,
Matherly L et al. (2002) Expression of MRP4 confers
resistance to ganciclovir and compromises bystander cell
killing. J Biol Chem 277, 38998–39004.
37 Storkus WJ, Alexander J, Payne JA, Dawson JR &
Cresswell P (1989) Reversal of natural killing
susceptibility in target cells expressing transfected
class I HLA genes. Proc Natl Acad Sci USA 86,
2361–2364.
38 Zijlstra JG, de Vries EG & Mulder NH (1987) Multi-
factorial drug resistance in an adriamycin-resistant
human small cell lung carcinoma cell line. Cancer Res
47, 1780–1784.
39 Kimmich GA, Randles J & Brand JS (1975) Assay
of picomole amounts of ATP, ADP, and AMP using
the luciferase enzyme system. Anal Biochem 69,
187–206.
Cytoplasmic leaflet in drug uptake and resistance H. Katzir et al.
1244 FEBS Journal 277 (2010) 1234–1244 ª 2010 The Authors Journal compilation ª 2010 FEBS