Báo cáo khoa học: Inhibition kinetics of catabolic dehydrogenases by elevated moieties of ATP and ADP – implication for a new regulation mechanism in Lactococcus lactis potx
Bạn đang xem bản rút gọn của tài liệu. Xem và tải ngay bản đầy đủ của tài liệu tại đây (380.81 KB, 10 trang )
Inhibition kinetics of catabolic dehydrogenases by
elevated moieties of ATP and ADP – implication for a new
regulation mechanism in Lactococcus lactis
Rong Cao, Ahmad A. Zeidan, Peter Ra
˚
dstro
¨
m and Ed W. J. van Niel
Department of Applied Microbiology, Lund University, Sweden
Introduction
The lactic acid bacterium, Lactococcus lactis, plays
an essential role in the manufacture of a wide range
of dairy products. In recent years, L. lactis has also
been used in industrial lactic acid production, as it
has a rather simple and well-characterized metabo-
lism and converts sugars mainly into lactate via gly-
colysis [1]. However, under certain conditions, this
homolactic fermentation is shifted to mixed-acid pro-
duction, i.e. formate, acetate and ethanol, in addition
to lactate [2].
In glycolysis, glyceraldehyde-3-phosphate dehydroge-
nase (GAPDH) converts NAD
+
to NADH, which
must be regenerated for continued carbon catabolism.
Lactate dehydrogenase (LDH) regenerates NAD by
Keywords
ADP; ATP; dehydrogenase; Lactococcus
lactis; multiple inhibition kinetics
Correspondence
E. W. J. van Niel, Department of Applied
Microbiology, Lund University, PO Box 124,
SE-221 00 Lund, Sweden
Fax: +46 46 2224203
Tel: +46 46 2220619
E-mail:
(Received 22 September 2009, revised
18 December 2009, accepted 1 February
2010)
doi:10.1111/j.1742-4658.2010.07601.x
ATP and ADP inhibit, in varying degrees, several dehydrogenases of the
central carbon metabolism of Lactococcus lactis ATCC 19435 in vitro, i.e.
glyceraldehyde-3-phosphate dehydrogenase (GAPDH), lactate dehydroge-
nase (LDH) and alcohol dehydrogenase (ADH). Here we demonstrate
mixed inhibition for GAPDH and competitive inhibition for LDH and
ADH by adenine nucleotides in single inhibition studies. The nonlinear
negative co-operativity was best modelled with Hill-type kinetics, showing
greater flexibility than the usual parabolic inhibition equation. Because
these natural inhibitors are present simultaneously in the cytoplasm, multi-
ple inhibition kinetics was determined for each dehydrogenase. For ADH
and LDH, the inhibitor combinations ATP plus NAD and ADP plus
NAD are indifferent to each other. Model discrimination suggested that
the weak allosteric inhibition of GAPDH had no relevance when multiple
inhibitors are present. Interestingly, with ADH and GAPDH the combina-
tion of ATP and ADP exhibits lower dissociation constants than with
either inhibitor alone. Moreover, the concerted inhibition of ADH and
GAPDH, but not of LDH, shows synergy between the two nucleotides.
Similar kinetics, but without synergies, were found for horse liver and yeast
ADHs, indicating that dehydrogenases can be modulated by these nucleo-
tides in a nonlinear manner in many organisms. The action of an elevated
pool of ATP and ADP may effectively inactivate lactococcal ADH, but
not GAPDH and LDH, providing leverage for the observed metabolic shift
to homolactic acid formation in lactococcal resting cells on maltose. There-
fore, we interpret these results as a regulation mechanism contributing to
readjusting the flux of ATP production in L. lactis.
Abbreviations
ADH, alcohol dehydrogenase; GAPDH, glyceraldehyde-3-phosphate dehydrogenase; LDH, lactate dehydrogenase; PFL, pyruvate
formate-lyase; rmse, root-mean-square error; TEA, triethanolamine.
FEBS Journal 277 (2010) 1843–1852 ª 2010 The Authors Journal compilation ª 2010 FEBS 1843
converting the end product of glycolysis, pyruvate, to
lactate. An alternative way for lactococci to regenerate
NAD in anaerobic conditions is through alcohol dehy-
drogenase (ADH), which is part of the pyruvate
formate-lyase (PFL) pathway. The first enzyme in the
PFL pathway converts pyruvate to formate and acetyl
coenzyme A, which is further metabolized to either
ethanol or acetate. PFL is inactive in the presence of
oxygen and at a low pH [3,4]. With an active PFL
pathway, three molecules of ATP are produced per
hexose molecule catabolized, compared with the two
ATP molecules conserved per hexose molecule when
LDH is used. The extra ATP is derived from the pro-
duction of acetate catalysed by acetate kinase. NAD
+
is then regenerated via reduction of acetyl coenzyme
A, with ethanol as an end product.
Homolactic behaviour is seen only during rapid
growth in the presence of excess glucose and in resting
cells [1], whereas mixed-acid fermentation is observed
in glucose-limited conditions [2], and with growth on
maltose, galactose or trehalose [5–7]. Under various
growth conditions, the shift from mixed-acid to
homolactic formation in L. lactis has been ascribed to
allosteric regulation of: (a) PFL by glyceraldehyde-
3-phosphate and dihydroxyacetone phosphate [4]; (b)
LDH by the ratio of fructose 1,6-diphosphate and
orthophosphate [4,8,9]; and (c) GAPDH and LDH by
the redox charge (or NADH ⁄ NAD ratio) [10,11]. The
latter hypothesis has been disproved in other studies in
which the enzymatic level of GAPDH has been altered
[11,12]. However, all of these regulations probably
work in concert.
Myriads of previous studies have identified adenine
nucleotides, i.e. ATP, ADP and AMP, as inhibitors
for dehydrogenases [13–18]. Nakamura et al. [17] sug-
gested that GAPDH, which plays a regulatory role in
glycolysis in round spermatids, is strongly inhibited by
AMP and ADP at physiological concentrations. In
addition, the inhibition mechanism by ATP and the
relationship of this inhibition to regulate glycolysis in
resting and contracting muscle cells was hypothesized
[18]. Palmfeldt et al. [1] indicated that the ATP plus
ADP moiety might have a regulating function in non-
growing cells of L. lactis ATCC 19435 fermenting
maltose. The conclusion was partly based on changes
in this moiety and the in vitro-determined inhibition of
GAPDH, LDH and ADH by ATP and ADP indepen-
dently.
Herein we characterize the inhibition kinetics of
these three dehydrogenases with their most important
natural inhibitors, i.e. ATP, ADP and the product of
their coenzyme, i.e. NAD or NADH. Our approach
was to estimate the kinetic parameters of the enzymes
in cell extracts, rather than of the purified enzymes,
for mimicking the complete system [1]. Studies
with purified enzymes may not reflect what is happen-
ing in the whole cell [19]. It is known that L. lactis
possesses isozymes of each of these dehydrogenases,
e.g. L. lactis IL1403 contains three genes for LDH,
two for ADH and two for GAPDH [20], which all
could have been affected one way or another by both
ATP and ADP. However, the few studies related to
the expression of the dominant isozymes [21–23],
including our own unpublished results, are discussed.
From the kinetics study, it was concluded that the
inhibition action of the ADP plus ATP moiety is of a
co-operative nature and mainly affects ADH such
that it will contribute to inhibiting mixed-acid forma-
tion. A similar nonlinear inhibition was also observed
with purified enzymes, i.e. commercial horse liver and
yeast ADH, justifying the determinations carried out
with cell extracts. Moreover, it also demonstrates that
this type of inhibition can occur in eukaryotic ADHs,
indicating that this type of inhibition might be wide-
spread in nature.
Results
Inhibition kinetics by a single inhibitor
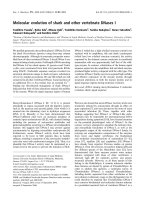
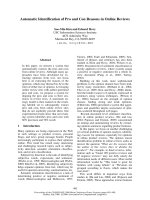
The inhibition kinetics of lactococcal GAPDH, LDH
and ADH were determined in vitro for each inhibitor,
ATP, ADP, AMP and their corresponding coenzyme
product, i.e. NAD or NADH. Cornish–Bowden plots
revealed that the nature of inhibition for most of these
cases was that of the parabolic competitive (LDH,
Fig. 1B) or parabolic mixed (GAPDH) inhibition type,
except for the inhibition of LDH by NAD (Fig. 1A).
As an example, the parabolic competitive inhibition of
LDH by ADP is shown in Fig. 1B (for all other cases,
see Fig. S1). The Cornish–Bowden plot demonstrated
inhibition of GAPDH by AMP as mixed inhibition
(Fig. S1), but model fitting resulted in high confi-
dence intervals for most of the parameters (Table 1).
The competitive inhibition model (Eqn 2) also fitted
well [adjusted R
2
= 0.987, root-mean-square error
(rmse) = 0.0016], but had parameter values with
lower confidence intervals (e.g. K
i
=0.47 ± 0.19,
n = 1.15 ± 0.26). The inhibitory effect of NAD on
ADH and that of NADH on GAPDH was more com-
plex than according to Eqns (2) or (3) and was not
investigated further.
Mathematically, this parabolic inhibition could be
described by introducing the Hill-type kinetics to the
inhibition terms as described in Eqns (2, 3) and
through statistical evaluation (Table 1) it was found to
Inhibition kinetics of dehydrogenases R. Cao et al.
1844 FEBS Journal 277 (2010) 1843–1852 ª 2010 The Authors Journal compilation ª 2010 FEBS
be superior and more flexible than the equation nor-
mally used for parabolic inhibition [24]:
v ¼
V
MAX
Á S
K
M
Á½1 þ 2 Á
I
K
IC
þ
1
c
Áð
I
K
IC
Þ
2
þS
ð1Þ
containing c as a factor by which the first inhibitor
molecule changes the intrinsic dissociation constant of
the vacant site.
Interestingly, only the complete and partial inhibi-
tion displayed the Hill-type of inhibition Eqns (2, 3).
No good fits were obtained when a Hill-type inhibition
was introduced to the uncompetitive part. In conclu-
sion, the inhibitors bind to the active site of all three
dehydrogenases, and in the case of GAPDH will also
bind to an allosteric site.
The various parameter values were estimated using
Eqn (2) for LDH and ADH and Eqn (3) for GAPDH
(Table 1, Figs S2, S3). For LDH, ATP and NAD have
nearly the same inhibitory strength with Hill coeffi-
cients close to 1, whereas ADP is a slightly stronger
inhibitor, having a Hill coefficient higher than 1. For
ADH, the dissociation constants and Hill coefficients
are low for ADP, but high for ATP. Thus, separately
each inhibitor affects ADH activity only moderately.
ATP and ADP are strong competitive inhibitors for
GAPDH due to their small dissociation constants and
relatively high Hill coefficients. The uncompetitive
inhibition of GAPDH by ATP and ADP, on the other
hand, is weak, as illustrated by their high dissociation
constants. However, it is still significantly present, as
concluded from the data fitting: with Eqn (2) larger
confidence intervals and rmse and lower adjusted R
2
(0.950 and 0.968 for ATP and ADP, respectively) were
obtained than with Eqn (3) (Table 1).
0
0.005
0.01
0.015
0.02
01234
NADH/v
NAD (mM)
0
0.01
0.02
0.03
012345
NADH/v
ADP (mM)
A
B
Fig. 1. Cornish–Bowden plots of single inhibition of LDH by NAD
+
and ADP. (A) LDH competitive inhibition by NAD at different
NADH concentrations (m
M): 0.2 (h), 0.18 ( ), 0.14 (D), 0.1 ( ),
0.06 (o). (B) Parabolic competitive inhibition of LDH by ADP at dif-
ferent NADH concentrations (m
M): 0.2 (h), 0.18 ( ), 0.12 (D),
0.09 (
).
Table 1. The estimated V
MAX
and K
M
(mM) of the cofactor substrate (NADH or NAD) and estimated parameter values (K
IC
and K
IU
;mM) and
Hill coefficient (n) with 95% confidence intervals for the competitive inhibition kinetics (Eqn 2) of LDH and ADH and the mixed inhibition
kinetics (Eqn 3) of GAPDH with ATP, ADP, AMP and cofactor product (NAD for LDH and ADH, and NADH for GAPDH). rmse, root-mean-
square error.
Inhibitor
Parameter values ± confidence intervals Goodness of fit
K
IC
K
IU
nK
M
V
MAX
R
2
Adjusted R
2
rmse
LDH ATP 2.55 ± 0.54 – 1.15 ± 0.32 0.062
a
15.6 ± 0.5 0.9904 0.9897 0.3743
ADP 1.90 ± 0.20 – 1.75 ± 0.23 0.062
a
24.4 ± 0.7 0.9909 0.9903 0.5449
AMP 1.56 ± 1.48 – 0.94 ± 0.32 0.062
a
0.08 ± 0.02 0.9833 0.9814 0.0020
NAD 1.64 ± 0.51 – 0.94 ± 0.13 0.06 ± 0.02 27.7 ± 2.9 0.9910 0.9900 0.6533
ADH ATP 4.61 ± 0.34 – 4.02 ± 0.58 0.06 ± 0.03 7.0 ± 0.9 0.9907 0.9893 0.2227
ADP 1.45 ± 0.20 – 1.42 ± 0.16 0.06
a
28.4 ± 1.0 0.9896 0.9891 0.6720
AMP 3.43 ± 0.78 – 1.55 ± 0.30 0.06
a
23.1 ± 1.4 0.9972 0.9750 0.8892
GAPDH ATP 2.03 ± 0.36 4.16 ± 0.92 3.07 ± 0.69 0.14 ± 0.02 0.06 ± 0.00 0.9930 0.9920 0.0015
ADP 0.96 ± 0.26 5.38 ± 2.76 1.70 ± 0.39 0.14
a
0.21 ± 0.01 0.9825 0.9808 0.0091
AMP 0.27 ± 0.26 5.21 ± 5.69 0.79 ± 0.38 0.14
a
0.06 ± 0.01 0.9902 0.9888 0.0015
a
Set as a fixed value as determined in one of the other assays.
R. Cao et al. Inhibition kinetics of dehydrogenases
FEBS Journal 277 (2010) 1843–1852 ª 2010 The Authors Journal compilation ª 2010 FEBS 1845
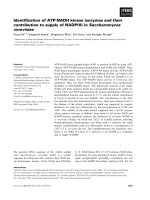
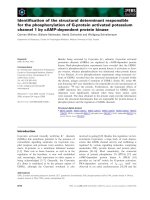
Multiple inhibition kinetics
The reduced and oxidized forms of the coenzyme [i.e.
NAD(H)], ATP and ADP are all present in significant
concentrations in the cytoplasm. Hence, they will inhi-
bit the considered dehydrogenases simultaneously. The
Yonitani–Theorell plots were used to determine the
multiple inhibition kinetics and to evaluate any inter-
actions between the inhibitors [25]. As an example, the
plots for the inhibition by ATP and ADP of LDH,
ADH and GAPDH are given (Fig. 2). Usually these
plots show linear relationships between the inhibitor
concentrations and V
0
⁄ V
i
(with V
0
and V
i
as the reac-
tion velocities in the absence and presence of the inhib-
itor, respectively) (Fig. 2A). However, a parabolic plot
emerged in the case of GAPDH, but with ADH the
parabolic profile started only at higher ATP concentra-
tions (Fig. 2B, C). Similar nonlinear plots were also
obtained with other inhibitor combinations for LDH
and ADH (Fig. S4). This nonlinearity was reflected in
the multiple inhibition models through the values of
the Hill coefficients and the interaction factor (a; Eqn
4). Thus, the multiple inhibition kinetics of all combi-
nations could be adequately described by Eqn (4) for
all three enzymes. Indeed, the multiple mixed inhibi-
tion model (Eqn 5) for GAPDH resulted in equal or
slightly better fittings, but it also resulted in large con-
fidence intervals for most of the parameters. Keeping a
fixed value for the affinity constants of the substrate
(K
M
) as determined in the single inhibitions, all
remaining parameter values were estimated by nonlin-
ear regression of Eqn (4) (Table 2, Figs S5, S6). For
LDH, the relatively high values for a make it clear
that the inhibitors are indifferent to each other at the
active site. In addition, the dissociation constants for
the inhibitors did not change dramatically (Table 2).
Hence, the LDH activity was hardly influenced by any
of the combinations of inhibitors. A similar conclusion
can be drawn for the combination of ADP + NAD
for ADH, whereas there was a slight increase in inhibi-
tion of ADH by the combination of ATP + NAD.
The combinations ATP + NADH and ADP +
NADH had a severe inhibitory effect on GAPDH, but
mainly because the dissociation constants of ATP and
ADP were decreased by $ 50%, which more than com-
pensates the concomitantly lower values of the Hill
coefficients for the strength of inhibition (Tables 1, 2).
In stark contrast, there is a synergy between ATP and
ADP (a < 1) at the active site of ADH and GAPDH,
and, in addition, the dissociation constants were lower
in the presence of the other inhibitor (Table 2). In con-
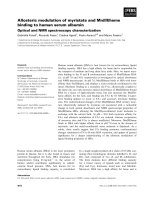
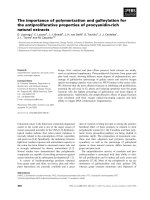
clusion, when interpreted as the pool of ATP and ADP
[using Eqn (6) and parameter values in Table 2], the
two nucleotides affected ADH most strongly (> 95%
inhibition), whereas most of the LDH activity was
maintained (30–40% inhibition) (Fig. 3A).
Multiple inhibition kinetics of eukaryotic ADH
To investigate whether the nonlinear nature of the
multiple inhibition by ATP and ADP is unique for
0
1
2
3
4
–10 –5 0 5 10
ATP (mM)
0
1
2
3
4
5
6
7
0 0.5 1 1.5 2
ATP (m
M)
A
C
0
1
2
3
4
5
6
7
8
01234
ATP (m
M)
V
o
/V
i
V
o
/V
i
V
o
/V
i
B
Fig. 2. Multiple inhibition of LDH, ADH and GAPDH by ATP and
ADP using Yonetani–Theorell plots. (A) Multiple inhibition of LDH
by ATP and ADP at different ADP concentrations (m
M): 8 (h),
6(
), 4 (D), 2 ( ), 0 (s). (B) Multiple inhibition of ADH by ATP and
ADP at different ADP concentrations (m
M): 4.5 (h), 4 ( ), 3 (D),
1.5 (
), 0 (s). (C) Multiple inhibition of GAPDH by ATP and ADP at
different ADP concentrations (m
M): 2.5 (h), 2 ( ), 1.5 (D), 1 ( ),
0.5 (s), 0 (•).
Inhibition kinetics of dehydrogenases R. Cao et al.
1846 FEBS Journal 277 (2010) 1843–1852 ª 2010 The Authors Journal compilation ª 2010 FEBS
L. lactis, two commercial eukaryotic ADHs, of horse
liver and yeast, were tested. Indeed, when plotted as
the rate versus the pool of ATP and ADP, a similar
strong nonlinear profile was found (Fig. 3B). How-
ever, in this case there was no synergy between ATP
and ADP (a >> 1, Eqn 6), but the combination of
relatively low dissociation constants and high Hill
coefficients accounted for the high nonlinearity
(Table 2).
Discussion
The inhibition kinetics of LDH, ADH and GAPDH
of L. lactis ATCC 19435 investigated might be a
result of various isozymes of each of these dehydro-
genases because of the use of cell extracts. However,
unpublished transcriptomics results with this strain
have revealed that ldh, positioned in the las-operon
(EC 1.1.1.27), gapB, coding for one of the
NAD-dependent GAPDHs (EC 1.2.1.12), and adhE,
coding for the alcohol-acetaldehyde dehydrogenase
(EC 1.2.1.10), are those that are predominantly
expressed (data not shown). ldh is expressed 37- and
14-fold higher than ldhX and ldhB, respectively; gapB
is expressed seven-fold higher than gapA; and adhE is
expressed 10-fold higher than adhA. These results are
consistent with those obtained with other lactococcal
strains [21–23]. For instance, the K
M
value of LDH
of strain ATCC 19435 for NADH (Table 1) was iden-
tical to the LDH coded by ldh (K
M
= 0.06 mm), but
not to the one coded by ldhB (K
M
= 0.2 mm), as
found in L. lactis strain NZ9000 and strain NZ9015
[21], respectively. Therefore, we conclude that the
kinetics determined herein for all three dehydrogenases
pertain to only one of their isozymes, i.e. the ones
mentioned above.
The analysis of the single inhibition with the
Cornish–Bowden plots and model discrimination
revealed that LDH and ADH of L. lactis ATCC
19435 are inhibited by all inhibitors studied in a differ-
ent manner than GAPDH. Inhibition of LDH and
ADH is competitive for ATP, ADP and AMP,
whereas inhibition of GAPDH by ATP, ADP and
AMP appeared to be mixed. However, the high disso-
ciation constants for the uncompetitive part suggest
the presence of only a weak allosteric binding site for
ATP, ADP and AMP. Having such high confidence
intervals, it is arguable whether in situ AMP inhibits
GAPDH mainly in a competitive manner. The more
complex inhibition of ADH and GAPDH by NADH
and NAD, respectively, remains unclear and was not
investigated further.
Interestingly, a parabolic inhibition of each of the
dehydrogenases was observed, which especially came
to the fore at elevated concentrations of ATP and
ADP (Fig. 2). Mathematically, this could be described
through introducing a Hill coefficient for each inhibi-
tor to the usual inhibition equations (Eqns 2, 3). In
those forms, Eqns (2, 3) fitted the data more satisfacto-
rily than the conventional parabolic model (Eqn 1),
even though the same number of parameters had to be
estimated. From the data analysis, it was understood
that with Hill coefficients a higher flexibility was intro-
duced and may be related to the multimeric nature of
the enzymes involved. The outcome supports the view
of a recently published theory that Hill-type kinetics
Table 2. Estimated parameter values with 95% confidence intervals for the multiple inhibition kinetics of LDH, ADH and GAPDH with ATP,
ADP and the cofactor product (NAD for ADH and LDH, and NADH for GAPDH) as inhibitors. Similarly, for purified horse liver and yeast
ADHs, with ATP and ADP as inhibitors.
I
1
+ I
2
Enzyme
Parameter values ± confidence intervals Goodness of fit
K
IC1
(mM) K
IC2
(mM) n1 n2 a V
MAX
R
2
Adjusted R
2
rmse
ATP +
ADP
LDH 2.53 ± 0.43 1.26 ± 0.16 1.42 ± 0.15 1.40 ± 0.10 4.53 ± 1.77 0.50 ± 0.01 0.9960 0.9951 0.00669
ADH 2.87 ± 0.30 0.72 ± 0.24 4.86 ± 1.25 1.28 ± 0.23 0.90 ± 0.48 0.04 ± 0.02 0.9869 0.9831 0.00119
GAPDH 0.76 ± 0.10 1.25 ± 0.14 1.31 ± 0.14 1.65 ± 0.19 0.83 ± 0.27 0.65 ± 0.02 0.9927 0.9911 0.0107
ATP +
NAD(H)
LDH 4.31 ± 0.40 0.65 ± 0.15 2.08 ± 0.23 0.95 ± 0.16 14.6 ± 14.5 0.32 ± 0.01 0.9893 0.9875 0.00420
ADH 3.20 ± 0.25 0.18 ± 0.05 4.79 ± 0.79 1.04 ± 0.14 3.16 ± 1.40 0.13 ± 0.00 0.9876 0.9850 0.00333
GAPDH 1.19 ± 0.21 0.07 ± 0.02 1.30 ± 0.21 0.96 ± 0.19 1.80 ± 0.98 0.70 ± 0.03 0.9834 0.9797 0.0128
ADP +
NAD(H)
LDH 2.23 ± 0.36 0.41 ± 0.12 1.66 ± 0.21 1.03 ± 0.17 36.7 ± 61.2 0.22 ± 0.01 0.9855 0.9830 0.0038
ADH 0.74 ± 0.37 0.02 ± 0.07 1.49 ± 0.41 0.57 ± 0.42 120 ± 656 0.10 ± 0.01 0.9686 0.9566 0.0036
GAPDH 1.03 ± 0.16 0.04 ± 0.01 1.34 ± 0.22 1.17 ± 0.13 2.58 ± 1.13 0.63 ± 0.02 0.9922 0.9901 0.00898
ATP +
ADP
Horse
a
1.16 ± 0.23 0.04 ± 0.11 5.66 ± 1.07 0.86 ± 0.74 – 0.50 ± 0.02 0.9987 0.9979 0.00798
Yeast
b
1.91 ± 0.23 1.48 ± 0.63 5.93 ± 1.32 1.52 ± 1.27 – 0.77 ± 0.03 0.9990 0.9984 0.00837
a
K
M
value for NADH (3.6 lM) taken from [26].
b
K
M
value for NADH (122 lM) taken from Brenda ( />result_flat.php4?ecno=1.1.1.1).
R. Cao et al. Inhibition kinetics of dehydrogenases
FEBS Journal 277 (2010) 1843–1852 ª 2010 The Authors Journal compilation ª 2010 FEBS 1847
can be used to describe allosteric inhibitor behaviour
[27]. Model discrimination demonstrated that the
Hill-type only worked for the complete and partial
competitive inhibition, indicating a nonlinear negative
co-operativity at the active site [24] as the means to
‘deactivate’ the dehydrogenases.
Inhibition of dehydrogenases by ATP or ADP is not
novel, but their role as regulators of enzymes other than
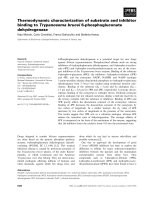
kinases remains underestimated. To compare the
strength of inhibition of ATP and ADP, the single ‘inhi-
bition term’ [defined as {1 + (I ⁄ K
I
)
n
}] was plotted
against the inhibitor concentration (Fig. 4A) using the
parameter values in Table 1. It revealed that GAPDH is
most severely inhibited by each of these inhibitors,
whereas LDH and ADH are only moderately inhibited.
In the case of multiple inhibition, the inhibitors act
indifferently at the active site of LDH. Hence, the
presence of all three inhibitors does not amplify the
inhibition of LDH, leaving this enzyme only mildly
inhibited. This can be illustrated by plotting the multi-
ple inhibition term {defined as [1 + (I
1
⁄ K
I1
)
n1
+(I
2
⁄
K
I2
)
n2
+(I
1
I
2
⁄ aK
I1
K
I2
)
n
]} against the concentration of
the pool of ATP + ADP (Fig. 4B), displaying the
same profile as for the single inhibition (Fig. 4A). For
GAPDH in general, both the Hill coefficients and the
dissociation constants were slightly lower than in the
case of separate single inhibitions, resulting in the inhi-
bition not being significantly different from the single
inhibition (compare Fig. 4A, 4B). Again, multiple inhi-
bition by ATP and ADP did not possess a stronger
regulation of GAPDH activity. In contrast, for ADH,
multiple inhibition revealed a drastic change to the sin-
gle inhibition by ATP and ADP (Fig. 4). Especially
through decreased values of the dissociation constants
and a low value of a (Table 2), ADH became more
strongly inhibited than GAPDH only at high levels of
ATP + ADP, although this was not apparent at nor-
mal levels of the ATP + ADP moiety (Fig. 4B).
0
0.25
0.5
0.75
1
0369
12 15
V
i
/V
o
V
i
/V
o
ATP + ADP pool (mM)
0
0.25
0.5
0.75
1
036
91215
ATP + ADP pool (m
M)
A
B
Fig. 3. Multiple inhibition of the lactococcal dehydrogenases and
ADH of yeast and horse liver as a function of the ATP and ADP
pool. Criterion for all data points chosen: [ATP] > [ADP]. (A) Dehy-
drogenases from Lactococcus lactis ATCC19435. LDH (D), GAPDH
(h), ADH (
). (B) Comparison of eukaryotic ADHs. Baker’s yeast
(
•), horse liver (s). The lines represent the fitted model (Eqn 6).
0
50
100
150
0246
810
Single inhibition term
Inhibitor (mM)
0
50
100
150
200
250
0246810
ATP+ADP pool (m
M)
Multiple inhibition term
A
B
Fig. 4. Comparison between the effect of the single inhibitor and
multiple inhibitors on the lactococcal dehydrogenases as expressed
by the ‘inhibition term’. (A) Effect of the single inhibitors ATP
(closed symbols) and ADP (open symbols) on LDH (
, h), ADH
(
,D), GAPDH (•, s). (B). Effect of the combined action of ATP and
ADP on LDH (
), ADH ( ), GAPDH (•).
Inhibition kinetics of dehydrogenases R. Cao et al.
1848 FEBS Journal 277 (2010) 1843–1852 ª 2010 The Authors Journal compilation ª 2010 FEBS
Hence, only at elevated levels the regulating mecha-
nism by this moiety becomes visible. In this way,
strong inhibition of ADH, but low inhibition of LDH
by the moiety guarantees a redirection of the catabolic
metabolism from mixed-acid to homolactic acid forma-
tion, as observed by Palmfeldt et al. [1]. To our knowl-
edge, this is the first time this phenomenon has been
described. A strong regulation system by ATP has
been described for GAPDH in rabbit muscle cells, but
has not been studied in depth [18]. From simulations
of in vivo conditions, the authors concluded that physi-
ological concentrations of ATP and ADP regulate the
glycolytic flux by inhibiting GAPDH by $ 90%.
ATP and ADP function as energy carriers, metabo-
lites in RNA synthesis and as allosteric regulators of
key enzymes in various pathways, and are thus ubiqui-
tous within the metabolic network [28]. Usually, ATP
and ADP are antagonistic in regulation, i.e. one func-
tions as a positive, whereas the other functions as a
negative regulator. In general, intracellular concentra-
tions of ATP and ADP in proliferating prokaryotes
and yeast are in the order of 2–5 and 1–2 mm, respec-
tively [29,30]. Most studies with respect to ATP and
ADP are carried out in exponential growing cells, e.g.
in steady-state situations of continuous cultures. Few
studies have looked into changing levels of ATP and
ADP under stress conditions, such as growth in the
presence of high sugar concentrations [31,32]. Fewer
studies have been dedicated to nongrowing cells, i.e.
stationary phase and resting cells. Those studies have
focused on ATP concentrations alone [10] or on
both ATP and ADP concentrations in, for example,
L. lactis [1,32], Escherichia coli (E. M. Lohmeier-
Vogel, personal communication) and yeast [30]. These
studies have revealed elevated levels of both com-
pounds, giving moieties up to 12–21 mm [1,32]. The
reason for this could be that the nucleotide metabolic
network in active nongrowing cells is less wide than in
growing cells, for instance because of a lack of high
RNA turnover. In such a case, completely different
mechanisms of enzyme regulation may emerge, not
normally operating in (rapidly) growing cells. The inhi-
bition kinetics of the dehydrogenases as described in
this study could be an example.
We would therefore like to propose the negative
co-operative regulation of ADH by the ATP–ADP
moiety as a new regulation mechanism in L. lactis, and
it remains to be seen whether it is more widespread in
nature. In L. lactis, this system is most probably
adapted to regulate the flux of ATP production
through strong nonlinear inhibition of ADH: by
obtaining two instead of three ATPs per sugar unit in
excess concentrations of ATP and ADP [1].
Materials and methods
Organism and cultivation conditions
Lactococcus lactis subspecies lactis (Lister) [33] deposited as
Streptococcus lactis sp. ATCC19435 was obtained from the
American Type Culture Collection (Manassas, VA, USA).
It was cultivated at 30 °C in a 1 L fermenter with a work-
ing volume of 0.7 L. The medium consisted of (gÆL
)1
): yeast
extract 5, MgSO
4
0.5, K
2
HPO
4
2.5, KH
2
PO
4
2.5 and
maltose 10. The pH was maintained at 6.5 by controlled
addition of 5 m sodium hydroxide. The cultures were stir-
red with a magnetic stirrer at a speed of 100 r.p.m. and
were kept anaerobic by flushing N
2
gas through the head-
space. The biomass was monitored by measuring the optical
density at 620 nm. At the end of the log phase, the cells
were harvested by centrifugation (6300 g, 10 min, 4 °C),
washed twice in triethanolamine (TEA) buffer (50 mm
TEA, 5 mm MgCl
2
.6H
2
O, pH 7.2) and subsequently stored
at )20 °C until further use.
Enzyme assays
The cell suspensions were mixed with glass beads
(1 : 1, v ⁄ v). Cell extracts were prepared by disintegrating
the cells using the glass bead method (6 · 30 s of vortex
with 30 s intervals of cooling on ice). Cell debris was
removed by centrifugation (15 800 g, 10 min, 4 °C). The
supernatant was collected and liberated from interfering
metabolites below 10 kDa using a PD10-desalting column
(Sigma Aldrich, St Louis, MO, USA), which was equili-
brated with 25 mL TEA buffer before use. Cell extract
(2.5 mL) was added to the column and eluted with 2 mL
TEA buffer, and subsequently kept on ice during analysis.
All assays were carried out with an Ultrospec 2100 pro
spectrophotometer (Amersham Biosciences, Little Chalfont,
UK). The buffer pH was set at 7.2 to mimic the intracellu-
lar pH conditions of L. lactis cells [34].
ADH activity was measured spectrophotometrically by
following the oxidation of NADH at 340 nm at 30 °C. The
standard assay mixture contained (in total volume of
1 mL): TEA (50 mm,5mm MgCl
2
.6H
2
O, pH 7.2), glutathi-
one (0.5 mm); NADH (0.06–0.25 mm), cell extract and one
of the four inhibitors: NAD (0–4 mm), ATP (0–10 mm),
ADP (0–8 mm), AMP (0–16 mm). The reaction was started
by adding acetaldehyde (10 mm). LDH activity was mea-
sured spectrophotometrically at 340 nm by monitoring the
oxidation of NADH at 30 °C [4,11]. The standard assay
mixture contained (total volume of 1 mL): TEA (50 mm,
5mm MgCl
2
.6H
2
O, pH 7.2), NADH (0.06–0.2 mm), cell
extract and one of the four inhibitors: NAD (0–10 mm),
ATP (0–6 mm), ADP (0–5 mm ), AMP (0–10 mm). The
reaction was started by adding sodium pyruvate (10 mm).
GAPDH activity was measured at 340 nm by monitoring
the reduction of NAD at 30 °C using a spectrophotometer.
R. Cao et al. Inhibition kinetics of dehydrogenases
FEBS Journal 277 (2010) 1843–1852 ª 2010 The Authors Journal compilation ª 2010 FEBS 1849
One millilitre of the reaction mixture contained: TEA
(50 mm,5mm MgCl
2
.6H
2
O, pH 7.2), sodium arsenate
(1 m), cysteine ⁄ HCl (1 m), cell extract and one of the fol-
lowing inhibitors: NADH (0–0.3 mm), ATP (0–4 mm),
ADP (0–4 mm), AMP (0–2 mm). The reaction was started
by adding the glyceraldehyde-3-phosphate (10 mm) [35].
The assays for yeast and horse liver ADH (EC 1.1.1.1) and
multiple inhibition analysis were performed similarly as
above. Three concentrations of cell extract were used for
each assay to test the linearity of the initial enzyme activi-
ties with the protein concentration. All assays were based
on determining the initial conversion rates. The baseline
was corrected for any background activity, measured for
several minutes before adding the substrate to start the
assay. The linearity of the assay was monitored over time
by applying the standard assay (= complete assay without
inhibitors) every 0.5 h. Any activity loss of the cell extract
was corrected for. The majority of the inhibition datasets
were carried out in duplicate, resulting in the same inhibi-
tion trends. The most elaborate datasets were chosen for
fitting the models, the remaining duplicate datasets were
used to validate the model (data not shown). Datasets for
each case of single and multiple inhibition therefore con-
sisted of measured inhibition trends instead of duplicates.
All chemicals and enzymes were obtained from Sigma
Aldrich.
Data analysis
To visualize the effect of the competitive inhibitor concen-
tration on the conversion rate, the data were plotted as rate
(v) versus substrate concentration (S) for each inhibitor
concentration (I) to which, for this study, a Hill-type inhibi-
tion has been introduced:
v ¼
V
MAX
Á S
K
M
Áð1 þ
I
n
K
n
IC
ÞþS
ð2Þ
in which V
MAX
is the maximum rate of the reaction, K
IC
is
the dissociation constant for inhibitor I, K
M
is the affinity
constant for NADH and n is the Hill coefficient. Similarly,
the mixed inhibition kinetics can be expressed as:
v ¼
V
MAX
Á S
K
M
Á 1 þ
I
n
K
n
IC
þ S Áð1 þ
I
K
IU
Þ
ð3Þ
with K
IC
as the dissociation constant at the active site (com-
petitive inhibition) and K
IU
as the dissociation constant at
the allosteric site (uncompetitive inhibition).
Multiple competitive inhibition could best be expressed
by:
v ¼
V
MAX
Á S
K
M
Áð1 þ
I
n1
1
K
n1
IC1
þ
I
n2
2
K
n2
IC2
þ
I
n1
1
Á I
n2
2
a Á K
n1
IC1
Á K
n2
IC2
ÞþS
ð4Þ
with the competitive inhibitors I
1
and I
2
, their respec-
tive dissociation constants K
IC1
and K
IC2
and their
respective Hill coefficients n1 and n2, and a as an inter-
action constant. In this way, the model describes the con-
comitant inhibition kinetics of each inhibitor plus the
synergy (0 < a < 1), or indifference (a > 1) (Fig. S7)
between the inhibition actions of both inhibitors at the
active site.
When dealing with mixed inhibition, Eqn (4) becomes:
with K
IU1
and K
IU2
as the dissociation constants at the allo-
steric site (uncompetitive inhibition) and b as the mutual
influence of the two inhibitors on the binding of each other
at the allosteric site.
Plotting the multiple competitive inhibition kinetics as
the normalized rates (V
i
⁄ V
0
) versus inhibitor concentration
is the inverse of the Yonetani–Theorell equation [25]:
V
i
V
0
¼
1
1 þ
I
n1
1
K
AC1
þ
I
n2
2
K
AC2
þ
I
n1
1
Á I
n2
2
a Á K
n1
IC1
Á K
n2
IC2
Áð1 þ
S
K
M
Þ
ð6Þ
in which V
i
and V
0
are the actual rates with and without
the inhibitor, respectively, and K
AC1
[= K
IC1
n1
(1 + S ⁄ K
M
)) and K
AC2
(= K
IC2
n2
(1 + S ⁄ K
M
)] are the
apparent dissociation constants for the competitive inhibi-
tors I
1
and I
2
, respectively.
Data fitting and statistical analysis
Parameter estimation and statistical analysis were carried
out using the Surface Fitting Tool (sftool)inmatlab
(R2009a). The parametric data fitting was based on non-
linear regression and the method of least squares. Model
discrimination and choice was based on the goodness of
fit. The goodness of fit was evaluated by visual examina-
tion of the fitted curves, 95% confidence bounds for the
fitted coefficients and statistical analysis for determining
the square of the multiple correlation coefficient (R
2
), the
degrees of freedom adjusted R
2
(adjusted R
2
) and rmse.
The combination of smaller confidence bounds, values
of R
2
and adjusted R
2
closer to 1 and an rmse value
v ¼
V
MAX
Á S
K
M
Áð1 þ
I
n1
1
K
n1
IC1
þ
I
n2
2
K
n2
IC2
þ
I
n1
1
Á I
n2
2
a ÁK
n1
IC1
Á K
n2
IC2
ÞþS Á 1 þ
I
1
K
IU1
þ
I
2
K
IU2
þ
I
1
Á I
2
b ÁK
IU1
Á K
IU2
ð5Þ
Inhibition kinetics of dehydrogenases R. Cao et al.
1850 FEBS Journal 277 (2010) 1843–1852 ª 2010 The Authors Journal compilation ª 2010 FEBS
closer to 0 was used as the criterion for indicating a
better fit.
Acknowledgement
This study was financially supported by the Swedish
Research Council for Environment, Agricultural
Sciences and Spatial Planning.
References
1 Palmfeldt J, Paese M, Hahn-Ha
¨
gerdal B & Van Niel
EWJ (2004) The pool of ADP and ATP regulates
anaerobic product formation in resting cells of Lacto-
coccus lactis. Appl Environ Microbiol 70, 5477–5484.
2 Thomas TD, Ellwood DC & Longyear VM (1979)
Change from homo- to heterolactic fermentation by
Streptococcus lactis resulting from glucose limitation
in anaerobic chemostat cultures. J Bacteriol 138,
109–117.
3 Takahashi N, Abbe K, Takahashi-Abbe S & Yamada T
(1987) Oxygen sensitivity of sugar metabolism and
interconversion of pyruvate formate-lyase in intact cells
of Streptococcus mutans and Streptococcus sanguis.
Infect Immun 55, 652–656.
4 Crow VL & Pritchard GG (1977) Fructose 1,6-diphos-
phate-activated l-lactate dehydrogenase from Strepto-
coccus lactis: kinetic properties and factors affecting
activation. J Bacteriol 131, 82–91.
5 Thomas TD, Turner KW & Crow VL (1980) Galactose
fermentation by Streptococcus lactis and Streptococ-
cus cremoris: pathways, products, and regulation.
J Bacteriol 144, 672–682.
6 Lohmeier-Vogel EM, Hahn-Ha
¨
gerdal B & Vogel HJ
(1995) Phosphorus-31 and carbon-13 nuclear magnetic
resonance studies of glucose and xylose metabolism in
Candida tropicalis cell suspensions. Appl Environ
Microbiol 61, 1414–1419.
7 Levander F, Andersson U & Ra
˚
dstro
¨
m P (2001)
Physiological role of b-phosphoglucomutase in
Lactococcus lactis. Appl Environ Microbiol 67,
4546–4553.
8 Martinez-Irujo JJ, Villahermosa ML, Mercapide J,
Cabodevilla JF & Santiago E (1998) Analysis of the
combined effect of two linear inhibitors on a single
enzyme. Biochem J 329, 689–698.
9 Cocaign-Bousquet M, Garrigues C, Loubiere P &
Lindley ND (1996) Physiology of pyruvate metabolism
in Lactococcus lactis. Antonie Van Leeuwenhoek 70,
253–267.
10 Neves AR, Ventura R, Mansour N, Shearman C,
Gasson MJ, Maycock C, Ramos A & Santos H (2002)
Is the glycolytic flux in Lactococcus lactis primarily
controlled by the redox charge? Kinetics of NAD(+)
and NADH pools determined in vivo by 13C NMR.
J Biol Chem 277, 28088–28098.
11 Garrigues C, Loubiere P, Lindley ND & Cocaign-
Bousquet M (1997) Control of the shift from homo-
lactic acid to mixed-acid fermentation in Lactococcus
lactis: predominant role of the NADH ⁄ NAD
+
ratio.
J Bacteriol 179, 5282–5287.
12 Wouters JA, Kamphuis HH, Hugenholtz J, Kuipers
OP, de Vos WM & Abee T (2000) Changes in glycolytic
activity of Lactococcus lactis induced by low tempera-
ture. Appl Environ Microbiol 66, 3686–3691.
13 Wang CS & Alaupovic P (1980) Glyceraldehyde-3-phos-
phate dehydrogenase from human erythrocyte mem-
branes. Kinetic mechanism and competitive substrate
inhibition by glyceraldehyde 3-phosphate. Arch Biochem
Biophys 205, 136–145.
14 Wittenberger CL (1968) Kinetic studies on the inhibi-
tion of a D(-)-specific lactate dehydrogenase by adeno-
sine triphosphate. J Biol Chem 243, 3067–3075.
15 Brunner NA, Brinkmann H, Siebers B & Hensel R
(1998) NAD
+
-dependent glyceraldehyde-3-phosphate
dehydrogenase from Thermoproteus tenax. The first
identified archaeal member of the aldehyde dehydroge-
nase superfamily is a glycolytic enzyme with unusual
regulatory properties. J Biol Chem 273, 6149–6156.
16 Avigad G (1966) Inhibition of glucose 6-phosphate
dehydrogenase by adenosine 5¢-triphosphate. Proc Natl
Acad Sci USA 56, 1543–1547.
17 Nakamura M, Fujiwara A, Yasumasu I, Okinaga S &
Arai K (1982) Regulation of glucose metabolism by
adenine nucleotides in round spermatids from rat testes.
J Biol Chem 257, 13945–13950.
18 Oguchi M, Meriwether BP & Park JH (1973) Interac-
tion between adenosine triphosphate and glyceraldehyde
3-phosphate dehydrogenase 3. Mechanism of action and
metabolic control of the enzyme under simulated in
vivo conditions. J Biol Chem 248, 5562–5570.
19 Teusink B, Passarge J, Reijenga CA, Esgalhado E, van
der Weijden CC, Schepper M, Walsh MC, Bakker BM,
van Dam K, Westerhoff HV et al. (2000) Can yeast
glycolysis be understood in terms of in vitro kinetics of
the constituent enzymes? Testing biochemistry.
Eur J Biochem 267, 5313–5329.
20 Bolotin A, Wincker P, Mauger S, Jaillon O, Malarme
K, Weissenbach J, Ehrlich SD & Sorokin A (2001) The
complete genome sequence of the lactic acid bacterium
Lactococcus lactis ssp. lactis IL1403. Genome Res 11,
731–753.
21 Bongers RS, Hoefnagel MHN, Starrenburg MJC,
Siemerink MAJ, Arends JGA, Hugenholtz J &
Kleerebezem M (2003) IS981-mediated adaptive
evolution recovers lactate production by ldhB transcrip-
tion activation in a lactate dehydrogenase-deficient
strain of Lactococcus lactis. J Bacteriol 185 , 4499–4507.
R. Cao et al. Inhibition kinetics of dehydrogenases
FEBS Journal 277 (2010) 1843–1852 ª 2010 The Authors Journal compilation ª 2010 FEBS 1851
22 Willemoe
¨
s M, Kilstrup M, Roepstorff P & Hammer K
(2002) Proteome analysis of a Lactococcus lactis strain
overexpressing gapA suggests that the gene product is
an auxiliary glyceraldehyde 3-phosphate dehydrogenase.
Proteomics 2, 1040–1046.
23 Arnau J, Jørgensen F, Madsen SM, Vrang A &
Israelsen H (1998) Cloning of the Lactococcus lactis
adhE gene, encoding a multifunctional alcohol
dehydrogenase, by complementation of a fermentative
mutant of Escherichia coli. J Bacteriol 180, 3049–3055.
24 Leskovac V (2004) Comprehensive Enzyme Kinetics .
Kluwer, New York, p. 106.
25 Yonetani T & Theorell H (1964) Studies on liver alco-
hol hydrogenase complexes. 3. Multiple inhibition kinet-
ics in the presence of two competitive inhibitors. Arch
Biochem Biophys 106, 243–251.
26 Ryzewski CN & Pietruszko R (1977) Horse liver alco-
hol dehydrogenase SS: purification and characterization
of the homogenous isozyme. Arch Biochem Biophys 183,
73–82.
27 Hanekom AJ, Hofmeyr JH, Snoep JL & Rohwer JM
(2006) Experimental evidence for allosteric modifier sat-
uration as predicted by the bi-substrate Hill equation.
Syst Biol (Stevenage) 153, 342–345.
28 Fell DA & Wagner A (2000) The small world of metab-
olism. Nat Biotechnol 18, 1121–1122.
29 Albe KR, Butler MH & Wright BE (1990) Cellular con-
centrations of enzymes and their substrates. J Theor
Biol 143, 163–195.
30 Pahlman IL, Gustafsson L, Rigoulet M & Larsson C
(2001) Cytosolic redox metabolism in aerobic chemostat
cultures of Saccharomyces cerevisiae. Yeast 18, 611–620.
31 Meyer CL & Papoutsakis ET (1989) Increased levels of
ATP and NADH are associated with increased solvent
production in continuous cultures of Clostridium acet-
obutylicum. Appl Microbiol Biotechnol 30, 450–459.
32 Papagianni M, Avramidis N & Filiousis G (2007)
Glycolysis and the regulation of glucose transport in
Lactococcus lactis spp. lactis in batch and fed-batch
culture. Microb Cell Fact 6, 16.
33 Schleifer KH, Kraus J, Dvorak C, Kilpper-Ba
¨
lz R,
Collins MD & Fischer W (1985) Transfer of
Streptococcus lactis and related streptococci to the
genus Lactococcus gen. nov. Syst Appl Microbiol 6,
183–195.
34 Poolman B, Bosman B, Kiers J & Konings WN
(1987) Control of glycolysis by glyceraldehyde-3-phos-
phate dehydrogenase in Streptococcus cremoris
and Streptococcus lactis. J Bacteriol 169, 5887–
5890.
35 Even S, Garrigues C, Loubiere P, Lindley ND &
Cocaign-Bousquet M (1999) Pyruvate metabolism in
Lactococcus lactis is dependent upon glyceraldehyde-3-
phosphate dehydrogenase activity. Metab Eng 1,
198–205.
Supporting information
The following supplementary material is available:
Fig. S1. Cornish–Bowden plots of the single inhibition
kinetics.
Fig. S2. A three-dimensional plot of fitting Eqn (2)
through the complete dataset.
Fig. S3. Two-dimensional plots of fitting Eqn (2) or
(3) through the complete datasets.
Fig. S4. Yonetani–Theorell plots of the multiple inhibi-
tion kinetics.
Fig. S5. A three-dimensional plot of fitting Eqn (4)
through the complete dataset.
Fig. S6. Two-dimensional plots of fitting Eqn (4)
through the complete datasets.
Fig. S7. Evaluation of the effect of the interaction fac-
tor (a) on the strength of inhibition.
This supplementary material can be found in the
online version of this article.
Please note: As a service to our authors and readers,
this journal provides supporting information supplied
by the authors. Such materials are peer-reviewed and
may be re-organized for online delivery, but are not
copy-edited or typeset. Technical support issues arising
from supporting information (other than missing files)
should be addressed to the authors.
Inhibition kinetics of dehydrogenases R. Cao et al.
1852 FEBS Journal 277 (2010) 1843–1852 ª 2010 The Authors Journal compilation ª 2010 FEBS