The Distributional Effects of Asset Purchases Bank of England, 12 July 2012 pdf
Bạn đang xem bản rút gọn của tài liệu. Xem và tải ngay bản đầy đủ của tài liệu tại đây (253.71 KB, 22 trang )
1
The Distributional Effects of Asset Purchases
Bank of England, 12 July 2012
Summary
The MPC sets monetary policy for the economy as a whole in order to achieve the Government’s
inflation target. Changes in interest rates and asset purchases financed by issuing reserves (QE)
unavoidably have distributional implications.
Without the Bank’s asset purchases, most people in the United Kingdom would have been worse
off. Economic growth would have been lower. Unemployment would have been higher. Many
more companies would have gone out of business. This would have had a significant detrimental
impact on savers and pensioners along with every other group in our society. All assessments of
the effect of asset purchases must be seen in that light.
The Bank’s asset purchases have been almost entirely of gilts, causing the price of gilts to rise and
yields to fall. But this in turn has led to an increase in demand for other assets, including corporate
bonds and equities. As a result, the Bank’s asset purchases have increased the prices of a wide
range of assets, not just gilts. In fact, the Bank’s assessment is that asset purchases have pushed up
the price of equities by at least as much as they have pushed up the price of gilts.
The implications of QE for savers
Changes in Bank Rate – not asset purchases – have been the dominant influence on the interest
households receive on bank deposits and pay on bank loans.
By pushing up a range of asset prices, asset purchases have boosted the value of households’
financial wealth held outside pension funds, but holdings are heavily skewed with the top 5% of
households holding 40% of these assets.
The implications of QE for pension funds and pensioners
The pension income of those already in receipt of a pension before asset purchases began has not
been affected by QE.
Defined benefit pension schemes
The retirement incomes of people coming up to retirement in a defined benefit pension scheme
have not been affected by QE.
2
When assessing the impact of QE on the value of defined benefit pension funds, it is important to
remember that asset purchases increase the value of a pension fund’s assets as well as its liabilities.
For a typical fully-funded pension scheme, asset purchases are likely to have had a broadly neutral
impact on the net value of the scheme. The fall in gilt yields raised the value of the pension fund’s
liabilities. But the associated increase in bond and equity prices raised the value of their assets by
a similar amount.
For a defined benefit pension scheme in substantial deficit, asset purchases are likely to have
increased the size of the deficit. That is because although QE raised the value of the assets and
liabilities by a similar proportion, that nonetheless implies a widening in the gap between the two.
The burden of these deficits is likely to fall on employers and future employees, rather than those
coming up for retirement now.
Other pension schemes
Asset purchases are likely to have had a broadly neutral impact on the value of the annuity income
that could be purchased with a personal pension pot. By pushing down gilt yields, QE has reduced
the annuity rate. But the flipside of that fall in yields has been a rise in the price of both bonds and
equities held in those pension pots. Another way of explaining this is that the income flows from a
pension pot (dividends in the case of equities and coupons in the case of bonds) will not be reduced
by QE. Indeed, if the pension pot contains equities, then the flows could even be higher as a result
of increased dividend payments from the boost to the wider economy from QE.
Over the past five years, the main factor driving both the widening of deficits in defined benefit
schemes and the decline in the annuity income that can be purchased from other pension funds has
been the fall in equity prices relative to gilt prices. This fall in the relative price of equities was not
caused by QE. It happened in all the major economies, much of it occurred prior to the start of
asset purchases, and stemmed in large part from the reluctance of investors to hold risky assets,
such as equities, given the deterioration in the economic outlook, almost certainly as a result of the
financial crisis. Indeed, by boosting the economy, monetary policy actions in the United Kingdom
and overseas probably dampened this effect.
3
1 In their report on the 2012 Budget, the Treasury Committee highlighted the redistributive
impact of monetary policy, and asked the Bank, and MPC members in particular, to improve
their efforts to explain the costs and benefits of their policy actions to groups that are perceived
to have been particularly badly affected.
1
This report forms part of the Bank’s response.
2
Introduction
2 The MPC’s objective is to maintain price stability, where stable prices are defined by the
Government’s inflation target, which is currently 2% as measured by the annual change in the
CPI. Subject to that, the MPC is also tasked with supporting the Government’s other economic
objectives, including those for growth and employment. In pursuing its objectives, the MPC
sets monetary policy for the economy as a whole.
3 Changes in the monetary policy stance will unavoidably have distributional implications. That
is the case regardless of the instrument used to implement policy. Such distributional effects
typically balance out over the course of a policy cycle: some groups benefit relative to others
as interest rates are increased, but that is reversed as interest rates are lowered.
4 In response to the severe global financial crisis and the subsequent deep and prolonged
recession, UK monetary policy has, however, been exceptionally accommodative for an
unusually long time. Bank Rate has been at an historic low of 0.5% since March 2009. And
since then, the MPC has authorised the purchase of £375 billion of assets, financed by the
issuance of central bank reserves, through its asset purchase programme. The Bank’s asset
purchases, commonly referred to as quantitative easing (QE), have depressed longer-term
yields. Consequently, some groups have borne a greater burden than usual from the sustained
period of low interest rates. But, on the other hand, the benefits have also been greater than
usual, by helping to avoid a far worse outcome for the economy as a whole.
5 This report sets out the distributional effects of QE, drawing out the parallels with the
distributional effects of a low level of Bank Rate. The first section of this paper discusses the
aims of QE and how it affects the economy. The second section discusses the impact that QE
is estimated to have had on the economy in aggregate. The third and fourth sections set out the
economic channels through which QE leads to distributional effects for savers and pensioners
respectively, and provides a rough quantification of the direct financial implications of QE for
these groups. A final section concludes.
__________________________________________________________________________________
1
See: www.publications.parliament.uk/pa/cm201012/cmselect/cmtreasy/1910/191002.htm
2
For recent comments by MPC members on this topic, see, for example, Bean (2012) and Miles (2012).
4
Section 1: How quantitative easing affects financial markets and the real economy
6 The MPC began QE in March 2009 following the intensification of the financial crisis after the
collapse of Lehman Brothers and the associated sharp contraction in output. The MPC had
reduced interest rates sharply, with reductions of 3 percentage points in Bank Rate during 2008
Q4 and a further 1½ percentage points in early 2009, such that by early March 2009, Bank Rate
had been reduced to 0.5%. But, despite this substantial relaxation of policy, the MPC judged
that, without additional monetary easing, nominal spending would be too weak to meet the 2%
CPI inflation target in the medium term. The aim of QE was, therefore, to ease monetary
conditions further in order to boost nominal spending and thus help to achieve the inflation
target. The MPC completed £200 billion of asset purchases between March 2009 and January
2010, and a further £125 billion of purchases between October 2011 and May 2012. At its July
2012 meeting, the Committee voted to increase the size of its asset purchase programme by a
further £50 billion to a total of £375 billion, which is expected to take four months to complete.
The analysis in this paper focuses on the effects of the £325 billion of asset purchases that the
Bank has already completed.
7 There are a number of potential channels through which such asset purchases affect spending
and inflation.
3
Purchases of financial assets – which in the United Kingdom have largely been
UK government debt (gilts)
4
– from the non-bank private sector financed by the issuance of
central bank money increased private sector broad money holdings. In turn, that affected a
wide range of asset prices through three main channels. The first is through portfolio balance
effects. When the central bank purchases gilts, the monetary deposits of the sellers are
increased. Unless that money is regarded as a perfect substitute for the gilts sold, the sellers
will seek to rebalance their portfolios by buying other assets that are better substitutes for the
gilts that they have sold. That shifts the excess money balances to the sellers of those assets
who will, in turn, attempt to rebalance their portfolios by buying other assets – and so on. That
process will raise the prices of all assets to the point where investors, in aggregate, willingly
hold the overall supplies of assets and money. Higher asset prices mean lower yields, and so
lower borrowing costs for companies and households, which acts to stimulate spending.
5
In
addition, higher asset prices stimulate spending by increasing the net wealth of asset holders.
8 The second channel is through policy signalling effects. This channel includes anything that
market participants conclude about the likely path of future monetary policy from the MPC’s
asset purchases. For example, QE may have led market participants to expect policy rates to
remain low for longer than would otherwise have been the case.
__________________________________________________________________________________
3
For more details, see Benford et al (2009) and Joyce et al (2011).
4
A key reason for concentrating purchases on gilts was that the gilt market was judged to be deep and liquid enough to
accommodate the volume of purchases thought necessary.
5
The first stage of this process is that companies respond to higher equity and bond prices by increasing their use of capital
markets to raise funds. There was some evidence of that in 2009, with both net equity and corporate bond issuance by UK
private non-financial corporations particularly strong relative to the 2003-08 period.
5
9 The third channel is through liquidity effects. When financial markets are dysfunctional,
central bank asset purchases can improve market functioning by increasing market liquidity
through actively encouraging trading. Asset prices may consequently increase as a result of
lower illiquidity premia.
10 In addition to these asset price channels, QE may also have a stimulatory impact through its
broader effects on expectations. To the extent that QE leads to an improved economic outlook,
it may directly boost consumer confidence, and thus people’s willingness to spend. Some of
this more general improvement in confidence may also be reflected back in higher asset prices,
especially by reducing risk premia.
6
Section 2: The impact of QE in aggregate
11 Previous Bank analysis has sought to quantify the impact of QE on the economy in aggregate.
Joyce et al (2011) present a range of estimates of the macroeconomic impact of QE using a
number of different methodologies. None of the methods used fully capture all the
transmission channels discussed above. The effects of QE nevertheless appear economically
significant, though subject to considerable uncertainty. According to the reported estimates of
the peak impact, the £200 billion of QE between March 2009 and January 2010 is likely to
have raised the level of real GDP by 1½ to 2% relative to what might otherwise have
happened, and increased annual CPI inflation by ¾ to 1½ percentage points. Assuming that the
additional £125 billion of purchases made between October 2011 and May 2012 had the same
proportionate impact, this would translate into an impact from the £325 billion of completed
purchases to date of roughly £500-£800 per person in aggregate. For comparison, a simple
ready-reckoner from the primary forecasting model used by the Bank of England suggests that
a cut in Bank Rate of between 250 and 500 basis points would have been required to achieve
the same effect. This suggests that, in the absence of QE, the UK recession would have been
even deeper. Moreover, these calculations do not explicitly incorporate impacts of QE
operating through the exchange rate and confidence.
12 Of course, these figures do not translate into extra cash for each individual in the economy.
One reason is because they are an attempt to gauge the impact of QE relative to what would
otherwise have happened, so the benefits might show up as smaller falls in wages than
employees would otherwise have experienced, and lower job losses. In addition, there will
have been distributional consequences, with some groups being affected more than others. The
remainder of this note explores the particular implications of QE for savers and pensioners.
__________________________________________________________________________________
6
Other channels include the effects of QE on bank lending. When assets are purchased from non-banks (either directly or
indirectly via intermediate transactions), the banking sector gains both new reserves at the Bank of England and a
corresponding increase in customer deposits. A higher level of liquid assets could then encourage banks to extend more
new loans than they otherwise would have done. But, given the strains in the financial system at the time and the resultant
pressures on banks to reduce the size of their balance sheets, the MPC expected little impact through this channel when it
first started its asset purchase programme.
6
13 When considering these distributional impacts, however, it is important to remember that
without the Bank’s asset purchases, most people in the United Kingdom would have been
worse off. Economic growth would have been lower. Unemployment would have been
higher. More companies would have gone out of business. That would have had a detrimental
impact on savers and pensioners along with every other group in our society. All assessments
of the effect of asset purchases must be seen in that light.
Section 3: The implications of QE for savers
14 ‘Savers’ can be defined in several different ways, and the impact of QE will vary depending on
the group that is considered. One definition is households who have a higher value of financial
assets than financial liabilities (eg debt): put another way, savers are those with positive net
financial assets.
7
Another commonly used definition of savers is households that have any
gross savings, even if their debt is larger than their assets (ie they have negative net financial
assets). Households may think of themselves as savers if they regularly save money out of
their income, even if their net financial assets are negative. In this section, we use this wider
definition, and focus on the impact of QE on those with gross financial assets.
8
Limited data
are available on the number of savers in the economy, but data from the 2011 NMG survey
suggest that around 80% of households typically have some gross savings, although not all will
yield interest.
15 The calculations in this section relate to the impact of QE on savers in terms of direct financial
flows. They are therefore partial, and omit wider impacts of QE on savers. For instance, in the
absence of QE, savers may have been more likely to lose their jobs, or seen companies that
they owned go out of business. In addition, they do not take account of the impact of QE on
inflation, and hence how these financial flows translate into real spending on goods and
services. Other things being equal, increased inflation as a result of QE reduced the volume of
goods and services that a household could purchase with a fixed amount of money spending.
There are likely to be distributional consequences of that higher inflation.
9
16 Monetary policy affects households in a number of ways.
10
First, looser monetary policy
pushes down the nominal interest rates paid on the stock of deposits and loans. That reduces
both the interest income savers receive on their savings and the interest payments made by
debtors (what is sometimes called an ‘income effect’). There is also an additional ‘substitution
effect’, as lower interest rates encourage households to bring forward spending at the expense
__________________________________________________________________________________
7
For many households, however, their mortgage is the largest component of their financial liabilities, so for them, the
relevant asset concept may include housing wealth, as well as financial assets.
8
Detailed information on the composition and distribution of household net financial assets are not readily available.
9
See Galli and van der Hoeven (2001) for a review of the empirical literature on the complex distributional effects of
inflation.
10
For a fuller account of the transmission mechanism of monetary policy, see:
www.bankofengland.co.uk/publications/Documents/other/monetary/montrans.pdf.
7
of saving. Looser monetary policy also typically pushes up asset prices (sometimes referred to
as the ‘wealth effect’), so those households with significant asset holdings will benefit by more
than those without. There will also be an effect on the exchange rate, which would be expected
to depreciate, raising the price of imported goods and services and reducing the price of
exports. All of these channels would tend to raise spending in the economy in the near term.
The income and wealth channels, in particular, will give rise to important distributional effects
on savers. These effects would operate for changes in both Bank Rate and QE. But the
strength of these channels is likely to vary across the two policy instruments.
17 One difference between the transmission channels of Bank Rate and QE to spending and
inflation is that a change in Bank Rate acts largely by affecting short-term market interest rates,
while QE acts largely through longer-term interest rates.
11
Households can hold their savings
directly or indirectly, for instance via a pension fund. The majority of households’ direct
savings are held as deposits in banks and building societies, and generally in forms that are
easily accessible: over the past year, around 55% of the stock of deposits was held in relatively
short-term accounts (sight and non-interest bearing deposits), with the remainder being time
deposits. And only around 10% was in accounts with interest rates fixed for more than two
years. As a consequence, households tend to receive a return linked to short-term rather than
long-term interest rates. That suggests that deposit holders are likely to have been affected
much more by the cuts in Bank Rate than by downward pressure on longer-term interest rates
as a result of QE.
18 Reduced interest rates have depressed the aggregate interest payments received by households
on deposits. Lower interest receipts on deposits compared with September 2008 levels
cumulated to a total of around £70 billion by April 2012 (Table 1). By contrast, the household
sector may have benefited by around £100 billion by having to pay less on outstanding loans.
The gap between interest paid on deposits and interest received on loans over the period would
have been absorbed in the first instance by the banking sector, but ultimately that would have
resulted in lower profits and hence potentially lower dividends or remuneration, or in higher
banking costs and fees. Either way, much of that would feed back eventually to household
incomes.
__________________________________________________________________________________
11
The bulk of the gilts purchased during the QE period have maturities of between 5 and 25 years.
8
19 These estimates are likely to represent a lower bound on the impact that monetary policy has
had on interest flows, however, as other factors have tended to raise deposit rates over the past
few years. Bank Rate was cut by 450 basis points between September 2008 and March 2009,
and has remained at 0.5% since then. But effective rates on the stock of sight and time deposits
were only around 200 basis points lower in April 2012 than in September 2008 (Chart 1). In
part, that is likely to reflect the zero lower bound on nominal interest rates: sight deposit rates
tended to be significantly below Bank Rate before the crisis, so banks were not able to reduce
deposit rates by as much as the fall in Bank Rate. Deposit rates have drifted up since mid-
2009, despite Bank Rate remaining flat at 0.5%. In part, that may reflect banks competing
more aggressively for deposits as part of a wider strategy to reduce their reliance on wholesale
market funding. Without these factors, deposit rates received by households are likely to have
been even lower.
Table 1 Estimated impact of changes in interest rates since September 2008
(a)
Source: Bank of England and Bank calculations.
(a) Latest data are for April 2012. In estimating the effect on interest payments and receipts, the calculations assume that
the stocks of loans and deposits were as actually occurred. In practice, the stock of deposits and loans are likely to have
been higher if interest rates had remained at 2008 levels.
Change in
effective
interest
rates (bp)
Effect on income
from change in
interest payments
(£bn)
Memo: Bank Rate -450
Deposits -70.0
o/w Sight -206 -37.4
Time -218 -32.6
Secured lending 94.4
o/w Floating rate -312 89.1
Fixed rate -102 5.9
Unsecured lending 7.9
o/w Credit cards -116 0.7
Overdrafts 3 1.2
Personal loans
-109 6.1
Total 32.3
9
Chart 1 Household deposit rates and Bank Rate
(a)
(a) Monthly average of UK resident monetary financial
institutions’ effective interest rates on the stock of
outstanding deposits.
Chart 2 Equity prices and corporate bond yields
Sources: Bank of America/Merrill Lynch and Thomson Reuters
Datastream.
(a) Non-financial companies (excluding utility companies)
sterling investment grade corporate bond yield.
20 There will have been differences in experiences across households too. For example, savers
with floating rate products were affected soon after the cuts in Bank Rate, with their rates
falling from around 3% in September 2008 to under 1% by February 2009 (the green line in
Chart 1). In contrast, households with savings in fixed-rate products and accounts would not
have been affected until later. Moreover, around 10% of the stock of deposits pay no interest
at all. Similarly, there will have been different experiences amongst debtors.
21 One channel through which expansionary monetary policy will have benefited some
individuals is by raising asset prices, including government and corporate bonds, and equities
(Chart 2 shows movements in equity prices and corporate bond yields). Moreover, by
supporting activity, QE will also have boosted dividend payments and reduced corporate
defaults (raising the returns on corporate bonds). So the larger the share of these types of
assets in households’ portfolios, the greater the boost from QE relative to reduced interest
payments on money held in the form of deposits. QE may also have supported non-financial
asset prices. For example, to the extent that QE prevented a deeper recession and a sharper fall
in employment, the fall in house prices during the crisis is likely to have been smaller than
would otherwise have been the case.
0
1
2
3
4
5
6
2008
2009
2010
2011
2012
Sight deposit
Time deposit
Bank Rate
Per cent
0
1
2
3
4
5
6
7
8
9
40
50
60
70
80
90
100
110
2007 2008 2009 2010 2011 2012
FTSE All-share (right-hand scale)
Corporate bond yield(a) (left-hand scale)
Index: 2 January
2007=100
Per cent
10
22 The overall impact of QE on household wealth is likely to have been substantial. Joyce et al
suggest that the £200 billion of asset purchases made between March 2009 and January 2010
lowered gilt yields by around 100 basis points. The effect on a wider range of financial asset
prices is more uncertain. Taking into account the estimated composition of household net
financial assets, their analysis suggests an overall boost to UK households’ net financial wealth
(which includes pension wealth) of about 16%. Assuming that the £125 billion of asset
purchases made between October 2011 and May 2012 had the same proportionate impact as
the first round of asset purchases, that would give an estimate of the total increase in household
wealth stemming from the Bank’s £325 billion of asset purchases up to May 2012 of just over
£600 billion, equivalent to around £10,000 per person if assets were evenly distributed across
the population.
23 In practice, the benefits from these wealth effects will accrue to those households holding most
financial assets. Evidence from the 2011 survey by NMG Financial Services Consulting,
12
carried out on behalf of the Bank, suggests that close to 80% of financial assets (excluding
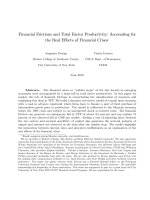
pension wealth, but including deposits) are held by those above the age of 45 (Chart 3).
13
And
the survey suggested that the median household held only around £1,500 of gross assets, while
__________________________________________________________________________________
12
For a detailed discussion on the results of this survey, see Kamath et al (2011). Analysis of the survey data has
suggested that households tend to underreport the value of the assets, but that issue ought not to affect the distribution of
assets across households.
13
By contrast, financial liabilities are less skewed towards older groups, with only around 30% of liabilities held by those
aged over 45. Those aged 35-44 have the largest liabilities, at around 45%.
Chart 3 Distribution of household financial assets
by age group
(a)
Chart 4 Distribution of household financial
assets
(a)
Sources: NMG consulting survey 2011 and Bank calculations.
(a) Respondents to the NMG survey are asked: ‘How much
do you (or any member of your household) currently have in
total, saved up in savings and investments? Include bank
/building society savings accounts or bonds, stock and shares,
ISAs, Child Trust Funds, NS&I account/bonds and premium
bonds. Please exclude any pensions you may have.’
Sources: NMG consulting survey 2011 and Bank
calculations.
(a) See footnote to Chart 3 for details of the question
asked.
0
5
10
15
20
25
30
35
18-24
25-34
35-44
45-54
55-64
65+
Age
Percentages of household
financial assets
0
20,000
40,000
60,000
80,000
100,000
120,000
140,000
160,000
180,000
200,000
5
10
15
20
25
30
35
40
45
50
55
60
65
70
75
80
85
90
95
£
Percentile of households
Median
household
11
the top 5% of households held an average of £175,000 of gross assets (Chart 4), or around 40%
of the financial assets of the household sector as a whole.
24 The balance between the income and wealth effects from QE depends on the distribution of
assets across households. In aggregate, sterling deposits with UK monetary financial
institutions (deposit-taking banks and building societies) make up around 25% of households’
financial wealth, while around 15% is held directly in equities and other securities (Chart 5).
14
According to the 2006/08 Wealth and Assets Survey, the vast majority of households hold
deposit accounts, with the median household holding around £1,000 in current accounts,
excluding overdrafts. In the same survey, around 15% of households reported that they
directly held UK shares, ie in addition to shares held indirectly via pension funds, and 10%
held stocks and shares ISAs.
25 To conclude, monetary policy has reduced interest rates and supported asset prices in order to
stimulate spending and avoid an even deeper and more prolonged recession following the
financial crisis. Largely as a result of the sharp reductions in Bank Rate – and not of QE –
nearly all savers have seen the interest payments on their deposits fall since 2008. The vast
majority of households hold deposit accounts, so these lower rates have affected most
households to some extent. But some households have been affected more than others.
Working against the effect of lower interest rates on deposits, some savers will have seen an
increase in the value of their holdings of other financial assets as a result of the low level of
Bank Rate and QE. In aggregate, such assets make up a larger share of households’ total
__________________________________________________________________________________
14
Consistent with the importance of pension-related issues for savers, the largest share of household assets is made up of
assets held on behalf of the household sector by insurance companies and pension funds (referred to as ‘insurance technical
reserves’), making up a little over 50%.
Chart 5 Composition of stock of household gross
financial assets in 2011 Q4
(a)
(a) Includes households and non-profit institutions serving
households.
(b) Includes currency, other deposits, loans and other
accounts receivable/payable.
24%
14%
53%
9%
Sterling
deposits with
UK MFIs
Securities,
shares and
other equity
Insurance
technical
reserves
Other(b)
12
portfolio of financial assets than deposits. Holdings of financial assets, including deposits, are
heavily concentrated among certain households.
Section 4: The implications of QE for pensions
26 This section discusses the implications of QE for pensioners, and for those approaching
retirement. It also considers the implications for pension providers,
15
because developments for
these companies will affect the pensions provided to the individuals participating in these
schemes as they retire. People in, or close to, retirement make up a relatively large share of the
UK population. According to the latest available population estimates (data for mid-2010),
people older than the relevant State Pension age (currently 60 for females and 65 for males
16
)
account for around 20% of the UK population. The pension incomes of the bulk of these
individuals – those who had already retired prior to the start of the financial crisis – will not
have been adversely affected by QE.
17
Indeed, some individuals may even have benefited if
they were net holders of financial wealth, because QE increased the prices of bonds and
equities. Data on real consumption growth rates by age group show that the over-65s are the
only group that has been able to maintain positive consumption growth during the crisis (Chart
6).
18
Those who have reached the State Pension age since mid-2007 – around 3 million people,
approximately 5% of the population – will have potentially been more affected.
19
This section
includes calculations of changes in the position of hypothetical pension schemes over four
periods within the past five years.
27 It is worth noting at the outset that, just as deposit rates have been affected by factors other
than monetary policy in recent years, there have been factors other than QE affecting
pensioners and pensions too. Although UK monetary policy has put downward pressure on gilt
yields in recent years, it cannot explain all of their fall. The broadly similar trend in UK and
other international government bond yields over the past decade (Chart 7) suggests that there
have been other important global factors driving the reduction in yields apart from monetary
policy. Some have suggested that downward pressure on interest rates has arisen from
unusually high levels of savings in some emerging market economies, especially China, which
have been more than enough to finance the high levels of investment there.
20
Other factors that
may have pushed down gilt yields include a shortage of high-quality safe assets, and the sharp
declines in corporate investment during the crisis. Pension wealth is normally held in the form
__________________________________________________________________________________
15
That includes both institutional investors, such as insurance companies and pension funds, and employers providing
pensions to their past and future employees. But it excludes the provision of state pensions, and other related payments
during retirement such as Pension Credit.
16
The State Pension Age is likely to rise over time to 68 for both females and males.
17
To the extent that QE pushed up inflation, that would have reduced the real income of some pensioners. But that has to
be seen in the context of the wider benefits of QE. Analysis in this section focuses on the direct impact of QE on interest
rates and asset prices.
18
See Weale (2012).
19
That does not equate to the precise number of people drawing pensions, for example because some above the State
Pension age remain in employment, while others below that age will have begun to draw on pensions.
20
See Bernanke (2005).
13
of equities and corporate bonds in addition to government bonds. The prices of such assets
have been affected by many factors other than QE over the past five years, including the weak
economic environment. Continued increases in life expectancy have also affected pension
schemes, raising the average costs of pension providers and increasing the amount that people
need to save for their retirement. In addition, many pension funds were in deficit before the
crisis, and, as discussed below, this was an important contributory factor in the deterioration of
their financial deficits during the current crisis.
28 Pensioners, people saving specifically for their retirement and pension providers are affected
by many of the same issues as savers in general. For example, lower Bank Rate and QE reduce
interest rates received on deposits and raise the value of asset holdings in exactly the same way
as for savers. So, as for savers in general, both the composition of assets and type of deposits
will be important. One difference, however, is that assets held in order to save for retirement
are likely to be in a more illiquid form than other savings, so they are more likely to receive a
return based on longer-term interest rates. As a result, downward pressure on longer-term
interest rates from QE has played a more important role than cuts in Bank Rate in determining
the overall impact on this group. And pension wealth (ie dedicated savings for retirement) is
more likely to be held in the form of non-deposit assets.
29 There are several different ways that individuals may save for their retirement, and the
channels through which QE affects these individuals will vary depending on the methods that
they use. Historically, the most common types of scheme are those that provide defined
benefits (eg final or career average salary schemes), where the employer/shareholder bears the
main risks. According to Towers Watson, around 60% of wealth held by pension funds was in
defined benefit (DB) schemes in 2011. An alternative model is one in which individuals, or
Chart 6 Average annual real consumption
growth rates by age group
Chart 7 Fifteen-year spot government bond
yields
(a)
Sources: LCF, EFS, FES and Bank calculations.
Sources: Bloomberg and Bank calculations.
(a) Zero-coupon yields.
-6
-4
-2
0
2
4
6
21-30
31-40
41-50
51-64
65+
2003 - 2007
2007 - 2010
Per cent
Age
0
1
2
3
4
5
6
7
8
2000
2002
2004
2006
2008
2010
2012
US
UK
Germany
Per cent
14
their employers, pay in a fixed contribution per period, and there is not a pre-defined income in
retirement. These are commonly referred to as ‘defined contribution’ – DC – or ‘money
purchase’ schemes. Upon retirement, individuals use the assets accumulated in the scheme
21
to
purchase an insurance (or annuity) contract paying out a stream of payments for the remainder
of their life. Here, the main risks are borne by the individual.
22
Assets held in DC schemes
made up the remaining 40% of pension fund assets in 2011. Alternatively, individuals may
save for their retirement independently. In that case, they could either live off the income from
their assets during retirement, or else they use their savings on retirement to buy an annuity. If
individuals take up the latter option, the channels through which QE affects them are likely to
be similar to those individuals in DC schemes. In practice, many individuals are likely to use a
combination of these approaches to provide for their retirement.
23
Defined benefit schemes
30 The net impact of QE on DB pension schemes’ overall position reflects two additional factors
to the general channels discussed above.
31 First, the extent to which there is a mismatch between the funds’ assets and liabilities. If a
pension fund is fully funded and holds government debt with coupon payments that exactly
match the future flow of its liabilities, then a change in gilt yields would have no net impact.
24
But many pension funds hold a mix of assets, including equities and other types of securities.
Estimates by the Bank suggest that QE increased the value of equities by a broadly similar
amount to gilts, so even with a mix of gilts and equities, a fully funded pension fund would not
have been materially affected by QE. But over the period since the start of the financial crisis,
equity prices have fallen relative to gilt prices for reasons unrelated to QE, causing pension
deficits to open up. The mismatch between assets and liabilities, which is common across
many pension funds, has had an important bearing on the performance of pension funds over
the past five years or so.
32 Second, if a DB pension scheme is in deficit, then QE can lead to a widening in that deficit.
That comes about because although QE causes the assets and liabilities of a pension scheme to
rise by similar proportionate amounts, because the pension fund’s liabilities are greater than its
assets, the absolute size of the deficit increases. The larger the size of the deficit, the larger the
__________________________________________________________________________________
21
That would typically include the accumulated income from those assets (less any fees).
22
Until the annuity is taken out, all the risks are borne by the individual. After the annuity is taken out, the balance of risk-
sharing depends on the type of annuity chosen. For example, for an index-linked annuity, the individual would always
receive the same real income, and the provider would bear the risk of inflation evolving in a way that it had not expected.
For a ‘with-profits’ scheme, the individual bears the risk of the return proving less than expected.
23
For example, an individual may have been part of a DB scheme with one employer, but subsequently moved into a DC
scheme with a new employer.
24
Pension fund liabilities will normally be uprated in line with RPI inflation, so index-linked gilts might be a better match
for them than conventional gilts.
15
detrimental impact of QE. The average pension fund deficit was equal to about 35% of total
liabilities in March 2007, calculated on a full buy-out basis, falling to 33% in 2011.
25
33 In order to illustrate the importance of the asset and liability structure of the pension scheme
when assessing the effect of QE, both in terms of underfunding and asset and liabilities
mismatch, Table 2 sets out illustrative scenarios for how the deficits of different hypothetical
DB pension schemes would have evolved over time, given actual movements in asset prices
and yields. The calculations are sensitive to the precise assumptions used, so they should be
treated as indicative only.
34 The table considers three hypothetical pension schemes. The first column sets out a baseline
case, in which the scheme is assumed to be fully funded in March 2007 (with £100 million
assets and £100 million liabilities), and the expected future cashflows from the assets and
liabilities of the scheme are matched as the scheme holds only gilts. That is then compared
with two alternative schemes. Scheme 1 is assumed to be fully funded in March 2007, but its
assets are composed of 60% equities and 40% bonds (column 2). Scheme 2 has the same asset
structure as Scheme 1, but is assumed to start in March 2007 with a deficit of £30 million
(column 3), ie liabilities are £100 million compared with assets of £70 million. Scheme 1
therefore has an asset-liability mismatch but was fully funded in March 2007; Scheme 2 has an
asset-liability mismatch but was under funded in March 2007.
35 The table traces out changes in the deficit of each pension scheme from March 2007 to the
following four dates: February 2009 (ie just before the start of QE), February 2010 (ie after the
first £200 billion of purchases had been completed), September 2011 (ie just before the
announcement of further purchases) and May 2012 (ie after the completion of a further £125
billion of purchases).
36 The table also contains some illustrative estimates that isolate the impact of QE. In each
example, QE has two effects: first, it increases the scheme’s assets by pushing up the value of
the gilts and equities held by the scheme; second, it increases the scheme’s liabilities by
reducing the discount rate the pension scheme applies to its future liabilities, and hence
increasing the current value of its liabilities. The impact of ‘other factors’ affecting deficits is
calculated by residual, and includes movements in gilt and equity prices that are unrelated to
QE (as discussed in paragraph 27).
__________________________________________________________________________________
25
See Purple Book 2011.
16
Table 2 Illustrative examples of DB scheme deficits
(a)
Sources: Bloomberg, Thomson Reuters Datastream and Bank calculations.
(a) In all the schemes, liabilities are assumed to be discounted using fifteen-year gilt (spot) yields, and the value of gilts
held as assets is assumed to move in line with fifteen-year gilts. The baseline scheme is assumed to hold 100% gilts.
Scheme 1 and 2 each hold 40% gilts and 60% equities. Scheme 2 is 70% funded, while Scheme 1 is fully funded. The
value of equities is assumed to follow the FTSE All-Share index. The impact from QE on gilt yields and equity prices
are based on the estimates in Joyce et al (2011). In particular, it is assumed that the £200 billion of QE between March
2009 and January 2010 led to an immediate 100 basis point fall in gilt yields and a gradual 20% increase in equity prices
over the period of the purchases. A similar proportionate impact is assumed for the £125 billion of QE between October
2011 and May 2012; that is, a 62.5 basis point fall in gilt yields and a 12.5% rise in equity prices. Estimates are
rounded to the nearest £0.1million, so the impacts may not add up due to rounding.
As a property of the approach taken here, the estimated changes in assets and liabilities as a result of QE continue to
grow after the completion of the first £200 billion of QE in January 2010 and before the start of the £125 billion of QE in
October 2011.
£m deficit for £100m (valued at Mar. 2007) DB pension schemes
- numbers in () are the values of assets/liabilities at point in time
- numbers in [] are the changes in deficits as a proportion/percentage of the initial asset level
Deficits at:
End Mar. 2007
End Feb. 2009
End Feb. 2010
End Sep. 2011
End May 2012
0 [0%] -26.5 [-26.5%] -19.4 [-27.8%]
Due to QE 0 0 0
Due to other factors 0 -26.5 -19.4
0 [0%] -9.6 [-9.6%] -6.5 [-9.3%]
Due to QE 0 0.0 -4.1
Change in assets
13.8 13.9 9.7
Change in liabilities
-13.8 -13.8 -13.8
Due to other factors 0 -9.6 -2.4
0 [0%] -26.5 [-26.5%] -26.1 [-37.2%]
Due to QE 0 -2.4 -6.9
Change in assets
17.4 15.1 10.5
Change in liabilities
-17.4 -17.4 -17.4
Due to other factors 0 -24.1 -19.2
0 [0%] -33.5 [-33.5%] -35.5 [-50.7%]
Due to QE 0 -5.1 -12.6
Change in assets
30.3 25.2 17.7
Change in liabilities
-30.3 -30.3 -30.3
Due to other factors 0 -28.4 -22.8
Negative figures indicate deficits or
any increase in deficits/liabilities
Baseline Scheme
Scheme 1
Scheme 2
Fully-funded at Mar. 2007
Fully-funded at Mar. 2007
Under-funded at Mar. 2007
Matched Asset/Liability
Asset/Liability Mismatch
Asset/Liability Mismatch
0.0
0.0
-30.0
(100/100)
(100/100)
(70/100)
0.0
-26.5
-49.4
(102.9/102.9)
(76.4/102.9)
(53.5/102.9)
0.0
-9.6
-36.5
(99.3/99.3)
(89.7/99.3)
(62.8/99.3)
0.0
-26.5
-56.1
(125.0/125.0)
(98.5/125.0)
(69.0/125.0)
0.0
-33.5
-65.5
(140.1/140.1)
(106.6/140.1)
(74.6/140.1)
Changes Mar. 2007- May 2012
Changes Mar. 2007- Feb. 2009
Changes Mar. 2007- Feb. 2010
Changes Mar. 2007- Sep. 2011
17
37 In the case of the baseline scheme, which is fully funded and whose assets and liabilities are
matched, the scheme remains fully funded, ie there is no deficit and the net impact of QE is
zero. The fall in gilt yields, which is used to discount the pension fund’s future liabilities,
causes the current value of its liabilities to rise. But this is exactly matched by the rise in the
value of the gilts that it holds. That is the case for all movements in gilt yields, irrespective of
whether they are caused by QE or not.
38 In contrast, although Scheme 1 is assumed to have been fully funded in March 2007, the
mismatch between its assets and liabilities means that a deficit gradually opens up over the
subsequent period, such that by February 2009 Scheme 1 is estimated to have a deficit of
around £27 million. That widening deficit largely reflects the sharp fall in equity prices that
occurred between March 2007 and February 2009. The impact of QE on Scheme 1 is very
similar to that of the baseline scheme; it raises its assets and liabilities by a similar
proportionate amount.
26
That means that, had Scheme 1 been fully funded at the point at which
the asset purchase programme was started, the impact on the scheme would have been broadly
neutral. But since the scheme was in deficit by February 2009, by increasing its assets and
liabilities by similar amounts, QE acted to increase the absolute size of the deficit. Even so, the
vast majority of the widening in the deficit in Scheme 1 over the entire period considered (£28
million out of £34 million) was not caused by QE.
39 The results for Scheme 2 are qualitatively similar, but the fact that Scheme 2 was assumed to
start in deficit means that the deterioration in the portfolio is more pronounced. QE accounts
for around of £13 million (just over a third, ie 13/36) of the increased deficit by May 2012.
That is a larger proportionate effect than in Scheme 1, reflecting the fact that the scales of the
funding deficits at the points when the asset purchases were conducted were greater.
40 Increases in costs for DB schemes are borne in the first instance by employers, rather than by
employees. So there would be no implications for existing pensioners on a DB scheme, nor for
those on a DB scheme close to retirement. But, faced with higher costs of providing pensions,
employers might seek to increase contributions or bear down on other staff costs including pay;
it may also make them more likely to close, or alter the terms of, such pension schemes. For
example, individuals on a final salary scheme might receive smaller pay rises than they had
been expecting, potentially reducing their future retirement income. The extent to which that
occurs may in part reflect the speed with which sponsors are required by The Pensions
Regulator to make up any deficits in their funds.
41 The increased costs for some DB schemes needs to be set against what would have happened in
the absence of QE, however. For example, by supporting nominal demand in the economy, QE
has cushioned many companies from the financial crisis and ameliorated the rise in company
__________________________________________________________________________________
26
In fact, Bank estimates suggest that QE raised equity prices by slightly more than gilt prices – see note (a) in Table 2 for
more details.
18
closures and insolvencies. As well as the effect that had on supporting asset prices, it may
have protected some individuals from the closure of their pension scheme.
Defined contributions schemes and individuals taking out an annuity
42 In assessing the channels through which QE affects individuals with DC pension schemes, and
those taking out an annuity, it is helpful to split out two time periods. First, the period in which
individuals are accumulating assets to fund their retirement. Second, the period from which
they wish to begin drawing down on those assets by purchasing an annuity.
43 During the accumulation phase, the impact of QE arises via its impact on the value of their
asset portfolio. The net impact will therefore depend on the same factors as those affecting
savers in general, namely the composition and type of those assets. During this accumulation
period, the composition of assets held by an individual may well change, for example with
equities being held at early life stages, gradually shifting into fixed-income assets such as gilts
as the point of retirement approaches. For simplicity, our analysis assumes a constant asset
allocation over time.
44 When an individual wishes to begin drawing down their pension, they normally exchange their
pension fund for a life annuity. There could be some flexibility in terms of the point at which
they take out that annuity; some individuals may be able to choose to delay taking out their
annuity for a period if they expect annuity rates to pick up. The annuity offered to an
individual is a function of the value of the pension fund and the prevailing annuity rate in the
market. In turn, the annuity rate will depend on the discount rate – which will be affected by
long-term interest rates – and the annuity provider’s estimates of the likely longevity of the
individual. So the net impact of QE will depend on two factors: its positive impact on the
value of asset holdings on the one hand and, on the other, its negative impact on annuity rates
through longer-term interest rates. In assessing the impact of QE, some commentators have
focused solely on the latter.
45 Table 3 considers an illustrative example of the average life annuity income that would have
been available to a 65-year old male with a lump sum of £100,000 before the financial crisis in
March 2007. In the upper half of the table, the first three columns show the annuity income
that he would have received as a result of purchasing an annuity at the same four dates
considered in Table 2. The changes in the annuity incomes take into account changes in the
value of the pension pot and the annuity rate over those periods.
27
The three columns differ
according to the assumed split of assets between gilts and equities in three pension pots:
‘conservative’ (100%, 0%), ‘balanced’ (50%, 50%) and ‘high risk’ (0%, 100%). The final
__________________________________________________________________________________
27
These simple calculations assume that the age of the individual taking out the annuity remains at 65 for the whole period.
In practice, by delaying the point at which the annuity is taken out, the individual would be offered a higher annuity rate
because he would be expected to live for fewer years.
19
column is based on actual annuity market data and shows the level or standard annuity rate
offered to a 65-year old male at each point in time. For example, based on the annuity rate
shown in the final column, a male with a pension pot of £100,000 in February 2010 could have
received an annual pension income of around £6,800 (market annuity rate of 6.8% multiplied
by £100,000), but would have only got £5,900 with a £100,000 pot in May 2012 (market
annuity rate of 5.9% multiplied by £100,000).
46 In the lower half of the table, the first three columns decompose changes in annuity income for
each of the three hypothetical portfolios over the different time periods. The fourth column
shows the change in the actual annuity rate based on market data broken down into the
contribution from QE and other factors. The reduction due to QE is calculated by assuming
that the estimated reduction in gilt yields due to QE is fully passed through to lower annuity
rates. This may exaggerate the negative impact of QE, as the historical relationship between
gilt yields and annuity rates suggests a less than 100% pass-through from gilt yields.
47 Take as an example the results for the ‘conservative’ portfolio. If an individual had invested
£100,000 solely in gilts in March 2007, that would have given an annuity of £7,140. By
February 2010, the annuity value would have fallen by £430, to £6,710. That would not have
reflected QE, which would have would have had a broadly neutral effect, as the increase in the
value of the pension pot associated with the rise in gilt prices would have broadly offset the
reduction in the annuity rate associated with the lower gilt yields. Over the period from March
2007 to May 2012, the annuity income from this fund would have increased by £1,060. Within
that, QE would again have had a broadly neutral effect.
28
48 The overall performance of the balanced and high-risk portfolios (shown in columns 2 and 3 of
Table 3) was worse than the conservative one. Over the period March 2007 to May 2012,
annuity income fell, by £580 for the balanced portfolio and by £2,210 for the high-risk
portfolio. This mainly reflected other factors, and particularly the sharp fall in equities over the
period up to February 2009. The net impact of QE on both these portfolios was actually to
boost annuity income by £130 in the case of the balanced portfolio and by £260 for the high-
risk one. This reflects the fact that QE is estimated to have increased equity prices by a little
more than gilt prices.
29
__________________________________________________________________________________
28
The net impact of QE on annuity income is not exactly zero, with a positive estimated impact of £80 up to February 2010
and a negative impact of £10 in the period up to May 2012. The intuition for this result is that there is a small mismatch
between the assets held in the portfolio and the annuity rate used. The gilts held in the portfolio are assumed to move in
line with fifteen-year gilts. The annuity rates used in the calculations do not have a specified maturity: they are always
quoted for a 65-year old, and there is no fixed date at which the annuity will cease. This maturity mismatch means that, for
a given fall in gilt yields, the increase in the value of the pension pot associated with the rise in gilt prices does not
generally exactly offset the reduction in the annuity rate associated with lower gilt yields (they would only exactly offset if
the annuity rate were equal to 1/15 ie the inverse of the gilt maturity). This maturity mismatch effect is similar to that
driving the difference in the estimated impact of QE between the DB Baseline Scheme and Scheme 1 in Table 2.
29
See note (a) in Table 2 and Joyce et al (2011).
20
Table 3 Illustrative examples of annuities
(a)
Sources: Bloomberg, Thomson Reuters Datastream, William Burrows Annuities and Bank calculations.
(a) Based on a male aged 65. Life Annuity rates are on a guaranteed five-year and level payment basis. The value of the gilts
held in the portfolios is assumed to move in line with fifteen-year gilts. The impacts of QE are based on the same assumptions
as those underlying Table 2. As a simplifying assumption, QE is assumed to have the same impact on the annuity rate as it does
on gilt yields. Estimates are rounded to the nearest £10, so impacts may not add up due to rounding.
- numbers in () are the values of assets/liabilities at point in time
Portfolio 1 Portfolio 2 Portfolio 3
'Conservative' 'Balanced' 'High risk'
Annuity bought at:
End Mar. 2007 7140 7140 7140 7.14%
(100000) (100000) (100000)
End Feb. 2009 7160 5630 4090 6.96%
(102940) (80860) (58780)
End Feb. 2010 6710 6170 5630 6.76%
(99330) (91340) (83360)
End Sep. 2011 7700 6340 4980 6.16%
(125020) (102930) (80850)
End May 2012 8200 6560 4930 5.85%
(140130) (112210) (84280)
20 -1510 -3050 -0.18 pp
Due to QE 0 0 0 0 pp
Due to other factors 20 -1510 -3050 -0.18 pp
-430 -970 -1510 -0.38 pp
Due to QE 80 160 240 -1 pp
o/w impact from higher asset value 1080 1160 1240
o/w impact from lower annuity rate -1000 -1000 -1000
Due to other factors -510 -1130 -1750 0.62 pp
560 -800 -2160 -0.98 pp
Due to QE 0 80 160 -1 pp
o/w impact from higher asset value 1000 1080 1160
o/w impact from lower annuity rate -1000 -1000 -1000
Due to other factors 560 -880 -2320 0.02 pp
1060 -580 -2210 -1.29 pp
Due to QE -10 130 260 -1.63 pp
o/w impact from higher asset value 1620 1760 1890
o/w impact from lower annuity rate -1630 -1630 -1630
Due to other factors 1070 -710 -2470 0.34 pp
Changes Mar. 2007- Feb. 2009
Changes Mar. 2007- Feb. 2010
Changes Mar. 2007- Sep. 2011
Changes Mar. 2007- May 2012
£ per year from a pension fund valued at £100,000 at end March 2007
Negative figures indicate reduction in annuity
Annuity Rate (per
cent/percentage
points)
21
49 This section has set out the implications of QE for pensioners and pension providers. In
making that assessment, it is important to consider that QE affects the value of pension fund
assets as well as their liabilities. For a fully-funded DB scheme, QE had a broadly neutral
impact. But, in practice, many DB schemes were under-funded at the point that QE began,
and, as such, QE is likely to have increased those deficits. By contrast, it is likely that QE had
a broadly neutral impact on the annuities offered to those approaching retirement on DC
pension schemes. And those already in receipt of a pension before QE began would have been
unaffected. In general, other factors have been more important than the Bank’s asset purchases
in widening pension fund deficits and weighing on annuities over the past five years. In
particular, the main factor affecting pensions has been the fall in equity prices relative to gilt
prices since 2007.
Conclusion
50 The past few years have been extremely difficult for many households, with weak growth and
above-target inflation being the painful but unavoidable consequences of the severe financial
crisis and the associated deep recession, as well as a sharp rise in oil and other commodity
prices. In response to these difficult circumstances, monetary policy has been exceptionally
expansionary for an unusually long period of time. That has supported nominal spending and
incomes in the economy as a whole, mitigating the adverse effects of the financial crisis and
subsequent recession. Without the loosening in monetary policy, it is likely that the economic
downturn would have been far more severe, to the detriment of almost everyone in the
economy, including savers and pensioners.
51 The benefits of loose monetary policy have not been shared equally across all individuals,
however. Some individuals are likely to have been adversely affected by the direct effects of
QE. Many households have received lower interest income on their deposits. But changes in
Bank Rate – not asset purchases – have been the dominant influence on the interest households
receive on bank deposits and pay on bank loans. By pushing up a range of asset prices, asset
purchases have boosted the value of households’ financial wealth held outside pension funds,
although holdings are heavily skewed with the top 5% of households holding 40% of these
assets.
52 Some pension schemes have been adversely affected by the direct effects of QE. In particular,
for a DB pension scheme in substantial deficit, asset purchases are likely to have increased the
size of the deficit. That is because although QE raised the value of the assets and liabilities by
a similar proportion, that nonetheless implies a widening in the gap between the two. By
contrast, for a typical fully-funded DB pension scheme, asset purchases are likely to have had a
broadly neutral impact on the net value of the scheme. The fall in gilt yields raised the value of
the pension fund’s liabilities. But the associated increase in bond and equity prices raised the
value of their assets by a similar amount. Likewise, asset purchases are likely to have had a
22
broadly neutral impact on the value of the annuity income that could be purchased with a
personal pension pot. The fall in gilt yields reduced the annuity rate. But this was offset by the
rise in the value of equities and bonds held in the fund. Furthermore, the pension income of
those already in receipt of a pension before asset purchases began has not been affected by QE,
and the same is true for the retirement incomes of people coming up to retirement in a DB
pension scheme. The main factor affecting the valuation of DB pension schemes and DC
pension pots over the past five years has been the fall in equity prices relative to gilt prices.
That fall in the relative price of equities was not caused by QE, and stemmed in large part from
the reluctance of investors to hold risky assets, such as equities, given the deterioration in the
economic outlook, almost certainly as a result of the financial crisis.
References
Bean, C (2012), ‘Pension funds and quantitative easing’,
www.bankofengland.co.uk/publications/Pages/speeches/2012/573.aspx.
Benford, J, Berry, S, Nikolov, K and Young, C (2009), ‘Quantitative easing’, Bank of England
Quarterly Bulletin, Vol. 49, No. 2, pages 90-100.
Bernanke, B (2005), ‘The global saving glut and the US current account deficit’, Sandridge Lecture,
Virginia Association of Economics.
Galli, R and van der Hoeven, R (2001), ‘Is inflation bad for income inequality: the importance of the
initial rate of inflation’, International Labor Organization Employment Paper, 2001/29.
Joyce, M, Tong, M and Woods, R (2011), ‘The United Kingdom’s quantitative easing policy: design,
operation and impact’, Bank of England Quarterly Bulletin, Vol. 51, No. 3, pages 200-12.
Kamath, K, Radia, A, Nielson, M and Reinold, K (2011), ‘The financial position of British
households’, Bank of England Quarterly Bulletin, Vol. 51, No. 4, pages 305-18.
Miles, D (2012), ‘Asset prices, saving and the wider effects of monetary policy’,
www.bankofengland.co.uk/publications/Pages/speeches/2012/549.aspx.
Purple Book, www.pensionprotectionfund.org.uk/Pages/ThePurpleBook.aspx.
Towers Watson (2012), ‘Global Pension Assets Study 2012’,
www.towerswatson.com/assets/pdf/6267/Global-Pensions-Asset-Study-2012.pdf.
Weale, M (2012), ‘From retailers’ paradise to shoppers’ strike: what lies behind the weakness in
consumption?’, www.bankofengland.co.uk/publications/Documents/speeches/2012/speech548.pdf.