DOLLARS AND SENSE: HOW STATE AND LOCAL GOVERNMENTS IN MICHIGAN SPEND YOUR MONEY docx
Bạn đang xem bản rút gọn của tài liệu. Xem và tải ngay bản đầy đủ của tài liệu tại đây (494.82 KB, 26 trang )
.
2011 Citizen’s Guide to
Michigan’s Financial Health
Presented by
Governor Rick Snyder
Dollars and Sense:
How State and Local Governments in
Michigan Spend Your Money
2011 Citizen’s Guide to Michigan’s Financial Health
Issued on: January 31, 2011
Revised on: April 20, 2011
KEY TERMS
There are a few key terms that may be helpful when reading this report. They include:
• Budget deficit/surplus. If there is less money received than paid out in a given fiscal year,
there is a budget deficit or shortfall. If there is more money received than paid during the
fiscal year, a budget surplus exists.
• Debt. Just like a homeowner takes out a mortgage, governments can borrow money to pay
for certain types of projects. The state has both short-term debt (paid back within the fiscal
year) and long-term debt. Debt can be either general obligation debt, meaning that the
state pays back the debt with regular tax collections and other revenues, or special revenue
debt, which is paid off over time with revenue from specified sources beyond the usual taxes
and service fees.
• Fiscal year (FY). The 12-month period of time during which budgets are allocated or finances
are planned. Most households have a fiscal year that runs from January 1 to December 31
(that’s the period for which we pay personal income taxes in April), while state government
uses an October 1 - September 30 fiscal year. Some local units of government, including pub-
lic schools, use a July 1 - June 30 fiscal year, while others operate on a typical calendar year.
• Fund balance. Once all the bills for the year have been paid out of a certain fund, whatever is
left over is called the fund balance. When a fund balance is less than zero, you’ll see the
number shown with parentheses around it. Deficits cause fund balances to decrease, while
surpluses cause them to increase.
• Major funds. These are the primary sources of money from which the state pays most of its
bills. They are the General Fund (which pays for a variety of government operations), the
School Aid Fund (which pays for most of K-12 education), and the Budget Stabilization Fund
(which is the “rainy day” fund that the state can tap into during tough economic times).
• Public authorities. The state can establish public, independent authorities to carry out spe-
cific tasks and issue debt tied to a specific project or type of project. For example, the Mack-
inac Bridge Authority was established to construct, operate, and maintain the bridge
connecting the upper and lower peninsulas of Michigan.
• Public budget gap. A novel measure, similar to the deficit, used to measure the extent to
which a government is falling short of covering its current and long-term obligations in a fis-
cal period. The budget gap takes into account the budget deficit, as well as any new obliga-
tions that the government has failed to cover such as employee pensions or retiree health
care.
• Reserved/Restricted funds. Some funds are considered to be “reserved” or “restricted” for a
specific purpose, and cannot be spent for anything else.
Table of Contents
2011 Citizen’s Guide to Michigan’s Financial Health
Table of Contents
Welcome 1
How Governments Use Your Money 2
Where Citizen Dollars Go 2
How Governments Work Together 2
Services That Governments Provide 3
Where We’re Headed:
Michigan’s Economic and Demographic Trends 4
Our People 4
Our Jobs 4
Our Income 5
How Taxpayer Money Is Spent:
Government Revenues and Expenditures 6
Public Budget Deficits 6
Michigan’s State Spending Priorities 7
Government Employees 9
Difference in Public and Private Sector Compensation 9
Michigan’s Fiscal Health 12
Reserves and Major Fund Balances 12
Michigan’s “Rainy Day Fund” 13
Cash On Hand and Internal Borrowing 13
Public Borrowing 14
Pension and Retiree Health Care Obligations
for Public Employees 17
Unemployment Insurance Benefits 18
Michigan’s Credit Rating 20
A Widening Public Budget Gap 20
How This Report Was Developed 22
Data Sources and Notes 22
Other Sources and Links 22
Revisions 23
2011 Citizen’s Guide to Michigan’s Financial Health 1
Welcome
Governor Rick Snyder
Greetings,
All Michigan residents have a vested interest in the economic future of our state. We need all hands on deck as we sort out
the ideas, resources and action steps necessary to get us back on course toward prosperity and growth. This report is
intended to provide ALL citizens with an assessment of the financial health of Michigan's state and local governments. For
every $7 earned in Michigan, $1 is sent to state and local government in the form of taxes, fees, and charges for services.
As a taxpayer, you deserve to know what your dollars are buying, and have a voice in making sure those services and pro-
grams are going to be appropriate to righting our ship. This report provides information on:
• How taxes and fees are collected and used across our state;
• The long-term consequences of today's budget decisions—borrowing, debt levels, budget reserves; and
• The bills that are mounting for the future, such as public employee pensions and federal loans.
For this report, we have used the most recent information available. In most cases, this is for the 12-month period ending
September 30, 2010. What does this report show? Largely, we find the following:
• Michigan residents are earning less than a decade ago. Lower incomes mean less tax revenue and an increased need
for government services. The result has been an ongoing structural imbalance in the state’s finances;
• Many governments in Michigan are spending more than they are taking in. To support their spending, they have
drained their savings, borrowed money, and failed to put money away for liabilities they know are on the horizon.
• Michigan has been unable to invest in its future. State government expenditures on infrastructure and higher educa-
tion, among other areas, have declined over the past decade;
• State employee compensation in Michigan has grown while private sector compensation has fallen, inhibiting taxpay-
ers’ ability to support the salaries and benefits of public employees, or to meet critical investment needs and assist
Michigan citizens in financial distress. The state's future has been mortgaged through extensive borrowing and accu-
mulation of unfunded pension and retiree health care liabilities;
• Years of high unemployment have rendered our unemployment compensation fund insolvent and created a greater
demand for government services. Our system simply wasn’t built for this sustained level of hardship.
Once you have read this report, you are invited to make your voice heard. Bring your ideas to the table, share your opin-
ions, contact your legislator or my office, and help us enact the change necessary to get Michigan back on track. Only by
working together can we bring about the change necessary to stabilize Michigan's economy and get our citizens working
again.
Thank you to the following organizations for working on this report: Business Leaders for Michigan for leading its develop-
ment and Anderson Economic Group, Citizens Research Council of Michigan, the Michigan Association of Certified Public
Accountants, and the Michigan Government Finance Officers Association for providing valuable input. And many thanks to
you, our readers, for your interest and for being part of the historic change that will make Michigan a leader in the new
economy.
Sincerely,
Governor Rick Snyder
How Governments Use Your Money
2011 Citizen’s Guide to Michigan’s Financial Health 2
How Governments Use Your Money
WHERE CITIZEN
DOLLARS GO
For every $7 you earn in Michigan, you pay $1 in taxes, fees, and charges for ser-
vices to state and local governments.
1
Where does that money go? What benefit do
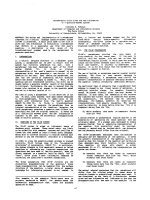
you receive in exchange for these dollars? Figure 1 shows that in FY 2010, Michigan
citizens paid $50.4 billion in taxes, fees, and charges for services to state and local
governments. Local governments include counties, cities, villages, townships, and
some local authorities. Though schools are technically local units of government,
they are often presented separately in this report.
FIGURE 1. Where Your Money Goes, FY 2010
HOW
GOVERNMENTS
WORK TOGETHER
Governments often receive revenues from other government entities. Figure 2 on
page 3 shows how these tax dollars and other sources of revenue flow between
state, local, and federal governments. For example, most of the money provided to
the state via the sales tax is sent to local school districts for K-12 public education.
Local and state governments also receive money from the federal government to
pay for services such as roads and health care for low-income residents. The arrows
in Figure 2 on page 3 show transfers from one government entity to another in Mich-
igan. The table immediately following the figure shows how all of these contribu-
tions add up to the total revenues of these government entities. As we discuss later
in this report, state and local governments (including schools) received $82.5 billion
in revenues in FY 2010.
1. The amount of dollars earned in Michigan per dollar sent to governments is derived by dividing total
personal income in the state ($342.3 billion) in the year 2009 by the amount of money state and
local governments collected in taxes, fees, and charges for service ($50.1 billion) for FY 2009.
MichiganCitizens
Totalstateandlocaltaxes,fees,and
chargesforservices:
$50.4B
State
Government
Local
Governments
PublicSchools
$
2
9
.
4
B
$
6
.
7
B
$14.3B
Sources: Data is for FY 2010. State data is from the unaudited FY 2010 CAFR. Local data is from AEG
estimates for FY 2010, based on 2008 U.S. Census of Governments State & Local Finances Survey.
Analysis: Anderson Economic Group, LLC
How Governments Use Your Money
2011 Citizen’s Guide to Michigan’s Financial Health 3
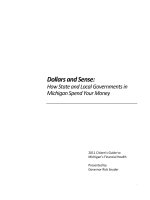
FIGURE 2. Cash Flow Between Governments
SERVICES THAT
GOVERNMENTS
PROVIDE
Where does this money go? In general, state and local governments collect money in
the form of taxes and fees and use it to coordinate delivery of public services, includ-
ing, but not limited to:
• Community health (Medicaid, local public health, and mental health services)
• Human services (cash assistance, food stamps, child foster care, disability insurance)
• Corrections and law enforcement
• Infrastructure (roads and bridges)
• Resource protection
• Elementary and high school education
• Higher education (community colleges and universities)
• Planning, zoning, and economic development
Who Funds Michigan’s State and Local Governments?, FY 2010
State
Government
Local
Governments
Public Schools
(K-12)
Total Funds
Provided
Michigan Citizens $29.4 billion $14.3 billion $6.7 billion $50.4 billion
Federal Government $22.2 billion $2.6 billion $2.6 billion $27.4 billion
Other $0.8 billion $3.2 billion $0.6 billion $4.4 billion
$82.5 billion
Transfers from State Government: $8.0 billion $10.8 billion
TOTAL REVENUES $52.5 billion $26.0 billion $20.7 billion
Sources: Michigan CAFR, U.S. Census Bureau Survey of State & Local Finances, AEG estimates
Analysis: Anderson Economic Group, LLC
Federal
Government
$
2
.
6
B
State
Government
Local
Governments
Public
Schools
$8.0B$10.8B
$22.2B
$
2
.
6
B
Sources: FY 2010 Michigan CAFR; U.S. Census Bureau Survey of State & Local Finances; AEG estimates
Analysis: Anderson Economic Group, LLC
Note: Money provided by the federal government to the state government for public schools is shown
as a transfer from the federal government to public schools.
Where"We’re"Headed:"Michigan’s"Economic"and"Demographic"Trends
2011"Citizen’s"Guide"to"Michigan’s"Financial"Health 4
Where"We’re"Headed:
Michigan’s"Economic"and"Demographic"Trends
ItisnosecretthatMichigan’seconomyhasbeenflaggingforsometime.Peopleneed
governmentservicesmorethaneverastheystrugglewithunemploymentandeco
nomichardship.Butfewerjobsalsomeanfewerdollarsintaxrevenuetosupport
theseservices.Thisfundamentaltensionis,inanutshell,thecurr
entchallengefacing
ourstate.Longtermtrendsinourpopulationandoureconomycompoundthischal
lenge.
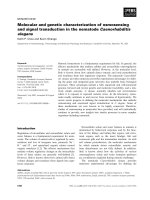
OUR"PEOPLE Michigan’s"population"is"aging.AsshowninFigure 3,thenumberofMichiganresi
dentsbelowtheageof60declinedbetween2000and2010whilethenumberover
60increased.Agingisanationalphenomenonduetothesizeofthebabyboomer
generation,butthesituationismoreacuteinMichig
anwherethereisalsoareduc
tioninthenumberofyoungpeople.Peopleovertheageof60providelesstaxreve
nueonaveragebecausepensionincomeisexemptfromthestateincometax,while
theytendtorequireasmanyormorepublicservices(e.g.healthcare).Th
eyalso
consumeless,yieldinglowersalestaxrevenue.
FIGURE 3. Michigan"Population"Aging—Fewer"Younger"Workers"
OUR"JOBS Michigan’s"unemployment"is"high."EmploymentinMichiganhasbeenaffectedby
thepooreconomy.Between2000and2010,theunemploymentrateinMichigan
increasedfrom3%toover14%—wellabovethenationalrateof10%.Michigan"priど
vate"sector"job"losses"were"equivalent"to"twoどthirds"of"all"jobs"lost"in"the"U.
S."
between"January"2000"and"January"2010.
2
Thishasloweredtaxrevenueand
ϭϴй
Ϯϭй
ϭϬй
ϭϱй
ϮϬй
Ϯϱй
hŶĚĞƌŐĞϲϬ ŐĞϲϬĂŶĚhƉ dKd>
Ă
ƚŝŽŶ͕ϮϬϬϬ
ͲϮϬϭϬ
Ͳϯй
ϭϴй
Ͳϭй
ϳй
Ϯϭй
ϵй
Ͳϱй
Ϭй
ϱй
ϭϬй
ϭϱй
ϮϬй
Ϯϱй
hŶĚĞƌŐĞϲϬ ŐĞϲϬĂŶĚhƉ dKd>
ŚĂŶŐĞŝŶWŽƉƵůĂƚŝŽŶ͕ϮϬϬϬͲϮϬϭϬ
DŝĐŚŝŐĂŶ h͘^͘
Source:"U.S."Census"Bureau,"Population"Estimates,"2000ど2009;"2010"Census"data
Analysis:"Anderson"Economic"Group,"LLC
2. NonfarmemploymentdataisfromtheU.S.BureauofLaborStatistics,StateandAreaEmployment,Hourand
Earnings,andtheCurrentEmploymentStatisticssurvey(national).
Where We’re Headed: Michigan’s Economic and Demographic Trends
2011 Citizen’s Guide to Michigan’s Financial Health 5
increased demand for unemployment benefits from the state, which we discuss in
more detail in “Unemployment Insurance Benefits” on page 18.
OUR INCOME Michigan’s families are among
the poorest in the nation. Michi-
gan’s income levels have grown
slowly during the past fifteen
years, largely due to high unem-
ployment and an aging population. Personal income grew by only 7% between 1995
and 2009, compared with U.S. growth of 35% during the same period. In 2000, per
capita income in Michigan (in 2009 dollars) was $37,195. By 2009, this had fallen to
$34,812. This is lower than the national average of $39,626. Michigan now ranks
37th in per capita income among all 50 states—and our families are among the
poorest in the nation. See Figure 4.
FIGURE 4. Michigan Has Lagged Behind the Nation in Income Growth
Michigan now ranks 37th in per capita income
among all 50 states—and our families are
among the poorest in the nation.
Source: Bureau of Economic Analysis Regional Information Systems
Analysis: Anderson Economic Group, LLC
$-
$10,000
$20,000
$30,000
$40,000
2000
2005
2009
Personal Income per Capita
U.S.
Michigan
Michigan's
Rank
18th
37th
31st
How Taxpayer Money Is Spent: Government Revenues and Expenditures
2011 Citizen’s Guide to Michigan’s Financial Health 6
How Taxpayer Money Is Spent:
Government Revenues and Expenditures
PUBLIC BUDGET
DEFICITS
Many governments in Michigan are spending more than they take in. In total, state
and local governments (including public schools) received $82.5 billion in revenue
and spent $84.8 billion in FY 2010. This accounts for revenues from all sources,
including taxes, service and permit fees, and federal dollars. It includes all primary
government spending, not just the major funds such as the General Fund and School
Aid Fund. Here’s the budget equation for Michigan governments in 2010, in plain
and simple terms:
FIGURE 5. Spending Levels Often Exceed Revenues, FY 2001-FY 2010
Michigan governments spent more than they received in 2010. This is not a rare or
new thing. As shown in Figure 5 above, Michigan’s state and local units of govern-
ment have regularly spent more money than they have taken in since 2001. In
State & Local Government Spending in Michigan, FY 2010
Government took in: $82.5 billion
Government spent: $84.8 billion
Difference: ($2.3 billion)
$-
$10
$20
$30
$40
$50
$60
$70
$80
$90
2001
2002
2003
2004
2005
2006
2007
2008
2009
2010
billions of $
Other sources
Federal government
Services, licenses, and
permits
Tax revenue
Total expenditures
Revenues from:
Source: State data from the Statement of Activities, Michigan CAFR. Local data is from the U.S. Census o
f
Governments, State and Local Finance Survey with AEG Projections for FY 2010
Note: Local government data (which includes public schools) is unaudited survey data compiled by the
Analysis: Anderson Economic Group, LLC
U.S. Census Bureau. This was the best data available.
How Taxpayer Money Is Spent: Government Revenues and Expenditures
2011 Citizen’s Guide to Michigan’s Financial Health 7
2010, state government had a primary government deficit of almost $1 billion while
local governments, taken together, had a deficit of about $1.2 billion. The state gov-
ernment covered its shortfall in 2010 with $1.2 billion in loans from the federal gov-
ernment for unemployment insurance, which will be repaid by Michigan employers
later on.
Public Revenues. Figure 6 shows a breakdown of the dollars moving in and out of
state and local governments during 2010. On the revenue side, taxes make up
approximately 42% of total revenue, with property taxes at 15% of total revenue, fol-
lowed by sales and use taxes, and personal income taxes. In 2010, federal funds pro-
vided a third of the revenue to Michigan’s state and local governments, while
charges for services and permit fees accounted for 16% of revenue. Revenues from
the federal government have been elevated over the last two years due to tempo-
rary federal programs, like the American Reinvestment and Recovery Act (the stimu-
lus package) and extensions of unemployment benefits.
Public Expenditures. Elementary and high school education; health services and hos-
pitals; and human services (including welfare, disability insurance, and the food
stamp program) account for almost half of all public expenditures.
FIGURE 6. Public Revenues and Expenditures by Category, FY 2010
MICHIGAN’S STATE
SPENDING
PRIORITIES
Michigan’s state government has not been able to make investments that might
spur economic growth, but rather has had to meet heightened demand for com-
munity health and human services. The largest expenditure category for the state
government alone (the previous section included local government and schools, as
Federal Funds
33%
Sales and Use
Taxes
10%
Personal
Income Tax
9%
Property Taxes
15%
Business Taxes
2%
Motor Vehicle
and Gas Taxes
2%
Other Taxes
4%
Services, Licenses,
and Permits
16%
Utilities
3%
Other
6%
Higher education
4%
K-12 education
21%
Human services
10%
Health and hospitals
17%
Transportation
5%
Public safety &
corrections
8%
Environment
5%
General government
5%
Interest on debt
2%
Utilities
4%
Unemployment
insurance
8%
Other
11%
Revenues = $82.5B
Expenditures = $84.8B
Source: State data is from the Michigan CAFR. Local data is from the FY 2008 U.S. Census of Governments State and Local Finance
Survey, with AEG Projections for FY 2010
Analysis: Anderson Economic Group, LLC
How Taxpayer Money Is Spent: Government Revenues and Expenditures
2011 Citizen’s Guide to Michigan’s Financial Health 8
well) is community health (Medicaid and mental health services, for example), fol-
lowed by K-12 education, and human services (e.g. disability insurance, cash assis-
tance, the food stamp program, child foster care programs). These three categories
accounted for 75% of total appropriations by the state government this past fiscal
year. Appropriations are funds allotted to state departments by the legislature.
Not only are human services and community health two of the largest spending
categories, they have been growing at the fastest rate over the past ten years.
While human services and community health increased at twice the rate of inflation,
almost all other categories remained flat or lost funding over the same period.
FIGURE 7. Average Annual Change in State Appropriations, FY 2001-2010
State Government Appropriations, FY 2010
Community health $13.6 billion 29.8%
K-12 education $12.8 billion 28.1%
Human services $7.8 billion 17.1%
Other $11.4 billion 25.0%
TOTAL $45.6 billion
Source: Michigan House Fiscal Agency
Note: Total appropriations do not match up exactly with total
expenditures because accounting methods for the two are different
and not all state government expenditures are appropriations.
-6.0%
-4.0%
-2.0%
0.0%
2.0%
4.0%
6.0%
8.0%
2001-2005
2005-2010
2001-2010
Change in Appropriations as % of Total
Human Services
Community Health
Public Safety
Corrections
K-12 Education
Infrastructure
General Government
Higher Education
Resource Protection
-2%
-1%
0%
1%
2%
3%
4%
5%
6%
Human Services
Community
Health
Public Safety
Corrections
Higher Education
K-12 Education
Infrastructure
General
Government
Resource
Protection
ANNUAL INFLATION: 2.3%
PRIMARY
FUNDING
SOURCE:
FEDERAL
STATE GENERAL
FUND
STATE
RESTRICTED
Source: Michigan Senate Fiscal Agency; House Fiscal Agency for FY 2010; U.S. Bureau of Labor Statistics for inflation
Analysis: Anderson Economic Group, LLC
How Taxpayer Money Is Spent: Government Revenues and Expenditures
2011 Citizen’s Guide to Michigan’s Financial Health 9
Spending growth on public safety outpaced inflation, but spending on public safety
only represents 2% of state government spending. Spending on K-12 education has
gone up less than 1% per year, on average, over the past decade, while expenditures
on infrastructure, general government, higher education (including community col-
leges and public universities), and resource protection (including agriculture) have all
declined. Much of the appropriations in the “general government” category go to
revenue sharing, which is the allocation of a share of state sales tax revenue to local
governments. (The Constitution requires a given amount of revenue sharing, but
there is also a discretionary component.) State appropriations for revenue sharing
decreased one-third from $1.5 billion in 2002 to $1.0 billion in 2010, accounting for
all of the decline in this category.
GOVERNMENT
EMPLOYEES
In Michigan, the public sector (including all state, local, federal, military, and public
school employees) made up 15% of the state’s workforce in 2010. In that year, the
state government employed 50,615 classified and almost 3,000 unclassified (e.g.
judges, elected officials) workers. In addition, there are approximately 400,000 local
government employees in the state.
3
Between 1990 and 2010 the number of classi-
fied state employees fell by almost a quarter. Meanwhile, the number of local gov-
ernment employees peaked in 2003 and has since nearly returned to 1995 levels.
DIFFERENCE IN
PUBLIC AND
PRIVATE SECTOR
COMPENSATION
Real (inflation-adjusted) compensation of state and local government employees
(including salary, wages, and benefits) has increased during the last 10 years while
real private sector compensation has declined. Between 2000 and 2009, compensa-
tion of the average private sector worker fell 4% while it increased 19% for state gov-
ernment employees and 13% for local government employees (local government
employees includes teachers and other employees of school districts).
Figure 8 on the following page
shows the average compensa-
tion of private sector workers,
state government employees,
and local government employ-
3. Local government employees and compensation are from the U.S. Bureau of Economic Analysis
Regional Economic Information System data for 2009.
Public Sector Employment in Michigan, 1990-2009
%
Change
Since
1990:1990 1995 2000 2005 2009
Local Government (including
public school employees)
388,144 400,634 443,061 446,807 407,693 5%
State Government 66,791 62,672 61,493 52,614 51,699 -23%
Sources: Michigan Civil Service Commission, Annual Workforce Reports; Bureau of Economic Analysis,
Regional Economic Information System
Analysis: Anderson Economic Group, LLC
Average annual compensation of state employees
(including salary, wages, and benefits) was over
60% higher than average annual compensation of
private sector workers in 2009.
How Taxpayer Money Is Spent: Government Revenues and Expenditures
2011 Citizen’s Guide to Michigan’s Financial Health 10
ees. While average compensation for local and state government workers has
grown, there has not been a corresponding increase in private sector compensation
to support this growth.
FIGURE 8. State Employee Average Compensation Exceeds That of the Private Sector
The averages presented above show the growing disparity in private and public sec-
tor compensation. In 2000, average public sector compensation was 31% higher than
average private sector compensation. In 2009, state classified employee compensa-
tion was 63% higher, on average, than the private sector. This analysis only com-
pares average compensation and does not compare private and public sector
employees with similar jobs, years of experience, or education.
We are using total wage employment for both sectors, which includes both part-
time and full-time workers. The data shown here for private sector compensation is
average compensation for all non-farm wage employment in the private sector in
Michigan. State employee compensation includes only compensation for classified
workers. The state has nearly 3,000 unclassified workers (people who are elected or
appointed to their position) who make more than classified state employees, on
average, so including these workers would result in a higher amount for average
state employee compensation. For example, unclassified workers include the gover-
nor (salary of $159,300), Michigan Supreme Court justices (salary of $164,610) and
state legislators (salary of $71,685 and higher).
4
$0
$10,000
$20,000
$30,000
$40,000
$50,000
$60,000
$70,000
$80,000
$90,000
2000
2001
2002
2003
2004
2005
2006
2007
2008
2009
Compensation (in 2009 $)
Private Sector Employees
Local Government Employees
State Government Employees
2009 Avg. Comp.
State: $85,076
Local: $57,333
Private: $52,365
Note: Employee compensation includes salary, wages, pension benefits, and health insurance benefits.
Source: Local government data and private sector data are from the Regional Economic Information Systems, Bureau of Economic
Analysis. State government data is from the Michigan Civil Service Commission Annual Workforce Report, 1990-2009. Inflation as
determined using the Consumer Price Index for All Urban Consumers, All Items reported by the Bureau of Labor Statistics.
Analysis: Anderson Economic Group, LLC
Revised: See the “Revisions” section at the end of this report for further information.
How Taxpayer Money Is Spent: Government Revenues and Expenditures
2011 Citizen’s Guide to Michigan’s Financial Health 11
Real growth in state employee compensation over the past decade has occurred
almost exclusively through growth in the cost of employee benefits, including active
employee health care, retiree health care, and pensions. In 2009, the average annual
state employee salary was $53,453 and average benefits were $31,623. Figure 9
shows that average salaries for state employees have stayed fairly constant at just
over $50,000 (in real terms) since 2000. In that same time period, benefit costs have
grown from almost $20,000 to almost $32,000 per employee.
FIGURE 9. Benefits Are the Primary Source of Growth in Average State
Employee Compensation
4. “Salaries and Expense Allowances for Positions Subject to SOCC Recommendations, 2011,” Michigan
Civil Service Commission, State Officers Compensation Commission.
$-
$10,000
$20,000
$30,000
$40,000
$50,000
$60,000
2000
2001
2002
2003
2004
2005
2006
2007
2008
2009
Compensation (in 2009 $)
State Employee Salaries
State Employee Benefits
Note: Data is for classified state employees only.
Source: Michigan Civil Service Commission Annual Workforce Reports, Bureau of Labor Statistics
Seasonally-Adjusted Consumer Price Index for All Urban Consumers, All Items to adjust for inflation.
Analysis: Anderson Economic Group, LLC
Revised: See the “Revisions” section at the end of this report for further information.
Michigan’s Fiscal Health
2011 Citizen’s Guide to Michigan’s Financial Health 12
Michigan’s Fiscal Health
In order to spend at current levels, Michigan governments have:
1. Drawn down reserves
2. Borrowed money
3. Increased unfunded pension and other retirement liabilities
RESERVES AND
MAJOR FUND
BALANCES
In recent years, governments and schools have drawn down their financial reserves
or depleted their savings to support current spending levels. State and school
reserve levels are presented in Figure 10 below. Aggregate local government reserve
information is not available on a statewide basis.
State Government Reserves. It is considered good practice to keep around 10% of
annual operating expenditures in unrestricted fund balances to cover new, unex-
pected expenses or an unanticipated drop in revenue.
5
This is the state’s equivalent
of a cookie jar on the counter, or money in a savings account for unexpected needs.
The State of Michigan had almost $720 million in unrestricted fund balances in its
major funds in FY 2010. That is 1.5% of total expenditures from those funds—well
below the recommended 10%.
School Reserves. In FY 2004, public school districts had unrestricted reserves equiva-
lent to over 10% of operating expenditures. Over the past few years, they have drawn
down these reserves, bringing the reserve level to 5% last year.
FIGURE 10. Government Savings Depleted, FY 2010
5. There is some disagreement as to the best level of reserves for government funds. The Government Finance Offi-
cers Association (GFOA) recommends 2 months ‘worth (or about 17%) of reserves, while the National Association
of State Budget Officers (NASBO) recommends a level of 5%. For the analysis shown here, we have chosen a level
of 10%.
1.5%
5.2%
0%
2%
4%
6%
8%
10%
12%
State of Michigan
Michigan Schools
RECOMMENDED RESERVES
Source: Michigan CAFR; Department of Education Michigan Bulletin 1011
Analysis: Anderson Economic Group, LLC
Michigan’s Fiscal Health
2011 Citizen’s Guide to Michigan’s Financial Health 13
MICHIGAN’S
“RAINY DAY FUND”
The state’s “Rainy Day Fund” (offi-
cially, the Budget Stabilization
Fund), is designed to help the state
weather challenging economic peri-
ods or unforeseen emergencies.
During good economic times money is put into the fund and during poor times,
money is drawn out to fund government expenditures. The Budget Stabilization
Fund had $1.2 billion in it in FY 2000, but just $2.2 million by FY 2005. The fund
remains at that level today. At $2.2 million, the balance in the “Rainy Day Fund” is
not enough to cover the cost of state government operations for 30 minutes. See
Figure 11 below.
FIGURE 11. Michigan Rainy Day Fund Balance Has Dropped Significantly
CASH ON HAND
AND INTERNAL
BORROWING
The General Fund and the School Aid Fund do not have cash on hand. The state
takes out short-term loans to pay current bills. In order to make scheduled pay-
ments for services, the state government has begun borrowing through short-term
general obligation loans that have to be paid back within the fiscal year. In eight of
the last nine years, the State of Michigan borrowed over $1.2 billion at the beginning
of the fiscal year that it paid back with interest at the end of the fiscal year. The Con-
stitution requires that short-term state borrowing in any given year must not
exceed 15% of unrestricted state revenues from the previous year.
As shown in Figure 12 on page 14, the State had a positive cash balance in major
funds until 2002, but has borrowed to make payments each year since 2004, result-
ing in a negative cash balance. A negative cash balance occurs when a fund currently
owes more money to other funds and entities than it has in cash on-hand.
At the current level of $2.2 million, the balance
in the state’s “Rainy Day Fund” is not enough to
cover the cost of state government operations
for 30 minutes.
$-
$200
$400
$600
$800
$1,000
$1,200
$1,400
1990
1995
2000
2005
2010
Fund Balance (millions of $)
Analysis: Anderson Economic Group, LLC
Annual Report, FY 2008-09
Source: Michigan Senate Fiscal Agency; Michigan Department of Treasury
Michigan’s Fiscal Health
2011 Citizen’s Guide to Michigan’s Financial Health 14
FIGURE 12. The State’s Negative Year-End Cash Balances, FY 2000-FY 2010
The School Aid Fund has ended
the fiscal year with no cash on
hand each year for the past ten
years. In order to continue fund-
ing schools in Michigan, cash is
diverted from other state funds
into the School Aid Fund. In other words, each year school operations continue only
because money that had originally been designated for other purposes is tempo-
rarily re-routed into the School Aid Fund. The State’s General Fund has had similar
problems. A the end of 2001, the General Fund had over $1 billion in cash. By 2003,
that amount had dropped to $7 million and has stayed roughly the same ever since.
PUBLIC
BORROWING
State Government Debt
Governments and schools do not always have the cash on hand to pay for large proj-
ects like new buildings or even to make scheduled payments. Like households, gov-
ernments borrow to pay for larger expenditures, or to deal with cash-flow problems.
In FY 2010, the State of Michigan had over $1.6 billion in outstanding general obliga-
tion debt, borrowed mostly for loans to school districts and environmental protec-
tion projects. In addition, the State had $5.5 billion in outstanding special revenue
bond debt, and public authorities created by the State had $16.6 billion in outstand-
ing special revenue bond debt in FY 2010. (Public authorities are independent gov-
ernment entities with designated revenue streams, so if they fail to repay their debts,
the state taxpayers are technically not on the hook for the shortfall.) Figure 13 on
page 15 shows these three types of state debt.
-$2,000
-$1,000
$0
$1,000
$2,000
$3,000
2000
2002
2004
2006
2008
2010
Major Fund Cash Balance (millions of $)
Note: Major funds are the General Fund, School Aid Fund, and Budget Stabilization Fund
Analysis: Anderson Economic Group, LLC
Source: Michigan Department of Treasury, Annual Report, FY 2008-09
Each year, school operations continue only
because money that had originally been desig-
nated for other purposes is temporarily re-routed
into the School Aid Fund.
Michigan’s"Fiscal"Health
2011"Citizen’s"Guide"to"Michigan’s"Financial"Health 1
FIGURE 13. Debt "Owed"by"State"Government"Grew,"FY"2001どFY"2010
The"state"has"borrowed"money"at"a"faster"pace"than"personal"incomes"have"grown"
over"the"past"20"years."Thelevelofstatedebtperpersonhasincreasedfrom$724
perpersonin1979(in2010dollars)toover$2,430perMichiganresidentin2009(in
2010dollars),asFigure 1shows.
FIGURE 14. Debt "Far"Outpaces"Income,"FY"1979どFY"2009
$-
$2
$4
$6
$8
$10
$12
$14
$16
$18
2001 2002 2003 2004 2005 2006 2007 2008 2009 2010
billions of $
General obligation bonds
Revenue bonds issued by state
Revenue bonds issued by public authorities
Source:"Michigan"CAFR
Analysis:"Anderson"Economic"Group,"LLC
Note:"The"shift"from"state"revenue"bonds"to"public"authority"bonds"in"2010"was"due"to"the
reどcategorization"of"the"Tobacco"Settlement"Finance"Authority,"which"carries"approximately
$1.1"billion"in"debt,"as"part"of"an"independent"public"authority.
ŽƚĂůĞƚĂŝƚĂ /ĞƌƐŽŶĂů/ŶĐŽŵĞĂŝƚĂ
ϭ
ϭ
ϭϵϳϵ
ϭϵϭ
ϭϵ
ϭϵ
ϭϵϳ
ϭϵϵ
ϭϵϵϭ
ϭϵϵ
ϭϵϵ
ϭϵϵϳ
ϭϵϵϵ
ϭ
ϳ
ϵ
Dď
ŽƚĂůĞƚĂŝƚĂ /ĞƌƐŽŶĂů/ŶĐŽŵĞĂŝƚĂ
Source:"State"of"Michigan,"Michigan"Department"of"Treasury,"Annual"Reports
Analysis:"Anderson"Economic"Group,"LLC
Note:"Total"debt"includes"state"general"obligation"debt,"stateどbacked"revenue"dedicated"debt,"and
debt"issued"by"stateどcreated"public"authorities.
Michigan’s Fiscal Health
2011 Citizen’s Guide to Michigan’s Financial Health 16
State public debt (including debt issued
by state-created public authorities)
compared to annual state tax revenue
is shown in Figure 15, adjusted for
inflation. State revenue from taxes used to be almost twice as much as the state’s
outstanding debt, but debt has grown while tax revenue has fallen. Today, outstand-
ing state debt levels are greater than annual state tax revenue.
FIGURE 15. State Tax Revenue Compared to Total State Government Debt,
FY 1995-FY 2010
Local Government and School Debt
Local governments and school districts also take on short- and long-term debt. They
take on short-term debt primarily for cash-flow reasons, and long-term debt in order
to fund schools, utilities, and larger projects. Similar to the State, local government
debt has increased considerably over the past decade. Combining school districts,
municipalities, and local special districts (such as waste management districts, spe-
cial assessment districts, etc.), total debt outstanding at the end of 2008 was $46.7
billion (in 2010 dollars), up from $35.1 billion in FY 2000 (in 2010 dollars).
Total Government Debt
Total government debt (local governments + school districts + state) has grown from
$52 billion in FY 2000 to almost $70 billion in FY 2008 (in 2010 dollars). Adjusting for
inflation, this is almost a 35% increase over eight years. As shown in the following
table, local government and schools increased their debt by a third during this time
period, while state debt increased by 40%.
The level of state debt per person has
increased from $724 per person in 1979 to
over $2,431 per Michigan resident in 2009.
ŝůůŝŽŶŽΨ
ď
ŝůůŝŽŶŽΨ
ď
Analysis: Anderson Economic Group, LLC
Source: Michigan Department of Treasury, Annual Reports; Michigan Senate Fiscal Agency
Michigan’s Fiscal Health
2011 Citizen’s Guide to Michigan’s Financial Health 17
PENSION AND
RETIREE HEALTH
CARE OBLIGATIONS
FOR PUBLIC
EMPLOYEES
Michigan has not adequately funded its future retirement obligations for public
employees. Public employees who meet certain requirements, such as years of ser-
vice and age, receive a pension when they retire. Many also have the option to enroll
in a retiree health care program.
Public Pension Benefits
Pension benefits are pre-funded by contributions from employers (governments or
school districts) and employees, who often need to contribute a certain percentage
of their salary. There are three principal statewide pension systems: the Michigan
Public School Employees Retirement System (MPSERS), the Michigan State Employ-
ees Retirement System (MSERS), and the Municipal Employees Retirement System
(MERS). MPSERS and MSERS are managed by the State of Michigan, while MERS is an
independent public corporation, overseeing a retirement fund for local governments
across the state. The largest pension system in Michigan, by far, is MPSERS (for pub-
lic school employees) which has over $30 billion in net assets and serves 440,000
active and retired employees.
Investment returns for these systems
have been very poor the past few years.
In 2008 and 2009, state and local retire-
ment systems lost a combined $15 bil-
lion in net investments before gaining
about $5 billion in 2010. Benefits paid to
retirees, on the other hand, have continued to rise from year to year. Total pension
benefits paid by the state have risen by 4.8% per year while local government pen-
sion benefits have risen by 4.3% per year since 2000, after adjusting for inflation.
Each of these funds remains solvent, but pension funds are only properly funded
when current contributions are enough to meet expected future payments for
today’s employees. The combination of quickly rising benefits, poor market condi-
tions, and stagnant or slowly rising contributions have made for a considerable
shortfall in funding for future public sector pension obligations.
Total Government Debt Grew, FY 2000-FY 2008 (in 2010 $)
2000 2008
Average Annual
Increase,
2000-2008
State Government $16.7 billion $23.5 billion 4.4%
Local Governments
and Public Schools
$35.1 billion $46.7 billion 3.6%
TOTAL $51.8 billion $70.2 billion 3.9%
Source: State Treasurer Report, U.S. Census of Governments State and Local
Finance Survey
Analysis: Anderson Economic Group, LLC
Note: Total debt includes state GO debt, state-backed revenue dedicated debt,
debt issued by public authorities, and local governments and public school-debt.
Quickly rising benefits, poor market condi-
tions, and insufficient contributions have
resulted in a total state and local pension
fund shortfall of at least $18.2 billion.
Michigan’s Fiscal Health
2011 Citizen’s Guide to Michigan’s Financial Health 18
FIGURE 16. Shortfall in Funding of Public Pension Systems in Michigan
Figure 16 shows the present value of total future obligations for the largest public
retirement funds in Michigan compared to the appraised value of the funds’ assets.
When future obligations exceed the value of the funds’ assets, the fund has a short-
fall. Worsening market conditions and insufficient contributions have combined to
result in a total state and local pension fund shortfall of at least $18.2 billion.
Retiree Health Care Benefits
Each of the retirement systems mentioned in the previous section also funds retiree
health care. These benefits are pay-as-you-go, meaning they are not pre-funded.
Unlike state pensions, these benefits are not guaranteed by the State Constitution.
MERS, which serves local governments across Michigan, just started its retiree health
benefits programs in 2004. The MERS health care fund now has $217 million in net
assets, but only paid out $6.6 million in benefits in 2009 since only a few enrollees
have retired. In 2010, MSERS and MPSERS paid out $330.5 million and $650.7 mil-
lion, respectively, in retiree health benefits. Since MSERS and MPSERS health care
benefits are not pre-funded, their unfunded future obligations are significant, at
$12.6 billion and $27.6 billion, respectively. Detroit paid $300 million in retiree
health care benefits in 2010, but maintained a fund balance of only $6 million for
retiree health care. All future liabilities for retiree health care in Detroit, an estimated
$5 billion, are unfunded.
UNEMPLOYMENT
INSURANCE
BENEFITS
After years of high unemployment, Michigan’s Unemployment Compensation Fund
is broke. Unemployment compensation funds are funded through Michigan
employer taxes and federal dollars. The federal government currently pays for all
$40
$45
$50
$55
$60
$65
$70
$75
$80
$85
$90
2000
2001
2002
2003
2004
2005
2006
2007
2008
2009
billions of $
Total pension
obligations
Shortfall in pension
funding
Value of pension
assets
Unfunded Pension Liabilities
(at end of FY 2009)
State Government: $3.1 billion
Local Government: $3.1 billion
School Districts: $12.0 billion
Analysis: Anderson Economic Group, LLC
Source: Comprehensive Annual Financial Statements for MSERS, MPSERS, MERS, DGRS, and DPFRS
Michigan’s Fiscal Health
2011 Citizen’s Guide to Michigan’s Financial Health 19
extended unemployment benefits (all benefits beyond 26 weeks, and up to 99
weeks). When states are no longer able to fund their own unemployment insurance,
the federal government offers loans. Ideally, the funds increase during good times so
that they are large enough to handle the drain from high unemployment during
recessions. However, these funds are not intended to handle an entire decade of
high unemployment, which the state of Michigan has recently experienced.
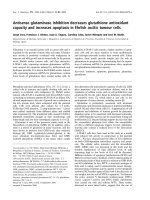
As shown in Figure 17, the last
time that Michigan’s Unemploy-
ment Compensation Fund
received more payments from
employers and the federal gov-
ernment than it paid out to the unemployed was in 2000. At the end of that fiscal
year, the fund had a surplus of $3.3 billion. In 2008, after 7 consecutive years of an
unemployment rate in Michigan at or above 7%, the fund became insolvent, surviv-
ing since then only due to loans from the federal government.
FIGURE 17. Michigan Unemployment Trust Fund Insolvent
In 2009 and 2010, as the statewide unemployment rate rose to over 14%, Michigan
borrowed $3.5 billion from the federal government in order to continue making pay-
ments on unemployment insurance claims. By the end of 2010, Michigan’s unem-
ployment trust fund was in the red by $3 billion.
Until now, the state government has not had to pay interest on these loans, but inter-
est will be charged this year, barring Congressional action. Also, the state enforces a
special tax on some businesses whenever its unemployment insurance fund is insol-
vent. This tax had been postponed due to the poor economy, but will begin this year.
In 2009 and 2010, Michigan borrowed a combined
$3.5 billion from the federal government in order
to continue making payments on unemployment
insurance claims.
$(4)
$(2)
$-
$2
$4
$6
$8
2000
2002
2004
2006
2008
2010
billions of $
Unemployment claims
paid
Employer contributions
Federal contributions
Federal loans minus
repayment
Unemployment fund
balance
Sources: Michigan Comprehensive Annual Financial Reports
Analysis: Anderson Economic Group, LLC
Michigan’s Fiscal Health
2011 Citizen’s Guide to Michigan’s Financial Health 20
MICHIGAN’S
CREDIT RATING
Michigan maintains a sound credit rating despite its challenges. The credit-worthi-
ness of the State of Michigan is assessed by three rating agencies: Standard and
Poor’s, Moody’s, and Fitch. The market assesses the budget practices of the State
and determines whether it believes Michigan has the ability to re-pay its debts. A
ranking of AA or AAA is considered a secure, or high-quality investment. The State of
Michigan had a AAA rating in 2000. Since then its ratings have slipped a bit to AA-,
according to Standard & Poor’s, but Michigan is still considered a high-quality invest-
ment. This is critical, as the state’s credit rating affects the cost of borrowing, and
local units of government rely on the state’s credit rating when securing financing.
A WIDENING
PUBLIC BUDGET
GAP
A deficit is the extent to which expenses exceed revenues in a given year. However,
state and local governments have unfunded obligations that are not recognized in
their deficits—namely, unfunded pensions and retirement health benefits are not
recognized as liabilities and therefore not included in the budget surplus or deficit
figure. Though governments have not fully funded these obligations, they will even-
tually have to pay for them since the Michigan Constitution guarantees pensions
(but not retiree health benefits) for public employees. We present an alternative
measure to the budget deficit called the public budget gap.
To measure the public budget gap in any given year, one adds any new unfunded
obligations for pensions or retiree health benefits accrued during the year to current
expenses.
6
This gives the total amount needed to fully fund state and local govern-
ments’ obligations for the fiscal year. Subtracting these new “expenses” from reve-
nues gives the public budget gap for that year. For FY 2009, the deficit for the State of
Michigan (derived by subtracting expenses from revenues) was $3.8 billion and for
local governments was an estimated $1.0 billion. Accounting for unfunded pensions
and unfunded retiree health benefits, the public budget gap was $8.3 billion in 2009
for the state and $1.9 billion for local governments. This is the amount of new
unfunded liabilities and uncovered expenses accrued during that year, as shown in
the table below.
6. In deriving the public budget gaps presented here, for local governments, unfunded retiree health care obliga-
tions are not included due to data limitations. Pre-2006, state retiree health care obligations are estimates.
Michigan’s Public Budget Gap in FY 2009 (millions of $)
State
Government
Local
Governments TOTAL
Surplus / (Deficit) ($3,826) ($1,024) ($4,850)
- New Unfunded
Pension Obligations
($3,893) ($912) ($4,805)
- New Unfunded Health
Care Obligations
($602) n/a ($602)
PUBLIC BUDGET GAP ($8,320) ($1,936) ($10,256)
Sources: See Figure 17 notes
Michigan’s Fiscal Health
2011 Citizen’s Guide to Michigan’s Financial Health 21
Public budget gaps for each year between 2001-2009 are shown in Figure 18 for
state and local governments. The large negative public budget gaps in years 2002
through 2005 were mainly due to the state under-funding its pensions. In each of
these years, state pensions added $2 to $4 billion in unfunded obligations. In 2006
and 2007, the state actually had a surplus using the public budget gap measure
because the state lowered its unfunded pension obligations by a combined $5 billion
in those two years.
FIGURE 18. The Public Budget Gap Widens for State & Local Governments
Cumulative Public Budget Gap
Public budget gaps are like deficits in
that, over time, they accumulate. For
example, if the state has two consecutive
years with a public budget gap of $5 bil-
lion in each year, that means that state
government has underfunded its obligations and expenses by a total of $10 billion
over those 2 years. The state’s cumulative public budget gap, accrued over its his-
tory, can be estimated by subtracting all of the state’s unfunded pension and retiree
health care obligations from the state’s net equity. By the end of 2009, the net
equity of the state government stood at $11.7 billion. If the state government were
to recognize appraised pension obligations and contractually-promised retiree
health care obligations on its balance sheet, the State would need to subtract $55
billion from its net equity to arrive at the State’s cumulative public budget gap of
$43.3 billion at the end of 2009.
$(10)
$(8)
$(6)
$(4)
$(2)
$-
$2
$4
2001
2002
2003
2004
2005
2006
2007
2008
2009
billions of $
State Government
Local Governments
data limitations. Pre-2006 retiree health care obligations for the state are estimated due to dat
a
Note: Unfunded obligations for local government retiree health care are not included due to
Analysis: Anderson Economic Group, LLC
State and Local Finance Survey, AEG estimates
Sources: State of Michigan CAFR, CAFRs for state and local pension plans, U.S. Census Bureau
limitations. Unfunded public school teacher pensions and retiree health care are included in
“State Government” because the state government is constitutionally or contractually obligated
to provide these benefits.
The State government had a cumulative
public budget gap at the end of FY 2009 of
$43.3 billion.
How This Report Was Developed
2011 Citizen’s Guide to Michigan’s Financial Health 22
How This Report Was Developed
The goal of this report was to provide the public with as much information as possi-
ble on the revenues, expenditures, and other financial activities of state and local
governments. On behalf of Governor Rick Snyder, Business Leaders for Michigan
commissioned this report from Anderson Economic Group. A special note of appreci-
ation is extended to the following organizations, who also contributed to the design
and content of this report:
• Citizens Research Council of Michigan
• Michigan Association of Certified Public Accountants
• Michigan Government Finance Officers Association
DATA SOURCES
AND NOTES
State government data is from the Michigan Comprehensive Annual Financial Report
(CAFR), the FY 2009 Annual Report of the Michigan State Treasurer, and the CAFRs of
the public pension systems (MERS, MPSERS, and MSERS). Historical state appropria-
tions data is from the Michigan Senate Fiscal Agency. The Michigan Department of
Treasury provided FY 2010 unaudited Michigan Comprehensive Annual Financial
Report (CAFR) information on state revenues, expenditures, reserves, and debt.
Local government data is from U.S. Census of Governments State and Local Finance
survey. We reviewed local government data provided to the Michigan Department
of Treasury, but found it to be inconsistent year-to-year, and thus relied on the U.S.
Census data. This too has its problems as it is unaudited survey data compiled by the
Census. We used the Department of Education Bulletin 1011 data for local schools.
The information presented is the most recent data available by fiscal year. For most
indicators, this is FY 2010. For the state government, the fiscal year runs October 1 to
September 30 while local governments vary. While the goal is to present the same
information for all public entities, local data limitations prevented us being able to
do this for all measures.
OTHER SOURCES
AND LINKS
This report, along with a detailed supplemental data and methodology appendix, can
be found at
www.michigan.gov/budget. For other information about state govern-
ment funding, please refer to the following resources:
• Michigan Comprehensive Financial Report
( />• Annual Report of the Michigan State Treasurer
( />• Michigan House Fiscal Agency
( />• Senate Fiscal Agency
(www. />• Citizens Research Council of Michigan
(www.crcmich.org)