This Time is Different, Again? The United States Five Years after the Onset of Subprime potx
Bạn đang xem bản rút gọn của tài liệu. Xem và tải ngay bản đầy đủ của tài liệu tại đây (58.58 KB, 9 trang )
1
October 14, 2012
This Time is Different, Again? The United States Five Years after the Onset of Subprime
Carmen M. Reinhart and Kenneth S. Rogoff, Harvard University
Five years after the onset of the 2007 subprime financial crisis, GDP per capita in the
United States remains below its initial level. Unemployment, although down from its peak, is
still hovering near 8 percent. Rather than the V-shaped recovery that is typical of most post-war
recessions, growth has been slow and halting. Based on our research (Reinhart and Rogoff,
2009), this disappointing performance should not be surprising. We have presented evidence that
recessions that are associated with a systemic banking crises tend to be deep and protracted and
that this pattern is evident across both the historical and cross country experience. Subsequent
academic research using different approaches and samples have found similar results.
1
Recently, however, a few op-ed writers have argued that in fact, the United States is
“different.” International comparisons are not relevant because of profound institutional
differences from other countries. A recent spate of op-ed writers, including Hevin Hassett and
Glenn Hubbard, Michael Bordo and John Taylor, have stressed that the United States is also
“different” in that recoveries from recessions associated with financial crises have been rapid and
strong. Their interpretation is at least partly based on a study by Bordo and Haubrich (2012),
which examines the issue for the US since 1880.
In this note, we question their “interpretation” of the US historical track record, which is
incorporated in Reinhart and Rogoff (2009), where we present results of 224 historical banking
crises from around the world, including pre-2007 banking crises in the United States. Perhaps
part of the confusion in the recent “US is different” op-eds is a failure to distinguish systemic
financial crises from more minor ones and from regular business cycles. A systemic financial
crisis affects a large share of a country’s financial system. They are quite distinct from less
severe events that clearly fall short of a full-blown systemic meltdown, and are referred to in the
literature as “borderline” crises. The distinction between a systemic and a borderline event is
well established according to widely accepted criteria and is clear in both our work and that of
other scholars.
2
Indeed, in our initial paper on this topic (Reinhart and Rogoff, 2008), we
showed that systemic financial crises across advanced economies had far more serious economic
consequences than borderline crises. Our paper, written nine months before the collapse of
Lehman in September 2008, showed that by 2007, United States already shared many of the key
recurring precursors of a systemic financial crisis: a real estate bubble, high levels of debt,
chronically large current account deficits, and signs of slowing economic activity. Today, there
can be little doubt that the United States has experienced a systemic crisis.
3
This is, in fact, the
1
See Claessens, Kose and Terrones, (2011) Papell and Prodan (2011), and Reinhart and Reinhart (2010). Jorda,
Schularick, and Taylor, (2012) study of credit over 1870-present in 14 advanced economies and document the
differences in recession-recovery patterns between regular business cycles and crises of different severity.
2
See Caprio and Klingbiel, 1996, Kaminsky and Reinhart, 1999, Reinhart and Rogoff (2009) as well as several
contributions from Laeven and Valencia—the latest dated June 2012.
3
The interested reader is referred to a longer version of our note which discusses and defines these crises concepts
along the lines conventionally accepted in both academic and policy circles for further clarification and definition.
2
first systemic financial crisis the United States has experienced since the Great Depression.
Before that, notable systemic post-Civil War US financial crises include those dated in 1873,
1893 and 1907.
But also important is how a recovery is measured, and how success is defined. The
recent op-eds focus on GDP growth immediately following the trough (usually 4 quarters). For
a normal recession, the restoration of positive growth is typically a signal event. In a v-shaped
recovery, the old peak level of GDP is quickly reached, and the economy returns to trend within
a year or two. In Reinhart and Rogoff (2009), we examine both levels and rates of change of per
capita GDP; recovery is defined by the time it takes for per capita GDP to “recover” or return to
its pre-crisis peak level.
4
For post-WWII systemic crises it took about 4 ½ years to regain lost
ground;
5
in 14 Great Depression episodes around the world (including the US) it took 10 years
on average. A focus on levels is a more robust way to capture the trajectory of an economy
where the recovery is more U or nearly L-shaped than V-shaped. It also avoids exaggerating the
strength of the recovery when after a deep recession there is a large cumulative decline in the
level GDP. An 8 percent decline followed by a subsequent 8 percent increase does not bring the
economy back to its starting point. Taylor’s chart shows the recovery from the Great Depression
as the strongest in the history of the United States, even though (as we show in our book) it took
about a decade for the US to reach the same level of per capita income as its starting point in
1929.
Working with long historical series we have stressed per capita measures, as US
population growth has fallen from 2-2.5 percent per annum in the late 1800s to less than one
percent in more recent times. Put differently, in the early 1900s a year with 2 percent real GDP
growth left the average person’s income unchanged; in the modern context, 2 percent annual
GDP growth means slightly more than one percent increase in real income per person.
Population growth changes over time are even more pronounced in other countries. The impact
of cumulative population growth even within an individual crisis episode is significant, as the
recovery process usually spans 4-10 years.
Even allowing for all the above issues does not seem to entirely account for differences in
our interpretation of the facts from the Hassett-Hubbard, Bordo and Taylor op-eds. The narrative
in the Bordo Haubrich paper emphasizes that “the 1907-1908 recession was followed by
vigorous recovery,.” The Panic of 1907 does indeed fit the standard criteria of a systemic crisis
(and one with a global dimension at that). Yet, as we review below, the level real GDP per capita
in the US did not return to its pre-crisis peak of 1906 until 1912. Is this a vigorous recovery?
The US unemployment rate (not examined in the Bordo-Haubrich study) was 1.7 percent in 1906
and climbs to 8 percent in 1908 does not return to the pre-crisis low until 1918. The aftermath of
the systemic banking crisis of 1893 is worse than the 1907 episode, and the Depression of the
1930s is worse still. According to our (2009) metrics, the aftermath of the US financial crisis has
been quite typical of post-war systemic financial crises around the globe. If one really wants to
4
See Chapter 14 on the Aftermath of Financial Crises.
5
Papell and Prodan (2011) make the point it takes even longer to return to trend (or potential) GDP levels.
3
focus just on United States systemic financial crises, then the recent recovery looks positively
brisk.
Summary of Findings
We first focus on four previous systemic financial crises that the United States has
experienced since 1870. These include the crisis of 1873 (called the Great Depression until the
1930s), the 1893 crisis, the panic of 1907, and the Great Depression. Given that all of the earlier
crises predate the creation of deposit insurance in 1933, and that three of the four crises predate
the establishment of a central bank in the United States, one could well quibble about the claim
that the relevant institutions are more comparable across centuries in the United States than
across advanced countries over the last thirty years. Be that as it may, the comparison across
systemic US financial crises does not: (i) support the view that the US recoveries from pre-
WWII systemic crises were any swifter than the general cross-country pattern and (ii) that the
US has fared worse this time around than in previous systemic crises. Standard errors have to be
taken with a grain of salt for such small sample. On the whole, however, the conclusion would
have to be that in the five years since the onset of the financial crisis the United States has
performed better in terms of output per capita and unemployment than in the previous crises,
even if one excludes the Great Depression.
The reader will note that our comparisons relate to the period dating from the onset of the
crisis, and do not delineate between the “recession” period and the “recovery” period. Elsewhere
we have explained why this distinction is somewhat meaningless in the aftermath of a financial
crises, where false dawns make it very difficult to detect the start of an ultimate recovery in real
time. That is why we have consistently argued that the popular term “Great Recession” is
something of a misnomer for the current downturn, which we have argued would be better
thought of as “the Second Great Contraction” (after Friedman and Schwartz’s characterization
of the Great Depression as the Great Contraction.)
Secondly, we assess how has the US has fared, so far, compared to other advanced
economies countries that experienced systemic financial crises in 2007-2008 as well other
advanced economies that experienced borderline episodes. Focusing on real per capita GDP,
we show (i) the recent crises patterns confirm our earlier result that the countries that recently
suffered systemic financial crises have generally fared quite poorly compared to countries where
the financial problem was less severe, that is, borderline
6
, and (ii) although tracking worse than
the countries that did not have systemic financial crises, the United States output performance is,
in fact, among the best of those that did.
US Historical episodes
As in our work on the aftermath of financial crisis (Reinhart and Rogoff, 2009), we start
our analysis by anchoring the crisis episode at the peak of economic activity, which usually
6
We do note that for the cases of Italy and Portugal, which experienced not only borderline financial crises but full-
on fiscal crises, the performance has been steadily worsening as well. The typical borderline banking crisis has
seldom been accompanied by an incipient sovereign debt crisis.
4
occurs either the year immediately before the crisis or the crisis year. For real per capita GDP we
use the Total Economy Database, a multi-country database originated by Angus Maddison and
now updated by the Conference Board: the most recent annual observation is 2011. The US data
is available from 1870 onward. For US unemployment the data is taken from the Historical
Statistics of the Unites States, where the unemployment rate series is available from 1890
onwards (and is consistent with the Bureau of Labor Statistics for the modern era.)
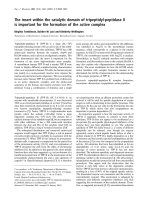
Figure 1 compares the still unfolding (2007) financial crisis to earlier US systemic
financial crises of 1873, 1892, 1907 and 1929. As the figure illustrates, the initial contraction in
per capita GDP is smaller for the recent crisis than in the earlier crises (even when the Great
Depression of the 1930s is excluded). Five years on, the current level of per capita GDP, relative
to baseline, is higher than the corresponding five-crisis average that includes the 1930s. The
recovery of per capita GDP after 2007 is also slightly stronger than the average for the systemic
crises of 1873, 1893 and 1907. Although not as famous as the Great Depression, the depression
of the 1890s paints a dismal picture; in 1896 real per capita GDP was still 6 percent below its
pre- crisis level in 1892.
So how many years did it take for per capita GDP to return to its peak at the onset of the
crisis? For the 1873 and 1893 (peak is 1892) crises it was 5 years; for the 1907 (peak is 1906)
panic 6 years and for the Depression 11 years. In output per capita timelines, at least, it difficult
to argue that “the US is different”. It can hardly be said to have enjoyed vigorous output per
capita recoveries from past systemic financial crises.
5
Figure 1. Real Per Capita GDP (levels) in the Aftermath of
Systemic Banking Crises in the United States, 1873-2011
Sources: Reinhart and Rogoff (2009), Maddison (2006), GDP per capita from Total Economy Database, Conference
Board.
Notes: Total GDP per capita in 1990 US dollars (converted at Geary Khamis PPPs).
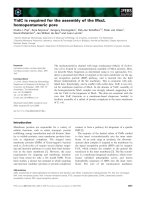
The notion the US exhibits rapid recovery from systemic financial crises does not emerge
from the unemployment data either. As we noted, the US unemployment rate data only begins in
1890, which eliminates the 1873 crisis from the pool. The aftermath of remaining four crises are
shown in Figure 2. The 2007 crisis is associated with significantly lower unemployment rates
than both the Depression of the 1930s and the depression of the 1890s; it is more in line with the
unemployment increases observed following the Panic of 1907. As shown in the inset to the
figure, the unemployment rate, which was 1.7 percent in 1906 was near 6 percent five years later.
In the 1892 crisis, the unemployment rate started at 3 percent in 1892, shot up to over 18 percent,
and still remained above 14 percent in 1896. In effect, the unemployment never dips back to
below 3 percent until 1906 (on the eve of the next crisis). The pattern during the Great
Depression of the 1930s, is off the charts (Eichengreen and O Rourke, 2010 is a must read on
this comparison). These historic US episodes are in line with the findings in Reinhart and
Reinhart (2010), who examine the decade after post-WWII severe/systemic financial crises in
5 systemic US banking crises avg:
1873, 1892 (peak is 1892)
1907 (peak is 1906), 1929, 2007
3 systemic US banking crises avg:
Excludes the 1930s and ongoing 2007
90
92
94
96
98
100
102
12345
Years since crisis onset, 2007=1
Average of
5 Systemic
US crises
2007
crisis
Average of
3 systemic
US crises
Index, peak year=100
6
both advanced economies and emerging markets and document that in 10 of the 15 episodes
examined the unemployment rate had not returned to its pre-crisis level in the decade following
the crisis. For the 1893 and 1929 Depression it was 14 years; for 1907 it was 12 years before the
unemployment rate went back to its pre-crisis level.
Figure 2. Average Annual Unemployment Rate in the Aftermath of
Systemic Banking Crises in the United States, 1892-2011
Sources: Bureau of Labor Statistics, Historical Statistics of the United States, and Reinhart and Rogoff (2009).
Notes: Average annual unemployment rates. The change from the level at the outset is the simple difference; for
example the unemployment rate in 2007 was 4.6 percent so the difference from 2011 (when the unemployment rate
is 9 percent) is 4.4 percent.
Cross-country real per capita GDP comparisons: 2007-2011
We next turn to comparisons between the US and other countries in the Second Great
Contraction. The simplest of cross-country comparisons involves dividing the post-2007 crisis
experience into two batches, those countries that experienced systemic banking crises and those
that had milder borderline problems in their financial sector (which does not preclude them from
having other serious “varieties” of crises, notably fiscal in this case.)
7
This applies the same
criteria as Reinhart and Rogoff (2008). Figure 2 presents the evolution of per capital GDP
normalized to equal 100 in 2007. The inset in the chart indicates which countries are included in
the averages for the systemic and borderline episodes.
7
See Laeven and Valencia (2012) for further details.
Unemployment rate
year
1892 1906 1929 2007
onset of
crisis 3.0 1.7 3.2 4.6
4 years
later 14.4 5.9 24.9 9.0
0
5
10
15
20
25
12345
Years since crisis onset, 2007=1
1906-1910
1929-1933
1892-1896
Unemployment
rate
change from
level at the
outset of
2007-2011
Percent
7
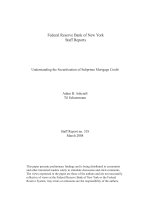
Figure 3. Real Per Capita GDP (levels): 2007-2011
Systemic and Borderline Crises in Advanced Economies
Sources: Laeven and Valencia (June 2012), Reinhart and Rogoff (2009), GDP per capita from Total Economy
Database, Conference Board.
Notes: Total GDP per capita in 1990 US dollars (converted at Geary Khamis PPPs). For further details on the
distinctions between numerous dimensions of the systemic-borderline distinctions since 2007, see Laeven and
Valencia (2012). Italy and Portugal post the weakest output performance among the borderline cases, as these
countries face additional concerns about their sovereign debt sustainability. For Austria, Germany, The Netherlands
and Switzerland peak per capita GDP was 2008. For all others the peak was 2007.
The pattern described in Reinhart and Rogoff (2008) for 1946-2006 crises is replicated in the
cross-country performance in the recent (2007-2011) crises: the systemic crises are associated
with deeper more protracted recessions than the borderline cases notwithstanding the fact that
some of the borderline banking crises cases (to-date
8
) involve serious fiscal crises as well,
including for example Portugal and Italy where growth and employment performance has been
miserable.
Note that the United States per capita GDP contraction since 2007 shows a comparable initial
decline as that recorded in the other European countries (since 2007) undergoing systemic
financial crises but a faster recovery in the subsequent years.
8
Borderline crises can and often deepen into systemic ones.
Systemic banking crises:
Austria,
Belgium, Denmark, Germany, Greece
Iceland, Ireland, Luxembourg, Netherlands
UK, US
Borderline banking crises:
France
Italy, Portugal, Sweden, Switzerland
94
95
96
97
98
99
100
101
12345
Years since crisis onset, 2007=1
Systemic
crises Average
Borderline
crises Average
United States
Index, 2007=100
8
1. Reflections
We have found that, while no two crises are identical, there are some robust recurring
features of crises that cut across time as well as across national borders. Common patterns as
regards the nature of the long boom-bust cycles in debt and their relationship to economic
activity emerge as a common thread across very diverse institutional settings. This, in fact, is
precisely a key if surprising takeaway from our 2009 book.
The most recent US crisis appears to fit the more general pattern that the recovery
process from severe financial crisis is more protracted than from a normal recession or from
milder forms of financial distress. There is certainly little evidence to suggest that this time was
worse.
Of course this does not mean policy is irrelevant. Quite the contrary, in the heat of the
recent financial crisis, there was almost certainly a palpable risk of a Second Great Depression.
However, although it clear that the challenges in recovering from a financial crises are daunting,
an early recognition of the likely depth and duration of the problem would certainly have been
helpful. It would have been helpful in assessing various options and their attendant risks. It is
not our intention here to closely analyze policy responses that frankly, may take years of analysis
to sort out. Rather, our aim is to clear the air that somehow the United States is different. The
latest US financial crisis, yet again, proved it is not.
References
Bordo Michael and Joseph Haubrich, “Deep Recessions, Fast Recoveries, and Financial Crises:
Evidence from the American Record,” NBER Working Paper 18194, June 2012.
Claessens, Stijn, M. Ayhan Kose and Marco Terrones, “Financial Cycles, What? How? And
When?” IMF Working Paper WP/11/76, April 2011.
Caprio, Gerald, Jr. and Klingebiel, Daniela, “Bank Insolvency: Bad Luck, Bad Policy, or Bad
Banking?” in Boris Pleskovic and Joseph Stiglitz (eds.), Annual World Bank Conference on
Development Economics, Washington, DC: The World Bank, 1996, 79–104.
Jorda, Oscar Moritz Schularick and Alan Taylor, “When Credit Bites Back: Leverage, Business
Cycles, and Crises,” mimeograph (October 2012).
Kaminsky, Graciela and Carmen M. Reinhart, “The Twin Crises: The Causes of Banking and
Balance of Payments Problems,” American Economic Review, Vol. 89 No. 3, June 1999, 473-
500.
Laeven, Luc and FabianValencia, “Systemic Banking Crises Database: an Update,” IMF
Working Paper WP/12/163, June 2012.
9
Papell, David H. and Ruxandra Prudan, “The Statistical Behavior of GDP after Financial Crises
and Severe Recessions,” Paper prepared for the Federal Reserve Bank of Boston conference on
“Long-Term Effects of the Great Recession,” October 18-19, 2011.
Reinhart, Carmen M. and Vincent R. Reinhart, “After the Fall,” in Federal Reserve Bank of
Kansas City Economic Policy Symposium, Macroeconomic Challenges: The Decade Ahead at
Jackson Hole, Wyoming, on August 26-28, 2010.
Reinhart, Carmen M. and Kenneth S. Rogoff, “Is The 2007 U.S. Subprime Crisis So Different?
An, International Historical Comparison,” American Economic Review, Vol. 98 No. 2, May
2008, 339-344.
Reinhart, Carmen M. and Kenneth S. Rogoff, “The Aftermath of Financial Crises,” American
Economic Review, Vol. 99 No. 2, May 2009, 466-472.
Reinhart, Carmen M. and Kenneth S. Rogoff, This Time It’s Different: Eight Centuries of
Financial Folly (Princeton: Princeton University Press, September 2009).