Air Pollution Mix and Emergency Room Visits for Respiratory and Cardiac Diseases in Taipei ppt
Bạn đang xem bản rút gọn của tài liệu. Xem và tải ngay bản đầy đủ của tài liệu tại đây (204.66 KB, 17 trang )
Journal of Data Science 2(2004), 311-327
Air Pollution Mix and Emergency Room Visits for
Respiratory and Cardiac Diseases in Taipei
Jing-Shiang Hwang
1
,Tsuey-HwaHu
1
and Chang-Chuan Chan
2
1
Academia Sinica
2
National Taiwan University
Abstract: To clarify the contribution of ambient air pollutants to acute
health effects, we examined the association between daily air pollution lev-
els and emergency room (ER) visits for respiratory and cardiac diseases in
Taipei City, Taiwan from January 1997 to December 1998. Average daily
concentrations of particulate matter less than 2.5 µm in aerodynamic diam-
eter (PM
2.5
), PM
10
, carbon monoxide, sulfur dioxide, nitrogen dioxide and
ozone were obtained from ambient air quality monitoring stations. The daily
counts of ER visits stratified by diagnosis and age were modeled by both
single-pollutant and multi-pollutant Poisson regression models with adjust-
ment of confounding factors to evaluate the effects of individual pollutants.
A mixture model was constructed by adding ratios of the pollutants to the
multi-pollutant model to examine the air pollution mixture on ER visits.
The single-pollutant models showed that an interquartile range change of
PM
2.5
(16 µg/m
3
) was associated with increased ER visits for respiratory
disease in all age groups, with relative risks 1.04 to 1.06 and increased ER
visits for cardiac disease in adult and elderly age groups, with a relative risk
of 1.05. Gaseous pollutants, mainly NO
2
and CO, were also associated with
increased visits by children for respiratory disease and visits by adults and
elderly individuals for cardiac disease. Examination of joint effect of mixes
of PM
2.5
and gaseous pollutants showed that an interquartile range increase
was associated with increases in ER visits by children for respiratory disease
and by adults for cardiac disease, with a relative risk of 1.09.
Key words: Air pollution, cardiac disease, emergency room visits, respira-
tory disease.
312 J S. Hwang, T H. Hu and C C. Chan
1. Introduction
Epidemiologic studies conducted in cities around the world during the past
decade have reported significant associations between air pollution and increased
mortality and hospital admissions due to respiratory and cardiovascular diseases
(Schwartz 1996, 1997, 1999, Schwartz and Morris 1995, Schwartz et al. 2000,
Burnett et al. 1995, 1997, 2001, Linn et al. 2000, Zhang et al. 2002). Some
studies have also examined the effects of air pollution on emergency room (ER)
visit statistics, which are expected to be a more sensitive indicator of acute health
effects from air pollution than hospital admission data for a variety of reasons.
First, whereas only a subset of patients visiting the ER is hospitalized, those that
are more critically ill, ER visit records also include patients with mild and mod-
erate conditions, who may not require hospitalization. In addition, in contrast
to hospital admissions, which may not occur for several days after the onset of
symptoms, ER visits more closely reflect acute response to changes in air quality
during a particular time period.
Although ER visit statistics have been used in a number of studies, the scope
of these studies has generally been limited to specific conditions such as asthma
and/or specific subpopulations, due primarily to limitations in the availability of
ER data (Delfino et al. 1998, Lipsett et al. 1997, Xu et al. 1995, Sunyer et al.
1993, Norris et al. 1999). Since most countries lack a standardized system for
medical surveillance, the acquisition and categorization of data from emergency
department patient records can be costly and cumbersome. In the United States,
for example, national statistics on injuries and infectious are being increasingly
monitored by various agencies, but no centralized system is yet available despite
ongoing efforts to standardize data collection practices.
To overcome these limitations, the authors have selected data from a unique
resource, the National Health Insurance database in Taipei, Taiwan to study the
association between air pollution and ER visits. The National Health Insurance
database is a centralized collection of detailed medical information for 2.7 million
people, including visits to emergency rooms in major medical centers and small
clinics in Taipei. The database provide a unique opportunity to study the effects
of air pollution on daily ER due to general cardiorespiratory disease in a city with
a large population, which may be applicable to other densely populated cities.
The evidence of health effects of air pollution provided by these studies is
mainly based on the associations between single outcome and single air pollu-
tant. In order to reflect the fact that air pollutants always occurred as a mixture,
multi-pollutant models have been used to estimate the effect of one pollutant by
adjusting other pollutants or the additive effects of significant pollutants found
in the single-pollutant models (Burnett et al. 1997, Sheppard et al. 1999, Mool-
Air Pollution on Emergency Room Visits 313
gavkar et al. 1997, Wong et al. 2002). These multi-pollutant models usually
include multiple pollutants as additive independent variables in the regression.
Few studies have discussed that the joint effects of pollutants may be affected by
the interaction of the pollutant variables (Hwang and Chen 1999). No previous
studies have ever treated air pollution variables as the pollution mix of several air
pollutants together in their multi-pollutant models. Since air pollutants seldom
change their concentrations at a fixed proportion concurrently in the environ-
ment, we expected their combined effects to be affected by both total amounts
and proportions in the pollution mix. In order to reflect real air pollution situa-
tions in the environment, we proposed to construct a mixture model by adding
ratios of two pollutant levels into the multi-pollutant model. These ratio terms
are formed to measure the blending effect of the pollutants in the air pollution
mix. This less variant ratio will have no effect on the response if the two pol-
lutants are highly correlated. In this case, we expect no significant difference in
the effect between multi-pollutant and mixture models. In a real environment,
the ratio between gaseous pollutants and particulate matter usually varies daily
because of various particulate matter emitting sources. Therefore, the authors
believe the mixture models proposed in this paper can better clarify the con-
tribution of air pollution as a whole to acute health effects than most previous
multi-pollutant models.
In this study, we examined the health effects of air pollution mix on the daily
ER visits for respiratory and cardiac diseases in Taipei City from 1997 to 1998.
The pollutant mixtures evaluated in this study included fine particles (particulate
matter with an aerodynamic diameter less than 2.5µm ,PM
2.5
), PM
10
,carbon
monoxide (CO), sulfur dioxide (SO
2
), nitrogen dioxide (NO
2
) and ozone (O
3
).
Single-pollutant lagged Poisson regression models were first applied to examine
the association between individual air pollutant’s daily concentration fluctuation
and daily changes in ER visit counts, after adjusting for temporal and seasonal
patterns, day of the week and weather factors. The air pollution mix effects on
the relative risks of ER visits for respiratory and cardiac diseases in three age
groups were examined by both multi-pollutant and the proposed mixture models
for comparison.
2. Materials and Methods
2.1 Emergency room visits
The Bureau of National Health Insurance (BNHI) collected computerized
records of daily clinic visits for all contracted medical institutions which have
covered medical services of more than 96% of the population in Taiwan (Hwang
and Chan 2002). The records contained data of the medical institutions’ iden-
314 J S. Hwang, T H. Hu and C C. Chan
tification, township names, date-of-visit, patient’s identification, gender, date of
birth, code for emergency visit, and code for the discharge diagnosis by the Inter-
national Classification of Diseases, Ninth Revision (ICD-9). The ER visit records
were claimed by 85 hospitals and clinics with emergency medical service in Taipei
City during the period January 1, 1997, to December 31, 1998. The cumulative
distribution of the patients was 48.3%, 72.2% and 94.8% from the largest 10, 20
and 40 hospitals. People with minor illness may choose emergency service be-
cause of medical accessibility and other reasons. Therefore, to eliminate possible
bias, we excluded patients whose medical expense for the visit paid by BNHI was
less than the 5
th
percentile of medical expenses of the recorded patients. The
patients who had no additional clinic visits in Taipei City during the study period
were also excluded from the dataset because those patients might not live in the
city. Separate daily counts were assembled for the discharge diagnosis from res-
piratory diseases of acute bronchitis and bronchiolitis, pneumonia and influenza,
chronic bronchitis, emphysema, and asthma (ICD-9 codes 466, 480-493), car-
diac diseases of ischemic heart disease, cardiac dysrhythmias, and heart failure
(ICD-9 codes 410-414, 427-428) and gastrointestinal illness of gastric ulcer, duo-
denal ulcer, and peptic ulcer (ICD-9 codes 531-533). We further classified these
three disease counts series into 3 age strata: children (0-14), adults (15-64) and
the elderly (65+), respectively, in order to evaluate age-specific pollution effects.
Gastrointestinal illness was used as a sham outcome to check potential artificial
pollution effects due to disease-biased hospital’s admission practice and patient’s
access to medical service in our statistical models.
Table 1: Distribution of daily emergency room visits for respiratory,
cardiac and gastrointestinal diseases by age strata in Taipei, Taiwan
1997-1998.
Respiratory Cardiac Gastrointestinal
Percentile 0-14 15-64 65+ 15-64 65+ 15-64 65+
10%14875106 2
25 % 18 10 10 7 14 8 4
50 % 25 14 14 9 17 10 6
75% 341920122113 8
90% 482428152516 10
Mean 29 15 17 10 18 11 6
The distributions of age-specific emergency room visits for respiratory, cardiac
and gastrointestinal diseases between January 1997 and December 1998 in Taipei
City are shown in Table 1. Mean daily ER visits were 15-29 for respiratory
diseases, 10-18 for cardiac diseases, and 6-11 for gastrointestinal diseases during
Air Pollution on Emergency Room Visits 315
the study period. The young had the most ER visits for respiratory diseases and
the elderly had the most ER visits for cardiac diseases. The number of adult ER
visits for gastrointestinal diseases were higher than that of the elderly.
2.2 Air pollution and weather data
The five air quality monitoring stations in Taipei measured hourly levels of
SO
2
,NO
2
,CO,PM
10
and O
3
since September, 1994. One of these five stations
also measured PM
2.5
since April 16, 1997. We obtained 24-hour average for NO
2
,
SO
2
,PM
2.5
and PM
10
, hourly maximum O
3
, and maximum 8-hour running av-
erage for CO from each monitoring station and averaged them over five ambient
stations to represent the population’s daily exposures to air pollutants. Daily
meteorological conditions of wind direction, wind speed, temperature, dew point
and precipitation were also averaged over the measurements in five monitoring
stations. Daily maximum temperature and average dew point temperature were
used to adjust the meteorological effects on ER visits. Note that PM
2.5
measure-
ments were available from one downtown station only.
Table 2: Summary statistics of environmental variables, in Taipei, Tai-
wan, 1997-1998.
PM
10
PM
2.5
NO
2
SO
2
CO O
∗
3
TP
∗
DTP
∗
Percentile (µg/m
3
)(µg/m
3
) (ppb) (ppb) (ppm) (ppb) (
◦
C) (
◦
C)
10 % 23.4 17.1 20.5 1.6 0.9 22.9 17.7 2.5
25 % 32.1 22.7 24.4 2.5 1.1 30.7 22.0 3.7
50 % 43.6 29.6 29.6 3.7 1.4 39.6 27.6 6.5
75 % 58.5 38.7 35.1 5.3 1.9 60.0 32.0 8.2
90 % 80.5 50.6 41.1 7.3 2.2 86.8 34.4 9.5
Mean 48.3 32.1 30.2 4.1 1.5 48.0 26.8 6.2
∗ O
3
, daily maximum ozone concentration; TP, daily maximum temper-
ature; DTP, difference between daily maximum and minimum temper-
ature.
Table 2 summarizes air pollution and weather data over the study period
in Taipei. Mean daily concentrations of air pollutants for over two years were
48.3 µg/m
3
for PM
10
, 32.1 µg/m
3
for PM
2.5
, 30.2 ppb for NO
2
, and 4.1 ppb
for SO
2
. The average of daily maximum 1-h ozone and 8-h CO concentrations
were 48 ppb and 1.5 ppm, respectively. The daily maximum temperatures (TP)
averaged at 26.8
◦
C, and the differences between daily maximum and minimum
temperatures (DTP) averaged at 6.2
◦
C. The data from 1997 to 1998 indicated
that Taipei was a warm city with a relatively large difference between day and
night temperatures, and polluted by high concentrations of PM, NO
2
,andO
3
.
316 J S. Hwang, T H. Hu and C C. Chan
2.3 Statistical analysis
Instead of using generalized additive models to fit the data, we adopted a
cautious model construction procedure with simple implementation in most sta-
tistical software. To ensure that pollution effects were not confounded by trend,
season, day of the week, and weather factors, the mean equation of the over-
dispersed Poisson model for an ER visit series y
t
, was first given by
log[E(y
t
)] = L
t
+ S
t
+ D
t
+ H
t
+ W
t
,
where E(y
t
) is the expected number of the ER visits on the t
th
day; the compo-
nent L
t
=
p
j=1
φ
j
log(max(y
t−j
, 1)) is an explanatory variable of lagged values
of the dependent variable; S
t
= ϕ
1
sin(4tπ/365) +ϕ
2
cos(4tπ/365) is a time series
with a period of half year; D
t
consists of items representing days of the week ; H
t
consists of items for special holidays such as the week-long Lunar New Year and
some months with extreme weather, such as January, February, July and August;
and W
t
consists of series of daily temperature difference, maximum temperature,
temperature average of previous three days, dew point and rain fall. The variance
of the dependent variable is assumed to be proportional to the expectation of the
series.
The lagged component L
t
was added to remove the autocorrelation of the
observed outcome series. The parametric time series of S
t
was added to model
general temporal pattern of higher disease outcomes in the winter and summer,
and H
t
removed effects due to special holidays and extreme weather. The time
series D
t
removed differences in ER visits between days of the week. The ex-
planatory variables were chosen to minimize Akaike’s information criterion (AIC)
in a stepwise procedure. The deviations in the expected number of ER vis-
its of the selected model to the observed series were further examined for any
autocorrelation, temporal and seasonal patterns. When the confounding vari-
ables were fixed, we separately added η
t
= βV
t
,whereV
t
is the daily pollutant
level lagged 0-3 days, to the mean equation of the selected model to complete
a single-pollutant model, which is log[E(y
t
)] = L
t
+ S
t
+ D
t
+ H
t
+ W
t
+ η
t
.
The expected relative risk of ER visit for any individual on a day with a new
pollution level, denoted by V
(1)
, to a baseline pollution level, denoted by V
(0)
,
is RR = E(y
t
|V
(1)
)/E(y
t
|V
(0)
)=exp[β × (V
(1)
− V
(0)
)]. That is, the expected
relative risk can be estimated by the exponential of the estimated pollution coeffi-
cient, β, for the added pollutant multiplied by the difference of the two pollutant
levels. The 1
st
quartile of measured pollution level is often treated as a baseline;
while the 3
rd
quartile of the pollution level is chosen as a risk level for comparing
the relative risk.
The multi-pollutant model was constructed by replacing η
t
= βV
t
in the
single-pollutant model with η
t
=
p
i=1
β
i
V
it
,whereV
1t
, ··· ,V
pt
are the daily
Air Pollution on Emergency Room Visits 317
levels of the p pollutants with a specified time lag. To construct the mixture
model, we simply modified the multi-pollutant model by adding extra terms
representing the ratios of all pairs of pollutants considered. In this study, we
added only those ratios of gaseous pollutants to the fine particulate matter. Let
V
1t
represent PM
2.5
and P
2t
, ··· ,P
qt
represent the ratios of other gaseous pol-
lutants to V
1t
, and then we have η
t
=
q
i=1
β
i
V
it
+
q
i=2
α
i
P
it
in the final mix-
ture model. With estimated coefficients ˆα
i
,
ˆ
β
i
and estimated standard errors
and correlations of these estimated coefficients from the final mixture models,
we made a similar inference on relative risk increase on increments of air pol-
lution mix. Let V
(0)
i
be a baseline level for the i
th
pollutant, V
(1)
i
be a new
level of the pollutant and V
(d)
i
= V
(1)
i
− V
(0)
i
. The ratios and ratio differences
were denoted by P
(j)
i
= V
(j)
i
/V
(j)
1
and P
(d)
i
= P
(1)
i
− P
(0)
i
, respectively. The
relative risk is written as RR = M × A,whereM =exp[
q
i=2
ˆα
i
P
(d)
i
]and
A =exp[
q
i=1
ˆ
β
i
V
(d)
i
] representing relative risks of the blending effect and to-
tal amount effect of a new pollution mix relative to a baseline pollution mix,
respectively. We interpret A as the expected relative risk contributed by the in-
crease in total amount of a pollution mix. Note that RR = A when we choose
the multi-pollutant model. M represents a blending effect of ratio changes in
the pollution mix. The estimates of 95% confident intervals (CI) of the relative
risks RR, A and M can be obtained straightforward. For example, the esti-
mate of standard error of log(M), denoted by S
M
,isgivenbythesquareroot
of
q
i=2
var( ˆα
i
)P
(d)
i
P
(d)
i
+2
2≤i≤j≤q
cov( ˆα
i
, ˆα
j
)P
(d)
i
P
(d)
j
. The lower and upper
bound of the 95% CI is estimated by exp[M ± 1.96S
M
]. Note that the corre-
lations of the ratios of gaseous pollutants to PM
2.5
tend to be very high, since
these pollutants are often correlated with PM
2.5
. Theoretically the regression
model will produce large negative values of cov( ˆα
i
, ˆα
j
). Therefore, we expect
small standard error estimates for relative risk estimates for the blending effect.
The significance of M will then affect the gain of the mixture model from the
multi-pollutant model. We suggest that the judgment of significant difference be-
tween the multi-pollutant model and the proposed mixture model be determined
by the deviances of the two models.
3. Results
The Pearson’s correlation coefficients among 6 air pollutants and 2 weather
parameters in Taipei are shown in Table 3 with the correlation of levels in the
upper triangle. Daily PM
10
and PM
2.5
concentrations were highly correlated
(r =0.83). Daily PM
10
and PM
2.5
concentrations were moderately correlated
with daily NO
2
,SO
2
,andCO(r =0.55 − 0.67). Daily O
3
concentrations were
correlated moderately with DPT (r =0.61) and slightly with TP (r =0.49).
318 J S. Hwang, T H. Hu and C C. Chan
As shown in the lower triangle of Table 3, the correlation coefficients of daily
ratios of the 4 gaseous pollutants to PM
2.5
levels were, as expected, very high
(r =0.92 − 0.97).
Table 3: Pearson’s correlation coefficients between air pollution and
weather variables in Taipei, Taiwan, 1997-1998; The upper triangular
was obtained based on daily levels of the 6 pollutants; while the 6 ele-
ments in the lower triangular were obtained based on daily ratios of 4
gaseous pollutants to PM
2.5
levels.
PM
10
PM
2.5
NO
2
SO
2
CO O
3
TP DTP
PM
10
1 0.83 0.66 0.67 0.55 0.47 0.14 0.43
PM
2.5
1 0.67 0.64 0.56 0.43 0.00 0.39
NO
2
1 0.65 0.75 0.43 -0.03 0.28
SO
2
0.94 1 0.55 0.52 0.33 0.51
CO 0.97 0.93 1 0.33 0.19 0.38
O
3
0.95 0.92 0.92 1 0.49 0.61
TP 1 0.72
DTP 1
We performed 72 single-pollutant models for respiratory diseases in three age
strata, 48 models for cardiac diseases, and another 48 models for gastrointestinal
diseases in two age strata separately. For each daily health outcome series, we
used parametric models to remove temporal and seasonal patterns, day of the
week and special holiday effects, and weather factors. Each final model was
determined based on AIC and diagnostic plots of the residuals. The residual
analysis included checking whether the confound effects and autocorrelation have
been removed. We also checked boxplots of residuals in months, days of the week,
special holiday versus regular days to ensure that all possible confounding effects
were being adjusted. Before adding air pollution variables to each selected model,
we plotted the residuals against each pollutant levels to see any possible linear
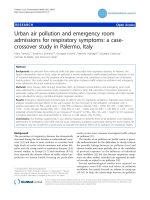
and nonlinear pattern. As an example shown in Figure 1, the smoothed curve
shows that there is a linear association between PM
2.5
levels and the residuals.
Hence, single pollutant term of levels of same day and previous 3 days was added
to the mean equation of the Poisson regression model separately for the period
April 16, 1997 – December 31, 1998. The estimated pollution coefficients were
then used to calculate relative risks for an increase of the interquartile range for
the pollutants in the study period.
Table 4 lists the significantly increased relative risks of ER visits due to respi-
ratory diseases for an IQR increment in pollutant concentrations estimated by the
single-pollutant Poisson regression models. Both particulate (PM
2.5
and PM
10
)
Air Pollution on Emergency Room Visits 319
20 40 60 80
-4 -2 0 2 4 6
PM
2.5
Lag 1
Respiratory Visits Residual
Figure 1: A plot of the residual counts of emergency room visits res-
piratory disease in 0-14 years of age group in Taipei, during 1997-1998
versus average PM
2.5
levels of one-day lag during the study period. The
residuals have been adjusted for all patterns and weather variables ex-
cept air pollution in a Poisson model. The line is drawn using loess, a
smoothing function in S-Plus statistical software, on the data.
and gaseous pollutants (NO
2
,CO,andO
3
) significantly increased children’s ER
visits for respiratory diseases. The relative risks of children’s ER visits were about
1.04-1.06 for a 16 µg/m
3
increment of PM
2.5
at 0-3 day lags. Estimated relative
risks of other air pollutants were: 1.03-1.04 for PM
10
lagged 1-3 days (95% CI =
1.00 - 1.07; IQR = 26.4 µg/m
3
); 1.03-1.04 for NO
2
lagged 2-3 days (95% CI =
1.00 - 1.07; IQR = 10.7 ppb); 1.04 for CO lagged 2-3 days (95% CI = 1.00 - 1.08;
IQR = 0.8 ppm); 1.04 for O
3
lagged 2 days (95% CI = 1.01 - 1.07; IQR = 29.3
ppb). For adults and the elderly, only particulate pollutants affected their ER
visits for respiratory diseases. The relative risks were 1.04 at an IQR increment
in 2-day lagged PM
2.5
and 3-day lagged PM
10
for adults, and was 1.04-1.05 for
PM
2.5
lagged 0-3 days and 1.03 for 2-day lagged PM
10
per IQR increment.
Table 5 lists the significantly increased relative risks of ER visits due to car-
diac diseases for an IQR increment in pollutant concentrations estimated by the
single-pollutant Poisson regression models. We observed that the pollution ef-
fects occurred mostly at current-day exposures for adults and at 2-3 days lagged
exposures for the elderly. The estimated relative risks of adults’ cardiac ER vis-
its were 1.05, 1.06 and 1.06 per IQR increment of their current-day exposures to
PM
2.5
,NO
2
and CO, respectively. For the elderly, their relative risks associated
320 J S. Hwang, T H. Hu and C C. Chan
Table 4: Estimated relative risk in emergency room visits and 95% CIs
for an IQR increase in pollutants from single-pollutant lagged Poisson
models for respiratory disease in Taipei City, Taiwan, 1997-1998.
Age Pollutant Lag Relative Risk 95%CI
Children PM
2.5
0 1.039 (1.007, 1.070)
1 1.057 (1.027, 1.088)
2 1.051 (1.019, 1.082)
3 1.036 (1.005, 1.068)
PM
10
1 1.032 (1.004, 1.059)
2 1.038 (1.010, 1.065)
3 1.028 (1.001, 1.056)
NO
2
2 1.041 (1.010, 1.072)
3 1.033 (1.002, 1.064)
CO 2 1.043 (1.007, 1.079)
3 1.038 (1.002, 1.074)
O
3
2 1.040 (1.010, 1.070)
Adults PM
2.5
2 1.037 (1.001, 1.073)
PM
10
3 1.036 (1.006, 1.065)
Elderly PM
2.5
0 1.046 (1.009, 1.082)
1 1.042 (1.009, 1.075)
2 1.035 (1.002, 1.068)
3 1.043 (1.010, 1.076)
PM
10
2 1.027 (1.001, 1.054)
with PM
2.5
and PM
10
at lagged 2-3 days were about 1.05 and 1.03 per IQR
increment, respectively. The relative risks of cardiac ER visits were 1.04 for
CO lagged 1 day, 1.04 for SO
2
lagged 2 days and NO
2
lagged 3 days among
the elderly. Among all these particulate and gaseous pollutants, PM
2.5
was the
most consistent air pollutant responsible for increase in daily ER visits for both
respiratory and cardiac diseases. By contrast, none of these air pollutants had
effect on daily ER visits for gastrointestinal diseases. It assured the fact that
the estimated pollution effects on the cardiorespiratory disease have little bias
due to hospital’s admission practice and patient’s access to medical service in our
statistical models.
The results of single-pollutant models indicated that ER visits for respiratory
diseases among children were affected by particulate and gaseous pollutants at
2-3 day lags during the study period. As to the ER visits for cardiac diseases,
current-day air pollution mix also affected adults and air pollution mix with 2-3
day lags affected the elderly. For comparison of modeling multiple pollutants, we
Air Pollution on Emergency Room Visits 321
considered mixtures of PM
2.5
and gaseous pollutants NO
2
,SO
2
,COandO
3
on
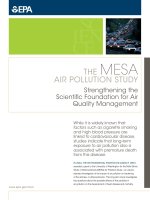
the five specific scenarios listed in Table 6. The results show that the relative
risks of ER visits for respiratory disease in the 0-14 years of age group were 1.069
(95% CI = 1.025 - 1.114) per IQR increment of a mix of PM
2.5
,NO
2
,COandO
3
at lag 2 days using multi-pollutant model. The mixture model was significantly
better fitted than the multi-pollutant model on this scenario. The joint effect
(RR = 1.088; 95% CI =1.041 - 1.136) was much higher than the effect of each
single pollutant as shown in Figure 2. The effect of a mix of PM
2.5
,NO
2
and
CO at lag 3 days on respiratory disease in the children age group was relatively
smaller (RR = 1.048), which was a little increase from the single pollutant effect.
Table 5: Estimated relative risks in emergency room visits and 95% CIs
for an IQR increase in pollutants from single-pollutant lagged Poisson
models for cardiac disease in Taipei City, Taiwan, 1997-1998.
Age Pollutant Lag Relative Risk 95%CI
Adults PM
2.5
0 1.051 (1.007, 1.098)
NO
2
0 1.058 (1.016, 1.102)
CO 0 1.061 (1.012, 1.112)
Elderly PM
2.5
2 1.048 (1.017, 1.079)
3 1.045 (1.015, 1.077)
PM
10
2 1.040 (1.014, 1.066)
3 1.034 (1.008, 1.061)
NO
2
3 1.042 (1.014, 1.072)
SO
2
2 1.037 (1.010, 1.066)
CO 1 1.044 (1.010, 1.078)
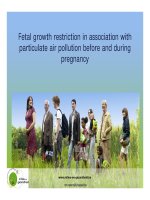
Table 6 and Figure 3 show that the fitted mixture model was significantly bet-
ter than the multi-pollutant model in the case of mix of PM
2.5
,NO
2
and CO at
current day on ER visits for cardiac disease in the 15-64 years of age group. The
estimated relative risk was 1.086 (95% CI =1.025 - 1.151) per IQR increment of a
mix of PM
2.5
,NO
2
and CO at current day using the mixture model. It indicates
that there was blending effect of PM
2.5
and gaseous pollutants on the ER visits
for cardiac diseases in the 15-64 years of age group. While the two models had
no difference in fitting the cardiac diseases in the elderly age group for exposure
to mix of PM
2.5
and gaseous pollutants. The relative risks were about 1.06 per
IQR increment of the mixtures of pollutants.
322 J S. Hwang, T H. Hu and C C. Chan
1.00 1.02 1.04 1.06 1.08 1.10 1.12 1.14
Respiratory disease (children) Respiratory disease (children)
O3
PM
2.5
PM
2.5
NO
2
NO
2
CO
CO
Multi
Multi
Mixture
Mixture
RR (95% CI)
Lag 2 days Lag 3 days
Figure 2: The effects of single pollutant and mix of pollutants on ER
visit for respiratory disease in Taipei, 1997-1998, which are shown by the
estimated relative risks and 95% CIs for an IQR increase in pollutant
levels. The estimates were obtained by single-pollutant, multi-pollutant
and mixture models, respectively.
Table 6: Gaseous pollutants and PM
2.5
mix effects on ER visits for respi-
ratory and cardiac diseases. The values shown are model deviances, es-
timated relative risks and 95% confidence intervals (CI) for IQR changes
in concentrations of the pollutants in multi-pollutant and mixture mod-
els.
Disease, Age group, Model D eviance P-value Relative 95% CI
Gaseous pollutants risk
Respiratory, 0-14 years, Multi- 1393.0 0.000 1.069 (1.025, 1.114)
NO
2
,COandO
3
lag 2 days Mixture 1369.9 1.088 (1.041, 1.136)
Respiratory, 0-14 years, Multi- 1405.5 0.030 1.044 (1.005, 1.085)
NO
2
and CO lag 3 days Mixture 1398.5 1.048 (1.007, 1.091)
Cardiac, 15-64 years, Multi- 827.6 0.036 1.066 (1.009, 1.127)
NO
2
and CO current day Mixture 821.0 1.086 (1.025, 1.151)
Cardiac, 65+ years, Multi- 803.2 0.438 1.058 (1.024, 1.093)
SO
2
lag 2 days Mixture 802.7 1.060 (1.025, 1.096)
Cardiac, 65+ years, Multi- 803.3 0.877 1.060 (1.021, 1.102)
NO
2
and CO lag 3 days Mixture 802.9 1.062 (1.021, 1.105)
4. Discussion
Our study shows that there were significant associations between air pollution
Air Pollution on Emergency Room Visits 323
and daily ER visits for respiratory and cardiac diseases, but not for gastrointesti-
nal illness in Taipei City during the period 1997-1998. PM
2.5
was the most con-
sistent single pollutant related significantly to daily ER visits for both respiratory
and cardiac diseases. PM
10
showed weaker effects on daily ER visits for respira-
tory and cardiac diseases in the single-pollutant model and was not as consistent
as PM
2.5
. Although gaseous air pollutants had some effects on ER visits, such
as NO
2
,COandO
3
on respiratory diseases, and CO, NO
2
and SO
2
on cardiac
diseases, their individual contributions to relative risks were comparatively lower
than that of PM
2.5
.
This study provides epidemiologic evidence that fine particles in urban envi-
ronments are a risk factor for cardiopulmonary diseases. Respiratory epithelium
can be activated by exposure to fine particles containing various combustion prod-
ucts including transition metals and organics from gasoline and diesel powered
automobile emissions. One recent in-vitro study has found significant cellular
toxicity induced by fine particles and O
3
in Taipei (Huang et al. 2003). A grow-
ing number of panel studies have reported that the PM’s effects on cardiovascular
morbidity are possible through either coagulation in blood vessel or changes in
heart rate modulation induced by pulmonary inflammation (Ibald-Muli et al.
2001; Magari et al. 2001). One recent animal toxicity study has shown con-
centrated ambient particles in Taipei significantly induced heart rates and blood
pressures of pulmonary hypertensive rats (Cheng et al. 2003). Although we still
lack complete understanding about the biological plausibility of PM toxicity, our
findings demonstrate that the effect of PM on cardiopulmonary morbidity are
beyond western experience and might be a worldwide phenomenon.
Although multi-pollutant models have been proposed for modeling health
effect of multiple pollutants in several studies, the models were used only for
estimating single pollutant effect with an adjustment of other pollutants. In this
study, we generalized the multi-pollutant model to the mixture model and used
it for examining the joint effect of PM
2.5
in combination with gaseous pollutants.
We found that the risks of ER visits increased to 8.8% for respiratory disease
in the children age group, 8.6% and 6% for cardiac disease in the adults and
elderly age groups for an increment of interquartile range of pollution mixes in
Taipei City, respectively. The effects of pollution mix were greater than the
PM
2.5
effects alone, which were about 4-5%, but less than the sum of individual
pollutant effects in the mixture.
Although the use of nonparametric smooth functions for the confounders was
popular in most recent studies, we found it was sensitive to the choice of smooth-
ing parameters. Therefore, we built our models through intensive data analysis
step by step. In each step, a parametric model was constructed to fit the found
pattern from data analysis and residuals were checked against each independent
324 J S. Hwang, T H. Hu and C C. Chan
1.00 1.05 1.10 1.15
Cardiac disease (adult) Cardiac disease (elderly) Cardiac disease (elderly)
PM
2.5
PM
2.5
PM
2.5
NO
2
NO
2
SO
2
CO
CO
Multi
Multi
Multi
Mixture
Mixture
Mixture
RR (95% CI)
Lag 0 day Lag 2 days Lag 3 days
Figure 3: The effects of single pollutant and mix of pollutants on ER
visit for cardiac disease in Taipei, 1997-1998, which are shown by the
estimated relative risks and 95% CIs for an IQR increase in pollutant
levels. The estimates were obtained by single-pollutant, multi-pollutant
and mixture models, respectively.
variable to ensure that the confounding effects had been removed sufficiently.
The autocorrelation of outcome series was removed by including lagged depen-
dant variables as independent variables rather than by modeling the error as
an autoregressive process. Accordingly, the computation became much simpler
by using regularly available Poisson regression programs in any statistical soft-
ware. We believed this analytical approach would improve our estimation of air
pollution effects in population-based epidemiologic studies, which were usually
inherent with many locally confounded factors.
Acknowledgments
We greatly appreciate Taiwan Environmental Protection Administration and
Bureau of National Health Insurance in providing the data. The work was par-
tially supported by the Academia Sinica grant AS-89-TP-A09.
References
Burnett, R., Dales, R., Krewski, D., Vincent, R., Dann, T. and Brook, J. (1995). Associ-
ations between ambient particulate sulfate and admissions to Ontario hospitals for
cardiac and respiratory diseases. American Journal of Epidemiology 142, 15-22.
Air Pollution on Emergency Room Visits 325
Burnett, R., Cakmak, S., Brook, J. and Krewski, D. (1997). The role of particulate size
and chemistry in the association between summertime ambient air pollution and
hospitalization for cardiorespiratory diseases. Environmental Health Perspectives
105, 614-620.
Burnett,R.,Smith-Doiron,M.,Stieb,D.,Raizenne,M.,Brook,J.,Dales,R.,Leech,J.,
Cakmak, S. and Krewski, D. (2001). Association between ozone and hospitaliza-
tion for acute respiratory diseases in children less than 2 years of age. American
Journal of Epidemiology 153, 444-452.
Cheng, T. J., Hwang, J. S., Wang, P. W. et al. (2003). Effects of concentrated am-
bient particles on heart rate and blood pressure in pulmonary hypertensive rats.
Environmental Health Perspectives 111, 147-150.
Delfino, R., Murphy-Moulton, A. and Becklake, M. (1998). Emergency room visits for
respiratory illness among the elderly in Montreal: Association with low level ozone
exposure. Environmental Research Section A 76, 67-77.
Huang, S. L., Hsu, M. and Chan, C. C. (2003). Effects of submicronmeter particle’s
compositions on cytokine production and lipid peroxidation of human bronchial
epithelial cells. Environmental Health Perspec tives 111, 478-482.
Hwang, J. S. and Chan, C. C. (2002). Effects of air pollution on daily clinic visits for
lower respiratory tract illness (with commentary). American Journal of Epidemi-
ology 155, 1-16.
Hwang, J. S. and Chen, J. (1999). An evaluation of risk estimation procedures for
mixtures of carcinogens. Risk Analysis 19, 1071-1076.
Ibald-Muli, A., Stieber, J., Wichmann, H. E. et al. (2001). Effects of air pollution on
blood pressure: a population-based approach. American Journal of Public Health
91, 571-577.
Linn, W., Szlachcic, Y., Gong, H., Kinney, P. and Berhane, K. (2000). Air pollution
and daily hospital admissions in metropolitan Los Angeles. Environmental Health
Perspectives 108, 427-434.
Lipsett, M., Hurley, S. and Ostro, B. (1997). Air pollution and emergency room visits
for asthma in Santa Clara County, California. Environmental Health Perspectives
105, 216-222.
Magari, S. R., Hauser, R., Schwartz, J. et al. (2001). Association of heart rate vari-
ability with occupational and environmental exposure to particulate air pollution.
Circulation 104, 986-991.
Moolgavkar, S., Luebeck, E. and Anderson, E. (1997). Air pollution and hospital
admissions for respiratory causes in Minneapolis-St. Paul and Birmingham. Epi-
demiology 8, 364-370.
Norris, G., YongPong, S., Koenig, J., Larson, T., Sheppard, L. and Stout, J. (1999).
An association between fine particles and asthma emergency department visits for
children in Seattle. Environmental Health Perspectives 107, 489-493.
326 J S. Hwang, T H. Hu and C C. Chan
Schwartz, J. and Morris, R. (1995). Air pollution and hospital admission for cardio-
vascular disease in Detroit, Michigan. American Journal of Epidemiology 142,
23-35.
Schwartz, J. (1996). Air pollution and hospital admissions for respiratory disease.
Epidemiology 7, 20-28.
Schwartz, J. (1997). Air pollution and hospital admissions for cardiovascular disease in
Tucson. Epidemiology 8, 371-377.
Schwartz, J. (1999). Air pollution and hospital admissions for heart disease in eight
U.S. counties. Epidem iology 10, 17-22.
Schwartz, J. (2000). Harvesting and long term exposure effects in relation between air
pollution and mortality. American Journal of Epidemiology 151, 440-448.
Sheppard, L., Levy, D., Norris, G., Larson, T. and Koenig, J. (1999). Effects of ambient
air pollution on nonelderly asthma hospital admissions in Seattle, Washington,
1987-1994. Epidemiology 10, 23-30.
Sunyer, J., Saez, M., Murillo, C., Castellsague, J., Martinez, F. and Anto J. M. (1993).
Air pollution and emergency room admissions for chronic obstructive pulmonary
disease: A 5-year study. American Journal of Epidemiology 137, 701-705.
Wong, C., Atkinson, R., Anderson, H., Hedley, A., Ma, S., Chau, P. and Lam, T. (2002).
A tale of two cities: Effects of air pollution on hospital admissions in Hong Kong
and London compared. Environmental Health Perspectives 110, 67-77.
Xu, X., Li, B. and Huang, H. (1995). Air pollution and unscheduled hospital outpatient
and emergency room visits. Environmental Health Perspec tives 103, 286-289.
Zhang, J., Hu, W., Wei, F., Wu, G., Korn, L. and Chapman, R. (2002). Children’s
respiratory morbidity prevalence in relation to air pollution in four Chinese cities.
Environmental Health Perspectives 110, 961-967.
Received February 13, 2004; accepted June 1, 2003.
Jing-Shiang Hwang
Institute of Statistical Science
Academia Sinica
Taip ei, Taiwan
Tsuey-Hwa Hu
Institute of Statistical Science
Academia Sinica
Taip ei, Taiwan
Chang-Chuan Chan
Institute of Occupational Medicine and Industrial Hygiene
Air Pollution on Emergency Room Visits 327
National Taiwan University