Fetal growth restriction in association with particulate air pollution before and during pregnancy potx
Bạn đang xem bản rút gọn của tài liệu. Xem và tải ngay bản đầy đủ của tài liệu tại đây (539.37 KB, 18 trang )
www.milieu-en-gezondheid.be
Fetal growth restriction in association with
particulate air pollution before and during
pregnancy
www.milieu-en-gezondheid.be
What is the clinical meaning of fetal
growth restriction
Why should we study it?
www.milieu-en-gezondheid.be
Circulation 2005;112:1414-1418
www.milieu-en-gezondheid.be
Lancet 2005;365:1484-1486
www.milieu-en-gezondheid.be
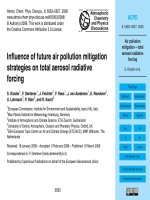
Blood pressure and birth weight
Am J Epidemiol 2007;166:413–420
www.milieu-en-gezondheid.be
Aims
• To study the risk of fetal growth restriction in associaotin
with outdoor PM10 concentrations at the mothers’
residence.
• To study potential effect modification by gestational
duration.
• To assess the shape of the association
• To compare the effects on birth weight with biomass
exposure (develomental countries), ETS and maternal
smoking during pregnancy.
www.milieu-en-gezondheid.be
Methods (1)
• SPE data on 345,081 singleton newborns
• Interpolation method and population weighted
on the level of municipality.
• Calculation of exposure for each trimester,
period (14 days) around conception and 80 days
before conception
• Polynomial models to study the shape of the
association
• Systematic comparison with ETS, smoking,
biomass.
www.milieu-en-gezondheid.be
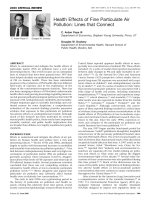
Exposure interpolation and weigthing
www.milieu-en-gezondheid.be
Methods (2)
Based on meta-analytic data comparison
estimates for biomass, ETS exposure and
maternal smoking were plotted against
estimated average daily dose of fine
particulate matter from these exposures.
www.milieu-en-gezondheid.be
Characteristics
Characteristic Mean birth weight (g)
Gender
Male
Female
3267
3397
Season
Cold
Warm
3328
3338
SES
Low
Medium
High
3323
3340
3360
Parity
1
2
3
≥ 4
3263
3392
3408
3382
Gestation age (weeks)
< 32
32-36
> 36
1296
2332
3371
Maternal age (years)
< 20
20-24
25-29
30-34
35-39
3149
3243
3326
3375
3359
www.milieu-en-gezondheid.be
Birth weight changes calculated for a 10 µg/m³
increase
Adjusted for maternal age, infant gender, parity,
season, socioeconomic status, gestational age, time
trend
Period Estimate (95% CI)
Gestation Estimate (95% CI)
Conception
(14 days)
-5.74 -7.27 -4.22 <32
32-36
>36
0.11
-13.1
-5.59
-16.2
-23.3
-7.14
16.5
-2.83
-4.04
Trimester 1 -12.6 -15.0 -10.3 <32
32-36
>36
21.2
-38.6
-12.3
-6.49
-54.5
-14.7
48.8
-22.8
-10.0
Trimester 2 -14.2 -16.6 -11.9 <32
32-36
>36
16.5
-33.0
-14.1
-11.4
-49.4
-16.5
44.5
-16.5
-11.7
Trimester 3 -13.0 -15.5 -10.5 <32
32-36
>36
8.30
-18.7
-13.4
-11.1
-33.9
-15.9
27.7
-3.46
-10.9
Overal
Pregnancy
-17.8 -20.6 -15.1 <32
32-36
>36
21.4
-17.8
-17.7
-8.7
-20.6
-20.6
51.5
-15.1
-15.0
www.milieu-en-gezondheid.be
Adjusted for maternal age, infant gender, parity,
season, socioeconomic status, gestational age, time
trend
Odds ratio for small for gestational age calculated for a 10 µg/m³
increase in exposure around conception and during pregancy
0.7
0.8
0.9
1.0
1.1
1.2
1.3
<32 w
32-36 w
> 36 w
p for interaction air pollution by gestation < 0.0001
Odds ratio
14 d 3 m 6 m 9 m
Conception Pregnancy
www.milieu-en-gezondheid.be
0.8
1.0
1.2
1.4
<32 w
32-36 w
> 36 w
p for interaction air pollution by gestation < 0.0001
Odds ratio
Independent odds ratios for small for gestational age calculated for a
10 µg/m³ increase in exposure around conception and during pregancy
Adjusted for maternal age, infant gender, parity,
season, socioeconomic status, gestational age, time
trend and exposure during conception / pregnancy.
14 d 3 m 6 m 9 m
Conception Pregnancy
www.milieu-en-gezondheid.be
Does PM exposure during conception or
pregncancy the risk of preterm delivery?
No significant association (also no trend)
www.milieu-en-gezondheid.be
Perspective: comparison with other
exposures
www.milieu-en-gezondheid.be
Systematic review of other smoke related
exposures
•Biomass: Pope et al. Epidemiol Rev. 2010;32:70-81.
•ETS: Salmasi et al. Acta Obstet Gynecol Scand. 2010;89:423-41.
• Maternal smoking: Jaddoe et al. Paediatr Perinat Epidemiol.
2008;22:162-71.
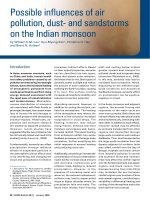
• We plotted decreases in birth weight against estimated average
daily dose of fine particulate matter from air pollution along with
comparison estimates of ETS, biomass and cigarette smoke.
• Assumptions 18 m³/day, dose cigarette 12 mg PM
10 (Pope et al.
Circulation 2009;120:941-948)
www.milieu-en-gezondheid.be
-1 0 1 2
-250
-200
-150
-100
-50
0
air pollution
ETS
biomass
<5 cig
5-9 cig
>9 cig
0.21-0.40 mg/d
0.36-0.48 mg/d
4.5 mg/d
70 mg/d
20 mg/d
130 mg/d
estimated daily dose of PM
10,
mg/day
Reduction, birth weight g
The baseline estimated dialy dose assumes an inhalation rate of 18 m³/day and a dose of 12 mg per cigarette.
Comparison with smoking, ETS and biomass
exposure
www.milieu-en-gezondheid.be
Conclusions
• We noted associatons between fetal growth restrictions
and particulate air pollution
• Especially in preterm born infants.
• Effects not explained by preterm delivery
• Assuming causality; lowering PM10 exposure by 10
µg/m³ would avoid 19% of SGA neonates born between
32-36 weeks of pregnancy and 5% of SGA children born
ad term.
• Effects in highest exposure group in the range of ETS