Assessment of Water Pollution Levels in the Nyabugogo Catchment, Rwanda potx
Bạn đang xem bản rút gọn của tài liệu. Xem và tải ngay bản đầy đủ của tài liệu tại đây (1.12 MB, 14 trang )
40 The Open Environmental Engineering Journal, 2011, 4, 40-53
1874-8295/11 2011 Bentham Open
Open Access
Assessment of Water Pollution Levels in the Nyabugogo Catchment,
Rwanda
I. Nhapi
1,2*
, U.G. Wali
1
, B. K. Uwonkunda
1
, H. Nsengimana
3
, N. Banadda
4
and R. Kimwaga
5
1
Faculty of Applied Sciences, National University of Rwanda, P.O. Box 117, Butare, Rwanda
2
Department of Civil Engineering, University of Zimbabwe, Box MP167, Mt. Pleasant, Harare, Zimbabwe
3
Faculty of Sciences, National University of Rwanda, P.O. Box 117, Butare, Rwanda
4
College of Agricultural and Environmental Sciences, Makerere University, P.O. Box 7062, Kampala, Uganda
5
College of Engineering, University of Dar-es-Salaam, P.O. Box 35131, Dar-es-Salaam, Tanzania
Abstract: This study aims to develop a comprehensive system of pollution monitoring and control in the Nyabugogo
catchment of Rwanda, which also includes the capital city, Kigali, through locating and highlighting pollution and its
sources. Pollution hotspots were identified, covering areas of both anthropogenic and natural pollution. The study focused
on water quality assessment especially the identification of the critical points of pollution (hotspots), by measuring
selected physico-chemical parameters in the Nyabugogo River system. An extensive monthly water quality monitoring
study was conducted from October 2008 to May 2009 and covered nutrients, organic and heavy metal pollutants. The
parameters covered are Ammonium-Nitrogen (NH
4
+
-N), Nitric-Nitrogen (NO
2
—
N), Nitrate-Nitrogen (NO
3
—
N), Sulphates
(SO
4
), Phosphates (PO
4
-P), Chemical Oxygen Demand (COD), Biological Oxygen Demand (BOD
5
), Dissolved Oxygen
(DO), Total Dissolved Solids (TDS), Chromium (Cr), Iron (Fe), Lead (Pb), Manganese (Mn), Zinc (Zn), Conductivity
(EC), pH, and Turbidity. The samples were collected, preserved and analyzed in the laboratory using standard methods
whilst TDS, conductivity, turbidity and pH were measured in the field using HACH field kits. The water quality study
revealed that both urbanized and rural sub-catchments have serious but different types of pollution. For example, the
water from rural areas is heavily contaminated with nutrients, suspended sediments (due to a lot of erosion upstream) and
organic materials whilst from urban areas the predominant pollutants are heavy metals and some nutrients. It was
therefore concluded that the Nyabugogo River system is very heavily polluted and urgent action to control both rural and
urban pollution is required. Further studies are required to isolate and quantify the sources of this pollution.
Keywords: Land use activities, nyabugogo catchment, pollution hotspots, river water pollution assessment, rwanda.
1. INTRODUCTION
Nowadays catchments are becoming polluted by various
human activities, including littering, pouring chemicals
down drains and industrial discharges, all of which are
washed into creeks and stormwater drains. There is a clear
link between population growth, urbanization, industrial de-
velopment and human activities that are likely to generate
pollution. Rwanda is one of the most densely populated Af-
rican countries and after the 1994 genocide the population of
the country continue to grow. On the other hand City of Ki-
gali (CoK), the capital of Rwanda, is rapidly expanding with
increased population growth and industrial development.
The population of the CoK is estimated to be over 1.2 mil-
lion people [1]. This expansion has negatively affected water
quality management in the city, especially wastewater
*Address correspondence to this author at the Department of Civil
Engineering, University of Zimbabwe, Box MP167, Mt. Pleasant, Harare,
Zimbabwe; Tel: +263-733414529; Fax: +263-4-303288;
E-mail:
management. Elevated levels of pollution have been reported
in some of the major rivers passing through the City of Ki-
gali, such as Nyabugogo River [2-5] and the Mpazi River
[6]. The Nyabugogo Swamp feeds into the Nyabarongo
River and is major outlet of the City of Kigali and it receives
all the wastewater from City. A number of authors [4, 5] and
[7] studied pollution in Lake Muhazi and attributed it to lan-
duse activities in the catchment. Nkuranga [3] observed that
the Nyabugogo wetland receives all kinds of untreated
wastewaters, including industrial discharges. He showed that
wastewater from industrial areas that are discharging into the
Nyabugogo Swamp is polluted with heavy metals beyond
acceptable environmental standards. Muhirwa et al. [6] char-
acterised wastewater from the Nyabugogo Abattoir which
discharges into the Mpazi River, a tributary of the Ny-
abugogo River. They concluded that the effluent from the
Nyabugogo Abattoir is highly loaded with degradable organ-
ics and other pollutants that pose an environmental risk to
the receiving Mpazi River. Further, Muhirwa et al. [6] iden-
Assessment of Water Pollution Levels in the Nyabugogo Catchment, Rwanda The Open Environmental Engineering Journal, 2011, Vol. 4 41
tified Chemical Oxygen Demand (COD), Biochemical Oxy-
gen Demand (BOD
5
), nutrients, chloride, calcium, total coli-
forms and TSS as the major pollutants from that abattoir.
Nshimiyimana [8] studied another tributary of the Ny-
abugogo River, the Yanze River and he reported high levels
of flooding, erosion, sedimentation and high levels turbidity.
The Nyabugogo River is a tributary of the Nyabarongo River
which in turn is the tributary of Akagera Transboundary
River which drains into Lake Victoria. Potentially this means
that the Nyabugogo River contributes pollution to the Lake
Victoria. Lake Victoria is one of the major lakes in Africa
but is greatly affected by increasing loads of pollution from
anthropogenic activities, rendering the massive water body
eutrophic [9, 10].
Proper pollution management in the Nyabugogo Catch-
ment requires good background knowledge of the types, lev-
els and sources of pollution in the catchment [11]. The tradi-
tional approach to water quality management in developing
countries is based on developing a monitoring network from
which samples are collected periodically [12]. Related to this
is the modern practice of environmental impact assessment,
which occasionally includes water quality assessment [13].
What is missing from most of these approaches is the devel-
opment of a comprehensive system of catchment pollution
monitoring and control, something like a water pollution
control master plan that would be used to control develop-
ment and discharges by locating and highlighting the pollu-
tion and its sources. In this study, this idea was tested in the
Nyabugogo catchment of Rwanda, which also includes the
capital city, Kigali. The study mapped the area in terms of
pollution hotspots, covering areas of both anthropogenic and
natural pollution. The natural part is important since the hilly
nature of the catchment in conjunction with high annual rain-
fall of around 2,000 mm/year means that a lot of erosion
takes place even from virgin lands. The main objective of
this study was to assess the types and levels of pollution, in
the Nyabugogo catchment and to assess the impact of all this
on the downstream Nyabarongo River.
2. MATERIAL AND METHODS
2.1. Description of the Study Area
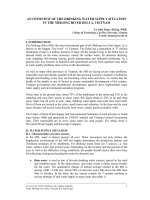
The Nyabugogo Catchment is located in the central east-
ern part of Rwanda (Fig. 1). The catchment drains a total
area of about 1,647 km
2
. The major landuse activity in the
catchment is agriculture, which occupies about 897 km
2
(about 54%) of the catchment. The climate of the catchment
is mostly of temperate and equatorial type with average tem-
perature ranging between 16°C and 23°C, depending on the
altitude of the area. The annual rainfall in Rwanda varies
from about 800 mm to 1,600 mm. There are normally four
seasons in Rwanda. The first is a long dry season that spans
from June to September, followed by a short rainy season
spanning from October to December. This season receives
30% to 40% of the annual rainfall with the highest rains fal-
ling in November. The third is a short dry season starting in
December and ending in January. The fourth is a rainy sea-
son spanning from February to end of May. This season re-
ceives around 60% of annual rainfall.
The Nyabugogo River traverses the City of Kigali and
has many tributaries such as the Mwange River, Rusine
River and Marenge River on its upstream portion. It is later
fed by other rivers from the urbanised part of Kigali such as
the Rwanzekuma River, the Ruganwa River, the Mpazi
River and the Yanze River. The major possible pollution
generating activities identified in the catchment include
flower farming and the Kabuye sugar works which are both
Fig. (1). Details of the Nyabugogo Catcthment including its location in Rwanda.
42 The Open Environmental Engineering Journal, 2011, Vol. 4 Nhapi et al.
located along the Nyabugogo River, sugar cane plantation
upstream, legumes and rice cultivation, quarrying and min-
ing activities. There are many other industries concentrated
in the Kigali industrial area that discharge all their liquid
wastes into the Ruganwa River. The UTEXRWA textile in-
dustry also discharges its effluent into the Rwanzekuma
River.
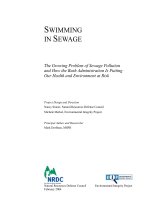
2.2. Location of Sampling Points
A total of 22 sampling sites (Fig. 2) were selected for the
monitoring of pollution trends in the Nyabugogo Catchment.
The rationale for choosing these sites was to ensure that all
inflows could be isolated in order to be able to assess their
contributions and impacts. Monitoring stations were estab-
lished upstream and downstream of effluent discharges as
well as major landuses. A transect was taken along the Ny-
abugogo Swamp, consisting of five sampling sites to give an
idea about the water quality variation along the Swamp. The
two last sampling points were located on the Nyabarongo
River, before and after the point where Nyabugogo River
joins the Nyaborango River.
2.3. Samples Collection and Analysis
The water samples were collected monthly for a period of
8 months from October 2008 to May 2009 using the grab
sample method. Samples were collected and stored in 600 ml
plastic bottles. The plastic bottles were rinsed overnight with
1M HCl and then with distilled water. The bottles were also
rinsed thrice with sample water before final collection. The
samples were placed in a coolerbox with ice for transporta-
tion to the laboratory. Where analyses were not done imme-
diately upon arrival at the laboratories, samples had to be
stored in a refrigerator at 4
o
C with preservation as appropri-
ate. The samples were analysed according to standard proce-
dures [14]. The parameters analyzed from October to De-
cember 2008 were dissolved oxygen (DO), pH, Turbidity,
Conductivity, Total Dissolved Solids(TDS), NH
4
+
-N, NO
3
-
N, N0
2
-
N, PO
4
2-
P, SO
4
2-
, Fe, Mn, Zn, Pb, and Cr. From Janu-
ary 2009, BOD
5
and COD were added to the parameters ana-
lysed and these were analysed at another laboratory of the
National University of Rwanda where appropriate equipment
were available and functioning.
2.4. Analysis of Results
Data analysis involved the assessment of the variation of
pollutants at each sampling point according to dry season
and rainy season and the assessment of the variation of pol-
lution with distance downstream of the Nyabbugogo River.
The results are presented as mean values ± standard devia-
tion. For all the tested parameters the results are presented in
bar chart for all the monitored points and in line graph only
for the points located on the Nyabugogo River stretch. The
impact of the Nyabugogo River on the receiving Nyabarongo
River was done using the Student T-Test for the arrays
upstream and downstream of the discharge of the
Nyabugogo River.
Fig. (2). Map of the Nyabugogo Catchment showing the location of sampling sites and a schematic chart of the monitoring network.
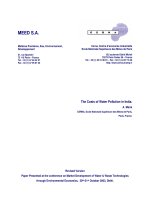
Fig. (3). Turbidity leveles for (a) all the sampling points and (b) sampling sites located on the Nyabugogo River for the monitored period.
Assessment of Water Pollution Levels in the Nyabugogo Catchment, Rwanda The Open Environmental Engineering Journal, 2011, Vol. 4 43
3. RESULTS AND DISCUSSIONS
3.1. Physical Water Quality
3.1.1. Turbidity
The seasonal turbidity levels in Nephelometric Turbidity
Units (NTU) for all the monitored points and for the points
on the Nyabugogo River stretch only are shown in Fig (3).
Turbidity was highest in the upstream part of the
Nyabugogo catchment, especially on the Rusine River
(1,215 ± 433) in the dry season and rising to 6,134 ± 893 in
the rainy season. Turbidity levels in the Marenge River was
1,274 ± 1,582) NTU in dry season and 2,557 ± 2,604 in the
rainy season. These high figures indicate serious sediment
pollution of the Nyabugogo River. The Turbidity in Kigali is
very low compared to the rural areas and the Nyabugogo
Swamp is contributing to the reduction of Turbidity and
other pollution through sedimentation. Muhirwa [6] reported
Turbidity values of 707 ± 37 NTU on the Mpazi River and
attributed this to high concentrations of TSS in wastewater
discharged from the Nyabugogo Abattoir. In the current
study Turbidity on the Mpazi River was 649 ± 845 NTU, and
this value is not only coming from the Nyabugogo Abattoir,
but also from all the activities located around the Mpazi
River. Nshimiyimana (8) reported levels of Turbidity of
water in the Yanze River for the period June 2005 to October
2007 of maximum 637 NTU recorded in November 2006.
Turbidity values of 5 to 500 NTU have been reported in
literature [15] impliying that in the current study landuse
activities and the soil/topography of the area could be greatly
influencing the Turbidity levels in the streams.
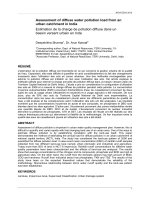
3.1.2. Conductivity and TDS
The seasonal conductivity and TDS levels for all the
monitored points and for the points on the Nyabugogo River
stretch only are shown in Figs (4 and 5) respectively.
The conductivity and TDS results show a similar trend,
as expected. High values were observed on all points located
on the Nyabugogo River, Rwanzekuma River, Ruganwa
River and in the Nyabugogo Marshland, which is due to the
outflows from Lake Muhazi where high levels have been
recorded in the past [4]. On the Rwanzekuma and Ruganwa
Rivers different dissolved salts are coming from different
industries located in Kigali. Nkuranga [3] attributed the large
values of conductivity found in the Nyabugogo Swamp to
the wasterwater inflows especially from the Rwanzekuma
River and Ruganwa River. Muhirwa et al. [6] found that the
effluent from the Nyabugogo Abattoir increased conductivity
levels in the Mpazi river from 632 ± 33 S/cm before
discharge, to 726 ± 77 S/cm after discharge. In comparison,
a conductivity value of 262 ± 130 S/cm was found
downstream in this study. The conductivity values reported
in this study are generally on the high side compared with
values of 165 – 538 S/cm reported by [15] for rivers
passing through urban areas, and 45 – 183 S/cm for rural
rivers [16]. It was also expected that the conductivity values
would increase downstream as the river passes from rural
into urban areas. This did not happen and is suspected to be
due to dilution from spring water and the cleansing of water
by the vast wetlands system in Kigali [3].
3.1.3. Dissolved Oxygen (DO)
The DO levels for all the monitored points and for the
points on the Nyabugogo River stretch only are shown in Fig
(6).
The Dissolved Oxygen variation shows low values of DO
in cultivated areas. Nkuranga [3] attributed the low
concentration of DO to the decaying papyrus in the
Nyabugogo Swamp. Generally DO is not varying much
along the Nyabugogo River. The DO values observed are
within the normal range for streams and is safe for aquatic
life [17].
Fig. (4). Conductivity levels for (a) all the sampling sites and (b) sampling sites located on the Nyabugogo River for the monitored period.
Fig. (5). TDS levels for (a) all the sampling sites and (b) sampling sites located on the Nyabugogo river for the monitored period.
44 The Open Environmental Engineering Journal, 2011, Vol. 4 Nhapi et al.
3.1.4. pH
The pH levels for all the monitored points and for the
points on the Nyabugogo River stretch only are shown in Fig
(7).
The pH did not vary much in the Nyabugogo River sys-
tem. Usanzineza et al. [4] described the water in Lake
Muhazi as slightly alkaline, with a mean pH in the Lake of
7.8, which is very closer to the value observed at the
Rwesero sampling point of 7.24 ± 0.18. Rwesero is the first
point after the Nyabugogo River flows out of Lake Muhazi.
Nkuranga [3] found a more or less constant pH in the
Nyabugogo Swamp (around 7) and attributed the high value
of pH in the Rwanzekuma and Ruganwa Rivers to alkaline
reagents from UTEXRWA textile factory and other factories
in Kigali. Muhirwa et al. [6] concluded that the increase of
pH on the Mpazi River was due to effluent from the
Nyabugogo Abattoir which has an average pH value of 8.9 ±
0.2. In the current study the pH on the Mpazi River is lower
than the value observed by Muhirwa et al. [6] as it is located
3 km downstream.
3.2. Chemical Water Quality
3.2.1. Ammonium-Nitrogen (NH
4
-N)
The term ammonia includes the non-ionized (NH
3
) and
ionized (NH
4
+
) species. The NH
4
-N levels for all the
monitored points and for the points on the Nyabugogo River
stretch only are shown in Fig (8).
The NH
4
-N increased downstream towards Kigali City;
1.4 ± 0.54 mg/L for the Ruganwa River in dry season and
2.37 ± 0.35 mg/L in rainy season, 1.23 ± 0.86 mg/L for the
Rwanzakuma River in the dry season and 1.68 ± 0.94 mg/L
in rainy season. For all other sampling sites, the NH
4
-N is
below 1 mg/L, except in the Nyabugogo Swamp (Fig 8); this
high value of NH
4
-N could be attributed to the domestic
wastewater from Kigali urban areas. The NH
4
-N values
found in this study are in line with findings by Mvungi et al.
[15] for a contaminated urban river in Zimbabwe. Ammonia
in the environment originates from metabolic, agricultural
and industrial processes and from disinfection with
chloramine [17]. Natural levels in groundwater and surface
water are usually below 0.2 mg/litre.
Fig. (6). Dissolved Oxygen levels for (a) all the sampling points and (b) sampling sites located on the Nyabugogo River for the monitored period.
Fig. (7). pH levels for (a) all the sampling sites and (b) sampling sites located on the Nyabugogo River for the monitored period.
Fig. (8). NH
4
-N levels for (a) all the sampling sites and (b) sampling sites located on the Nyabugogo River for the monitored period.
Assessment of Water Pollution Levels in the Nyabugogo Catchment, Rwanda The Open Environmental Engineering Journal, 2011, Vol. 4 45
3.2.2. Nitrate-Nitrogen (NO
3
-N)
The NO
3
-N levels for all the monitored points and for the
points on the Nyabugogo River stretch only are shown in Fig
(9).
The NO
3
-N results show a high value on the Rusine
River, Marenge River, Nyacyonga, Rwanzekuma River,
Ruganwa River and in the Nyabugogo Swamp, especially in
the dry season (Fig. 9). The NO
3
-N profile on the
Nyabugogo River show that the NO
3
-N along the
Nyabugogo River is generally decreasing downstream and
rising again in the Kigali area. The NO
3
-N values from this
study are on the higher side, indicating possible
contamination from direct and indirect sewage discharges.
The NO
3
-N values found by Mvungi et al. [15] and other
researchers are generally below 10 mg/L.
3.2.3. Nitrite-Nitrogen (NO
2
-N)
The NO
2
-N levels for all the monitored points and for the
points on the Nyabugogo River stretch only are shown in Fig
(10).
The NO
2
-N results show that the NO
2
-N were not
varying much in the Nyabugogo catchment, except on the
Rusine River and Ruganwa River and in the Nyabugogo
Swamp where there were highest values especially in the
rainy season (Fig. 10). There were no Nitrites measurements
for March to April 2009 because of resource limitations,
hence the absence of error bars for the rainy season in Fig
(10). The NO
2
-N along the Nyabugogo River shows two
peaks on the Nyabugogo 1 and the Nyabugogo 3 sampling
sites. These two peaks are due to the discharges from Rusine
River for Nyabugogo 1 and for Nyabugogo 3 sampling site
this might be due to the Nyacyonga flower farming or rice
plantation practiced in that area. The nitrite levels on the
Nyabugo River stretch did not show a noticeable pattern, as
shown in the second graph in Fig (10). This is as expected as
presence of Nitrite shows that there is oxidation whose
occurence depends on many environmental factors (natural
re-aeration, photosynthesis, presence of Ammonium, etc)
which will not be favourable all the time.
3.2.4. Sulphates
The sulphate levels for all the monitored points and for
the points on the Nyabugogo River stretch only are shown in
Fig (11).
The sulphate results show high values on the Mpazi
River 20.50 ± 23.72 mg/L in the dry season and 5.75 ± 2.63
mg/L in the rainy season, and on the Rwanzekuma River
Fig. (9). NO
3
-N levels for (a) all the sampling sites and (b) sampling sites located on the Nyabugogo River for the monitored period.
Fig. (10). NO
2
-N levels for (a) all the the sampling sites and (b) sampling sites located on the NyabugogoRiver fpr the monitored period.
Fig. (11). Sulphate levels for (a) all the sampling sites and (b) sampling sites located on the Nyabugogo River for the monitored period.
46 The Open Environmental Engineering Journal, 2011, Vol. 4 Nhapi et al.
where the value in the dry season was 26.00 ± 12.96 mg/L
and 43.25 ± 17.15 mg/L in wet season. Sulphate levels in
rivers passing through urban areas have been generally
reported below 1,000 mg/L [15], [18]. We therefore
recommend further studies around the UTEXRWA textile
industry as this may be a potential source of pollution. The
sulphates profile shows that the sulphates are increasing
downstream the Nyabugogo River, starting with the
Nyabugogo 1 site which is about of 8.7 km from the first
sampling point, suggesting that the Rusine River is
contributing to polluting the Nyabugogo River with
sulphates.
3.2.5. Phosphates
The phosphate levels for all the monitored points and for
the points on the Nyabugogo River stretch only are shown in
Fig. (12).
The highest concentration of phosphates was found on
the Rusine River in the dry season (1.11 ± 1.76 mg/L). This
was attributed to a slaughterhouse located near the Rusine
River, which discharges wastes directly into the river. The
phosphates profile on the Nyabugogo River shows an
increase near the upstream part with a peak at Nyabugogo 1
sampling site which is about 10.7 km from the first sampling
point. This is due to discharges from the Rusine River, after
which the phosphates concentration starts decreasing again.
The presence of high phosphate levels in a river indicates
pollution from from domestic sewage discharges.
3.2.6. Biochemical Oxygen Demand
The BOD
5
levels for all the monitored points and for the
points on the Nyabugogo River stretch only are shown in Fig
(13).
BOD
5
and COD were only monitored from January to
May 2009, hence the absence of error bara for the figures for
the dry season as these only represent figures for January
2009 only. The BOD
5
High BOD
5
values for the wet season
are attributed partly to the absence of proper sanitation
systems in the area, whilst the presence of decaying plants in
the wetlands would also play a role. Muhirwa et al. [6] also
reported on high BOD
5
values in the Mpazi River.
3.2.7. Chemical Oxygen Demand
The COD levels for all the monitored points and for the
points on the Nyabugogo River stretch only are shown in Fig
(14).
The COD analysis shows high values on the Rusine
River especially in the rainy season (355.73 ± 599.57 mg/L).
The COD load is coming from different chemicals like Iron,
Manganese, Sulphates, Phosphates and Nitrogen which all
use Oxygen for oxidation. Muhirwa et al. [6] concluded that
the main source of the high organic load in the Mpazi River
is the wastewater from the abattoir slaughtering area
especially blood.
3.2.8. Iron
The iron levels for all the monitored points and for the
points on the Nyabugogo River stretch only are shown in
Fig. (15).
The Iron analysis shows a high value of Iron on
the Rusine River and on the Marenge River especially for the
dry season; 8.76 ±8.88 mg/L for Rusine and
6.85 ±5.92 mg/L for Marenge. It was suspected that this
pollution is due to the geological composition of the red soils
in the area. Usanzineza et al. [5] reported a mean value for
Fig. (12). Phosphate levels for (a) all the sampling sites and (b) sampling sites located on the Nyabugogo River for the monitored period.
Fig. (13). BOD
5
levels for (a) all the sampling sites and (b) sampling sites located on the Nyabugogo River for the monitored period.
Assessment of Water Pollution Levels in the Nyabugogo Catchment, Rwanda The Open Environmental Engineering Journal, 2011, Vol. 4 47
Fe of 0.756 ±0.734 mg/L at the Lake Muhazi outlet.
The Iron levels profile of the Nyabugogo River shows that
the Rusine River and Marenge River are contributing to
increased Iron concentration levels in the Nyabugogo River
in both the dry and the wet season. It was also observed that
the inflows from the Kigali City are adding to this increased
Iron levels in the Nyabugogo River. Iron is found in natural
fresh waters at levels ranging from 0.5 to 50 mg/L [17].
3.2.9. Manganese
The manganese levels for all the monitored points and for
the points on the Nyabugogo River stretch only are shown in
Fig (16).
The Manganese concentration levels were high especially
in the dry sesason, with values of 10.28 ± 11.44 mg/L on the
Rwanzekuma River and 11.58 ± 11.46 mg/L on the Ruganwa
River. These high levels are also attributed to the
surrounding geological formation and disturbance of soils,
leading to the discharge of Manganes-rich runoff. Other high
values were at the Nyabarongo River especially also in the
dry season; 28.85 ± 23.53 mg/L for Nyabarongo upstream
and 25.56 ± 27.91 mg/L on the Nyabarongo downstream
point. In the rainy season the values are reduced due to
dilution. It is noted from studies sucha as Valere [19] that the
groundwater in Rwanda generally contains high levels of
Manganese.
3.2.10. Lead
The lead levels for all the monitored points and for the
points on the Nyabugogo River stretch only are shown in Fig
(17).
The Lead analysis results show a high value on the
Mpazi River especially in the dry season (0.113 ± 0.054
mg/L). The source of this could be the Nyabugogo tannery
which uses a lot of chemicals and a lot of car parks in the
area. Other points such as the Nyabugogo 1 and 2, and the
Nyacyonga site, had high values in the wet season only, sug-
gesting that the metal is being swept off from somewhere –
possibly a geological source. Okonkwo and Mothiba [16]
reported Lead levels of 0.010 – 0.012 mg/L from three urban
rivers in South Africa, whilst Mvungi et al. [15] reported
0.213 – 0.544 mg/L in Zimbabwe. However, as shown by
Usanzineza et al. [5], the prevalence of Lead in the Ny-
abugogo Catchment is an issue which needs further investi-
gations.
Fig. (14). COD levels for (a) all the sampling sites and (b) sampling sites located on the Nyabugogo River for the monitored period.
Fig. (15). Iron levels for (a) all the sampling sites and (b) sampling sites located on the Nyabugogo River for the monitored period.
Fig. (16). Manganese levels for (a) all the sampling sites and (b) sampling sites located on the Nyabugogo River for the monitored period.
48 The Open Environmental Engineering Journal, 2011, Vol. 4 Nhapi et al.
3.2.11. Chromium
The chromium levels for all the monitored points and for
the points on the Nyabugogo River stretch only are shown in
Fig (18).
Chromium values are very high in the rainy season ex-
cept for Rwesero, Mwange, Rutunga and Nyabugogo 3 sam-
pling points. The highest value was on the 9
th
site (Ny-
abugogo 3), and this point is located on the Nyabugogo
River after the Kabuye sugar refinery factory has discharged
its wastewater. Usanzineza et al. [5] did not detect Cr in
Lake Muhazi. However, this study found an average value of
0.11 ± 0.09 mg/L at the Rwesero sampling point, which is
closer to Lake Muhazi. Total Chromium concentrations in
drinking-water are usually less than 2 g/litre, although
concentrations as high as 120 g/litre have been reported
[17]. The presence of Chromium is attributed to both natural
and industrial discharges although the contribution of each
needs further investigation. Most of the chromium in soils is
present in the form of highly insoluble chromites.
Weathering, oxidation, and bacterial action convert these
chromites into soluble forms, and in this way chromium
mineral deposits contribute slightly to the chromium content
of natural waters. Chromium can also be present in natural
waters as a contaminant from the discharge of industrial
wastes or water from cooling systems in which chromates
are used as corrosion inhibitors.Chromium is widely used in
industry. The hexavalent chromium compounds are used in
the metallurgical industry for chrome alloy and chromium
metal production and chrome plating, and in the chemical
industry as oxidizing agents and in the production of other
chromium compounds. Trivalentchromium salts are used
less widely, being employed in textile dyeing, in the ceramic
and glass industry, and in photography.
3.2.12. Zinc
The zinc levels for all the monitored points and for the
points on the Nyabugogo River stretch only are shown in Fig
(19).
The level of zinc is undetectable upstream of the Ny-
abugogo River and starts to increase especially after the Ka-
buye sugar refinery factory where the highest peak of zinc
level all along the Nyabugogo River is located The zinc pol-
Fig. (17). Lead levels for (a) all the sampling sites and (b) sampling sites located on the Nyabugogo River for the monitored period.
Fig. (18). Chromium levels for (a) all the sampling sites and (b) sampling located on the Nyabugogo River for the monitored period.
Fig. (19). Zinc levels for (a) all the sampling sites and (b) sampling sites located on the Nyabugogo River for the monitored period.
Assessment of Water Pollution Levels in the Nyabugogo Catchment, Rwanda The Open Environmental Engineering Journal, 2011, Vol. 4 49
lution is mainly coming from industries Kigali City espe-
cially in the dry season. Usanzineza et al. [5] reported a
mean value of Zn of 0.041 ± 0.045 mg/L in Lake Muhazi,
whilst this study did not detect any Zn at the Rwesero
sampling site; the first sampling site after the Nyabugogo
River has left Lake Muhazi. Nkuranga [3] attributed the high
levels of heavy metals in the Nyabugogo Swamp to the
overflowing of wastewater from surrounding urban
activities. Okonkwo and Mothiba [16] reported Zinc levels
of 0.002 – 0.003 mg/L from three urban rivers in South Af-
rica, whilst Mvungi et al. [15] reported 0.184 – 0.418 mg/L
in Zimbabwe.
3.3. Identification of Pollution Hotspots
A summary of the mean values (± standard deviation) for
the whole monitoring period is shown in Table 1. The values
are compared with three selected guidelines which are in line
with the possible uses of water in the study area. The highest
value for each parameter is shown in bold print in Table 1.
These areas which exceed standards are the hotspots which
will be further studied in order to identify and isolate the
actual sources of pollution in this on-going study. The results
from Table 1 are further analsysed in Table 2. After the
above analyses, it can be concluded that the major sources of
the pollution for the Nyabugogo River are:
1. Rusine River (mining activities); highest in Turbidity,
PO
4
-P, and COD.
2. Ruganwa River; highest EC and TDS values. The
Ruganwa River collects a lot of water from the City of
Kigali, especially the Kicukiro, Remera, Kiyovu,
Kimihurura, Muhima areas, and also receives waste
from the industrial area of Kigali.
3. Nyabugogo T3; lowest DO and highest NH
4
-N values.
The Nyacyonga Flower Farm could be having an
influence though this warrants further investigation.
4. Nyabarongo 2; highest in Fe, Mn and Zn values. A
water treatment plant is discharging sludge from
iron/manganese removal processes.
Further studies are recommended in order to assess the
origin of the pollution present in these rivers.
3.4. Assessment of Impact on the Downstream
Nyabarongo River
Whislt the Nyabugogo river is heavily polluted, its
impact on the Nyabarongo River is minimal since
Nyabarongo River is more polluted before receiving the
Nyabugogo River. For example, Nyabarongo upstream had
higher values than Nyabarongo downstream except for COD,
Fe, Mn, Zn, NO
2
. Statistical analysis (T-Test) of samples
from the Nyabarongo 1 and 2 sampling sites showed P
(T<=t) > 0.05 for all parameters except sulphates (Table 3),
hence the impact of pollution before and after the discharge
of water from Nyabugogo River was statistically not signifi-
cant. This observation needs to be considered in its right
perspective. What this means is that only the impact on the
level of pollution in the Nyabarongo is not that significant
but it does not mean that the water from Nyabugogo River is
considered clean. The Nyabarongo River is already heavily
polluted even before the discharge of water from the Ny-
abugogo catchment, which includes the City of Kigali. To
further explain this, the flows of the two rivers can be com-
pared and this shows that in term of volumes of flow, the
Nyabugogo River is only about 10%% of the Nyabarongo
River. It would be most interesting to carry out further water
quality monitoring upstream of the Nyabarongo River to
establish the exact sources of this pollution, considering that
there are no large size towns in this catchment. Also consid-
ering the visible impact of sediments in the Nyabarongo
River, there is a need to address erosion problems in the
catchment. Further studies should also cover more parame-
ters such as total suspended solids, to ensure the impacts of
erosion are taken into account.
4. CONCLUSIONS
From the objectives and results of this study, the follow-
ing conclusions were made:
1. The water in the Nyabugogo River system is polluted
as far as physical parameters are concerned.
2. The chemical parameters monitored showed consis-
tently high levels of pollution, warranting urgent at-
tention to arrest further deterioration of water quality
in the Nyabugogo River.
3. Although the Nyabugogo River is heavily polluted, its
impact on the pollution levels in the Nyabarongo
River is currently insignificant because the Nya-
barongo River is much larger and already heavily pol-
luted upstream of the confluence of the two rivers.
5. ACKNOWLEDGEMENTS
Acknowledgements are made to (i) SIDA/SAREC
through the Inter University Council for Eastern Africa that
co-funded this work under the Lake Victoria Research (Vi-
cRes) programme and (ii) Nuffic through the WREM Pro-
ject, a collaborative capacity building project between the
National University of Rwanda and the UNESCO-IHE Insti-
tute for Water Education.
NOMENCLATURE
% = Percentage
BOD
5
= Biological Oxygen Demand
Cd = Cadmium
COD = Chemical Oxygen Demand
Cr = Chromium
EC = Electro-Conductivity
Fe = Iron
mg/l = Miligram per litre
Mn = Manganese
NH
4
+
-N = Ammonium-Nitrogen
NO
2
—
N = Nitric-Nitrogen
NO
3
—
N = Nitrate-Nitrogen
50 The Open Environmental Engineering Journal, 2011, Vol. 4 Nhapi et al.
Table 1. Summary of Monthly Results for the Period Oct’08 to May’09 Showing Mean Values ± Standard Deviation
Turbidit
y
EC TDS DO pH
NH
4
_
N
NO
3
-N
NO
2
-
N
SO
4
-
PO
4
-
P
BOD
5
COD Fe Mn Pb Cr Zn
Sampling
site
NTU S/cm mg/L mg/L mg/L mg/L mg/L mg/L mg/L mg/L mg/L mg/L mg/L mg/L mg/L mg/L
Rwesero 8.25±5.97
397.33±1
67.94
170.29±
27.18
4.19±
1.29
7.24±
0.18
0.16±
0.16
12.58±
7.82
0.01±
0.01
0.38±0.
52
0.27±
0.12
25.96±
9.80
89.92±34
.76
0.85±
1.36
1.33±1.
72
0.04±
0.02
0.11±
0.08
0.00±
0.00
Mwange
244.38±1
54.23
72.92±25
.26
37.71±9
.89
7.05±
4.73
6.94±
0.23
0.24±
0.23
15.83±
3.95
0.00±
0.00
4.25±1.
67
0.18±
0.11
26.97±
14.19
41.68±33
.05
1.29±
1.03
2.08±1.
88
0.05±
0.03
0.12±
0.08
0.00±
0.00
Rutunga
136.00±1
06.63
227.40±1
05.54
96.28±2
0.76
5.60±
3.92
7.14±
0.21
0.22±
0.15
14.6±1
0.73
0.00±
0.01
3.88±1.
73
0.35±
0.17
28.98±
12.51
19.90±8.
20
0.96±
0.94
1.55±1.
09
0.05±
0.02
0.11±
0.08
0.00±
0.00
Rusine
3675.25±
6419.60
50.52±20
.22
25.13±8
.20
6.02±
4.51
6.84±
0.73
0.67±
0.81
34.44±
26.31
0.06±
0.07
9.00±5.
93
0.73±
1.23
20.13±
8.01
293.98±5
37.28
4.94±
7.16
4.40±3.
77
0.05±
0.02
0.11±
0.07
0.00±
0.00
Nyabugo
go 1
3539.50±
8978.07
169.22±1
00.46
81.50±3
1.55
5.85±
4.03
7.04±
0.69
0.54±
1.09
10.10±
5.69
0.02±
0.02
6.75±5.
97
0.49±
0.49
17.91±
6.18
172.86±1
79.93
1.83±
1.66
1.78±2.
07
0.06±
0.04
0.10±
0.07
0.00±
0.00
Marenge
1915.56±
1988.23
56.35±26
.16
27.25±9
.44
5.82±
1.89
6.44±
0.65
0.48±
0.48
37.33±
31.71
0.03±
0.03
4.88±3.
14
0.21±
0.13
24.96±
14.29
131.16±1
20.40
3.83±
5.08
3.72±2.
44
0.05±
0.04
0.13±
0.07
0.00±
0.00
Nyabugo
go 2
2702.38±
6859.62
169.83±9
9.23
86.50±3
4.25
5.53±
2.75
7.05±
0.74
0.74±
1.52
10.86±
8.41
0.01±
0.01
5.86±2.
54
0.43±
0.52
28.38±
13.64
122.00±1
05.70
2.43±
2.23
2.04±1.
04
0.07±
0.06
0.13±
0.11
0.00±
0.00
Nyacyon
ga
1024.50±
2080.03
180.75±8
2.43
84.00±2
9.04
5.76±
1.29
7.3±0
.33
0.26±
0.18
27.70±
19.44
0.01±
0.00
6.00±2.
78
0.36±
0.17
24.41±
15.24
79.75±58
.01
1.44±
1.34
3.42±3.
12
0.08±
0.04
0.10±
0.07
0.00±
0.00
Nyabugo
go 3
716.50±1
023.60
194.77±9
5.33
81.13±2
8.38
4.34±
1.39
7.09±
0.23
0.26±
0.32
8.08±7.
21
0.02±
0.01
6.75±5.
31
0.36±
0.25
22.94±
9.18
110.40±6
5.02
1.47±
1.45
2.08±1.
14
0.07±
0.03
0.19±
0.25
0.04±
0.05
Rwanzek
uma
285.63±3
40.63
403.17±1
54.14
190.75±
73.29
2.59±
0.78
7.16±
0.45
1.46±
0.87
70.55±
32.53
0.00±
0.03
34.63±
16.83
0.41±
0.27
25.16±
13.12
79.16±70
.68
0.61±
0.77
9.63±8.
95
0.03±
0.01
0.13±
0.08
0.04±
0.06
Ruganwa
263.94±3
99.66
484.17±2
37.16
186.63±
94.26
2.09±
0.82
7.31±
0.34
1.88±
0.68
72.55±
18.26
0.04±
0.07
21.00±
12.04
0.50±
0.33
30.39±
19.91
58.94±28
.84
0.71±
0.67
8.43±1
0.13
0.05±
0.01
0.13±
0.09
0.05±
0.05
Nyabugo
go T1
69.00±62.
50
384.48±1
51.93
180.00±
66.96
2.30±
1.96
6.83±
0.21
1.57±
0.75
24.29±
34.89
0.02±
0.02
6.50±5.
71
0.52±
0.50
27.98±
13.01
56.38±63
.51
1.16±
1.28
1.87±1.
08
0.04±
0.03
0.14±
0.08
0.00±
0.01
Nyabugo
go T2
217.38±4
99.07
400.33±1
65.20
183.13±
70.09
2.29±
1.70
7.04±
0.21
2.28±
1.30
27.35±
41.59
0.02±
0.04
8.13±4.
02
0.42±
0.35
26.57±
18.87
54.46±41
.27
0.97±
0.75
2.47±2.
66
0.04±
0.01
0.11±
0.07
0.02±
0.02
Nyabugo
go T3
250.63±6
39.20
408.33±1
74.07
173.25±
80.03
1.62±
0.55
6.99±
0.24
2.37±
1.44
23.54±
26.56
0.02±
0.04
9.25±4.
59
0.53±
0.35
17.91±
9.73
158.64±2
55.86
0.48±
0.32
2.13±2.
35
0.04±
0.04
0.13±
0.07
0.01±
0.02
Nyabugo
go T4
243.13±4
83.82
394.83±1
78.91
170.63±
81.18
1.90±
0.50
7.00±
0.37
2.07±
0.57
29.21±
46.30
0.03±
0.05
9.75±5.
04
0.49±
0.34
15.7±5.
37
93.06±69
.21
0.69±
0.60
3.13±2.
83
0.02±
0.01
0.12±
0.06
0.03±
0.07
Nyabugo
go T5
169.88±3
65.47
392.50±1
70.61
165.13±
81.43
1.94±
1.14
7.01±
0.35
2.35±
0.78
25.10±
37.72
0.02±
0.04
8.50±3.
96
0.40±
0.37
35.21±
37.60
70.64±50
.06
1.08±
0.99
7.67±9.
07
0.03±
0.01
0.15±
0.08
0.01±
0.02
Mpazi
646.88±9
03.74
261.70±1
08.40
133.75±
53.16
3.80±
1.62
7.20±
0.28
0.85±
0.48
69.10±
33.81
0.02±
0.01
13.13±
17.50
0.30±
0.19
19.12±
10.45
127.23±1
64.52
1.64±
1.65
6.6±6.8
2
0.08±
0.06
0.13±
0.07
0.01±
0.01
Nyabugo
go 4
642.75±8
75.49
200.27±8
7.14
95.63±3
5.34
3.90±
1.54
7.18±
0.34
0.43±
0.24
8.95±2
7.93
0.01±
0.02
6.13±4.
05
0.28±
0.13
27.57±
7.22
97.38±10
4.34
1.64±
1.54
5.70±8.
11
0.04±
0.02
0.19±
0.14
0.03±
0.05
Yanze
506.13±1
231.26
57.77±23
.88
30.88±8
.64
6.03±
2.25
7.04±
0.63
0.24±
0.25
28.90±
11.47
0.00±
0.00
4.63±2.
62
0.43±
0.68
18.92±
13.94
76.80±64
.47
0.76±
0.60
7.33±1
0.89
0.05±
0.04
0.14±
0.07
0.00±
0.00
Nyabugo
go 5
1725.75±
4124.37
191.68±9
3.74
88.13±4
4.11
5.23±
2.07
6.99±
0.33
0.58±
0.85
12.35±
3.96
0.01±
0.01
7.38±4.
72
0.27±
0.12
24.35±
13.64
76.17±69
.42
2.03±
1.85
3.33±3.
80
0.06±
0.04
0.13±
0.08
0.02±
0.03
Nyabaro
ngo 1
805.93±7
37.44
285.88±3
86.82
43.14±2
0.31
4.98±
1.89
7.39±
0.20
0.41±
0.47
35.54±
32.24
0.02±
0.01
5.43±3.
55
0.46±
0.42
24.15±
13.11
65.12±33
6.91
2.22±
2.59
17.79±
22.51
0.05±
0.02
0.14±
0.05
0.06±
0.06
Assessment of Water Pollution Levels in the Nyabugogo Catchment, Rwanda The Open Environmental Engineering Journal, 2011, Vol. 4 51
Table 1. cont….
Turbidit
y
EC TDS DO pH
NH
4
_
N
NO
3
-N
NO
2
-
N
SO
4
-
PO
4
-
P
BOD
5
COD Fe Mn Pb Cr Zn
Nyabaro
ngo 2
737.28±5
71.03
376.08±4
47.85
55.00±2
1.39
5.65±
2.47
7.43±
0.27
0.26±
0.33
28.79±
20.94
0.03±
0.03
5.38±6.
19
0.37±
0.37
19.32±
7.74
99.20±85
.45
3.67±
5.56
18.46±
24.34
0.05±
0.04
0.14±
0.06
0.11±
0.20
Aquatic
Life limit
[20]
5.5-
9.5
6.5-
9.0
0.02 0.30
Not
defined
0.001
-
0.007
0.010 0.03
WHO
Drinking
Water
Guide-
line [17]
1 - <500 -
6.5 –
8.5
- 11 0.06 <500 - - - 2.00 0.4 0.01 0.05 3.00
Irrigation
use limit
[21]
<700 <450
6.5-
8.0
<5 5.00 0.02 0.2
Not
defin
ed
5
(pH>
6.5)
Table 2. Assessment of Results for Major Parameters Against Selected Water Quality Standards
Parameter Assessment Against Selected Standards Probable Source and/or Recommendation
Turbidity
Turbidity was generally higher than standard limits for points upstream
which were receiving runoff from disturbed catchments and was reduced
by wetland polishing
Activities around Rusine, Marenge and Mpazi need to be
controlled to reduce erosion and sedimentation.
EC, TDS,
DO and pH
On average EC and TDS were not a problem compared to guideline
values. Do and pH values were generally within guideline values.
NH
4
-N
The results were generally low compared to [15], though no guideline
value is given. The maximum value of 2.37 mg/L was recoreded at
Nyabugogo T3.
High levels are probably due to fertiliser washoffs from the
Nyacyonga Flower Farm and organic waste from the
Kabuye Sugar Factory.
NO
3
-N
NO
3
-N values were generally higher than the guidelines values for drink-
ing and irrigation use. Particularly high values were recorded at Rwan-
zekwuma, Ruganwa and Mpazi River.
Points with high values drain residential and industrial areas
of Kigali, indicating domestic pollution.
PO
4
-P
No guideline value is given for PO
4
-P, but the observed average values are
all below 1 mg/L which is considered very low compare to values re-
ported in literature [15, 16].
Lowlevels of phosphorus could be attributed to natral
pollution although it is suspected that domestic sewage is
still playing a role but the impact would be buffered by the
extensive Nyabugogo Swamp.
COD and
BOD
5
COD and BOD
5
are not specified in the guideline values used. The highest
COD value of about 293 mg/L was recorded at Rusine upstream, whilst
the highest BOD
5
value of about 35 mg/L was downstream at Nyabugogo
T5.
The source of high COD values at Rusine, where BOD5 is
much lower, needs further investigation as it seems there are
some chemical discharges upstream. The high BOD5 value
at Nyabugogo T5 is most likely due to organic matter
discharges from the Kabuye Sugar Factory.
Fe and Mn
The standard for aquatic life limit was on average, exceeded at all the
points but values were all below the irrigation limit. High values were
observed at Marenge, Rusine and Nyabarongo 2.
These are related to the geological nature of the soils and
their subsequent disturbance in mining activities. High
values at Nyabarongo 2 are due to the discharge of iron and
manganese removal processes at the Nzove Waterworks.
Pb
Lead levels exceeded limits for aquatic life and drinking water but were
all below limit for irrigation.
Source of lead unknown as Usanzineza et al. [5] also
reported high levels in Lake Muhazi. Could be relared to
geology of the area.
Cr The chromium levels exceeded drinking water limit for all points. Geological formation.
Zn
Zinc levels were very low for upstream points and incresed to above limit
of aquatic life in the urbanised part of Kigali. However, levels were all
belo limits for drinking and irrigation purposes.
Zinc is originating from urban areas and its source needs to
be pinpointed. There is also a possibility that Zinc is also
being removed in groundwater treatment processes at Nzove
Waterworks.
52 The Open Environmental Engineering Journal, 2011, Vol. 4 Nhapi et al.
Table 3. Summary of Monthly Results for the Period Oct’08 to May’09 Showing Mean Values ± Standard Deviation
Parameter T-Test, P (T<=t)
Turbidity 0.64
EC 0.49
TDS 0.18
DO 0.75
pH 0.59
NH
4
_N 0.13
NO
3
-N 0.24
NO
2
-N 0.23
TN 0.14
SO
4
- 0.03
PO
4
-P 0.16
TP 0.12
BOD
5
0.19
COD 0.37
Fe 0.37
Mn 0.34
Pb 0.99
Cr 0.13
Zn 0.58
NTU = Nephelometric Turbidity Units
Pb = Lead
Pb = Lead
pH = potential of Hydrogen
PO
4
-P = Phosphates
SIDA/SAREC = Swedish International Development
Cooperation Agency/Swedish Inter-
national Development Cooperation
Agency
SO
4
= Sulphates
TDS = Total Dissolved Solids
TN = Total Nitrogen
TP = Total Phosphorus
VICRES = Lake Victoria Research Initiative
Zn = Zinc
REFERENCES
[1]
MINIFRA, Kigali Conceptual Master Plan. November, 2007.
Available at
(Accessed April, 2011).
[2] G. Brenniman, W. Hallenbeck, L. Twagirimana, and J. Gasana,
“Industrial discharges of metals in Kigali, and the impact on drink-
ing water quality”, Environ. Contam. Toxicol., vol. 58, pp. 523-
526, 1997.
[3] E. Nkuranga, “Heavy metal removal and accumulation by an Ur-
ban Natural Wetland: The Nyabugogo Swamp, Rwanda”, MSc
Thesis, UNESCO-IHE Institute for Water Education, Delft, The
Netherlands, 2007.
[4] D. Usanzineza, I. Nhapi, U.G. Wali, J.J. Kashaigili and N.
Banadda, “Nutrients Inflow and levels in Lakes: A Case Study of
Lake Muhazi, Rwanda”, Ecol. Develop. Sum. vol. 19, no. S11, pp.
53-62, 2011.
[5] D. Usanzineza, I. Nhapi, U.G. Wali, J. J. Kashaigili and N.
Banadda, “Distribution of heavy metals in lake muhazi, rwanda”, in
10
th
WaterNet/WARFSA/GWP Symposium, IWRM: Environmental
Sustainability, Climate Change and Livelihoods; October, 2009.
[6] D. Muhirwa, I. Nhapi, U.G. Wali, N. Banadda, J. J. Kashaigili J.J.
and R. Kimwaga, “Characterisation of wastewater from the Ny-
abugogo Abattoir, Rwanda and the impact on downstream water
quality”, Int. J. Ecol. Develop. Sum. 2010; vol. 16, no. S10: pp. 30-
46, 2010.
[7] R. Mukankomeje, P. D. Plisnier, J. P. Descy and L. Massaut, “Lake
Muhazi, Rwanda: limnological features and phytoplankton produc-
tion”, Hydrobiologia, vol. 257, pp. 107-120, 1993.
[8] A. J. Nshimiyimana, “A comparative assessment of intake systems
at Yanze, Kadahokwa, Nyabarongo and Shyogwe water treatments
plants” MSc Thesis, National University of Rwanda, Rwanda,
2008.
[9]
P. A. Scheren, , A. C. Ibe, F. J. Janssen and A. M. Lemmens, “En-
vironmental pollution in the Gulf of Guinea – a regional approach”,
Mar. Pollut. Bull., vol. 44, no. 7, pp. 633-641, 2002.
Assessment of Water Pollution Levels in the Nyabugogo Catchment, Rwanda The Open Environmental Engineering Journal, 2011, Vol. 4 53
[10] L. M. Campbell, J. S. Balirwa D. G. Dixon, and R. E. Hecky,
“Biomagnification of mercury in fish from Thruston Bay, Napo-
leon Gulf, Lake Victoria, East Africa”, Afr. Aquat. Sci. vol. 29, no
1, pp. 91-96, 2004.
[11] S.P. Tjallingii, Strategies in Urban water design, in hydrological
processes and water management in urban areas Proceedings of the
Duisberg Symposium, April 1988. IAHS Publ. no. 198, 1990.
[12] E.D. Ongley. Water quality management: design, financing and
sustainability considerations. In Proceedings of the African Water
Resources Policy Conference, Nairobi, May 26-28, 1999.
[13] Friends of the Earth. Environmental impact assessment (EIA): a
campaigner's guide, London, UK, 2005, Available on
www.foe.co.uk (accessed April 2011).
[14] AWWA/WEF/APHA “ Standard Methods for the examination of
water and wastewater”, 21
th
ed, American Public Health Associa-
tion, Washington, 2005.
[15] A. Mvungi, R. K. Hranova and D. Love. “Impact of home indus-
tries on water quality in a tributary of the Marimba River, Harare:
implications for urban water management”, Phys. Chem. Earth,
Parts A/B/C, vol. 28, no. 20-27, pp. 1131-1137, 2003
[16] Jonathan O. Okonkwo, M. Mothiba Physico-chemical characteris-
tics and pollution levels of heavy metals in the rivers in Thohoyan-
dou, South Africa. J. Hydrol. vol. 308, pp. 122-127, 2005.
[17] WHO (World Health Organization). (2004). Guidelines for drink-
ing-water quality, third edition, incorporating first addendum (third
edition). 2004. (Ac-
cessed November, 2007).
[18] M. Felipe-Sotelo, J.M. Andrade, A. Carlosena, R. Tauler, “Tempo-
ral characterisation of river waters in urban and semi-urban areas
using physico-chemical parameters and chemometric methods”,
Anal. Chim. Acta. vol. 583. pp. 128-137, 2007.
[19] Nzeyimana V, “Assessment of Groundwater Quality in Nyagatare
and Gatsibo Districts, Rwanda”, Unpublished MSc. Thesis, Na-
tional University of Rwanda, Butare, Rwanda, 2008.
[20] CCME (Canadian Council of Ministers of the Environment). Cana-
dian Water Quality Guidelines, 2004. />rcqe/English/Ceqg/Water/default.cfm (Accessed November, 2007).
[21] M.B. Pescod, wastewater treatment and use in agriculture – FAO
irrigation and drainage paper 47Food And Agriculture Organiza-
tion Of The United Nations, Rome, 1992.
Received: December 06, 2010 Revised: April 13, 2011 Accepted: April 15, 2011
© Nhapi et al.; Licensee Bentham Open.
This is an open access article licensed under the terms of the Creative Commons Attribution Non-Commercial License
( which permits unrestricted, non-commercial use, distribution and reproduction in any medium, provided the
work is properly cited.