Báo cáo khoa học: Specific Ca2+-binding motif in the LH1 complex from photosynthetic bacterium Thermochromatium tepidum as revealed by optical spectroscopy and structural modeling pdf
Bạn đang xem bản rút gọn của tài liệu. Xem và tải ngay bản đầy đủ của tài liệu tại đây (838.9 KB, 11 trang )
Specific Ca
2+
-binding motif in the LH1 complex from
photosynthetic bacterium Thermochromatium tepidum as
revealed by optical spectroscopy and structural modeling
Fei Ma
1,3
, Yukihiro Kimura
2
, Long-Jiang Yu
2
, Peng Wang
1
, Xi-Cheng Ai
1
, Zheng-Yu Wang
2
and
Jian-Ping Zhang
1
1 Department of Chemistry, Renmin University of China, Beijing, China
2 Faculty of Science, Ibaraki University, Mito, Japan
3 Beijing National Laboratory for Molecular Science, State Key Laboratory for Structural Chemistry of Unstable and Stable Species, Institute
of Chemistry, Chinese Academy of Sciences, China
Light-harvesting (LH) complexes are transmembrane
proteins that are involved in the primary steps of bac-
terial photosynthesis: capturing the sun light and trans-
ferring the energy, in the form of electronic excitation,
to the reaction center (RC). Most purple bacteria con-
tain two basic types of LH complexes, i.e. the periph-
eral antenna LH2 and the core antenna LH1 [1–3].
X-ray crystallographic structures of LH2 are available
for Rhodopseudomans (Rps.) acidophila strain 10050 [4]
and Rhodospirillum (Rs.) molischianum [5] with resolu-
tions of 2.0–2.5 A
˚
. Although the highest available reso-
lution for LH1 [6], 4.8 A
˚
, is not sufficient to display
the structural details, it clearly shows that bacterio-
chlorophyll (BChl) dimers are sandwiched between
a- and b-helices of 15 or 16 subunits arranged in a
ring-like manner around the RC. In addition, the
Keywords
3D structural modeling; light-harvesting–
reaction center core complex (LH1–RC);
photosynthetic purple bacterium;
Raman spectroscopy; Thermochromatium
(Tch.) tepidum
Correspondence
Z Y. Wang, Faculty of Science, Ibaraki
University, Mito 310 8512, Japan
Fax: +81 29 2288352
Tel: +81 29 2288352
E-mail:
J P. Zhang, Department of Chemistry,
Renmin University of China, Beijing
1000872, China
Fax: +86 10 62516444
Tel: +86 10 62516604
E-mail:
(Received 25 November 2008, revised 14
January 2009, accepted 14 January 2009)
doi:10.1111/j.1742-4658.2009.06905.x
Native and Ca
2+
-depleted light-harvesting–reaction center core complexes
(LH1–RC) from the photosynthetic bacterium Thermochromatium (Tch.)
tepidum exhibit maximal LH1–Q
y
absorption at 915 and 889 nm, respec-
tively. To understand the structural origins of the spectral variation, we
performed spectroscopic and structure modeling investigations. For the
889 nm form of LH1–RC, bacteriochlorophyll a (BChl a) in the native
form was found by means of near-infrared Fourier-transform Raman spec-
troscopy, a higher degree of macrocycle distortion and a stronger hydrogen
bond with the b-Trp
)8
residue. SWISS-MODEL structure modeling sug-
gests the presence of a specific coordination motif of Ca
2+
at the C-termi-
nus of the a-subunit of LH1, while MODELLER reveals the tilt of a- and
b-polypeptides with reference to the structural template, as well as a change
in the concentric orientation of BChl a molecules, both of which may be
connected to the long-wavelength LH1–Q
y
absorption of the 915 nm form.
The carotenoid spirilloxanthin shows a twisted all-trans configuration in
both forms of LH1 as evidenced by the resonance Raman spectroscopic
results. With regard to the thermal stability, the 915 nm form was shown
by the use of temperature-dependent fluorescence spectroscopy to be
approximately 20 K more stable than the 889 nm form, which may be
ascribed to the specific Ca
2+
-binding motif of LH1.
Abbreviations
BChl a, bacteriochlorophyll a; Car, carotenoid; fwhm, full width at half maximum; LH1, light-harvesting complex 1; Q
y
, the absorptive optical
transition to the lowest excited state of BChl a; RC, reaction center.
FEBS Journal 276 (2009) 1739–1749 ª 2009 The Authors Journal compilation ª 2009 FEBS 1739
structures of a- and b-polypeptides in solution were
determined for Rs. rubrum by means of 2D-NMR
spectroscopy [7].
The purple photosynthetic bacterium Thermochro-
matium (Tch.) tepidum was first identified in Mammoth
Hot Springs in the Yellowstone National Park [8]. It is
a moderate thermophile with an optimal temperature
range of 48–50 °C and an upper limit of 55 °C, and its
pigment–protein complexes show considerably higher
thermal stability than those from its mesophilic
counterparts such as Allochromatium (Ach.) vinosum,
Rhodobacter (Rb.) sphaeroides and Blastochloris (Bl.)
viridis, which grow at temperatures below approxi-
mately 30 °C [9]. The light-harvesting–reaction center
core complex (LH1–RC) from Tch. tepidum is peculiar
with respect to its long-wavelength Q
y
absorption of
BChl a at 915 nm, which shifts to approximately
885 nm when eluted in presence of NaCl, KCl, KBr,
NaCl or MgCl
2
(150 mm). Interestingly, the 885 nm
LH1–RC complex can be fully converted back to the
915 nm form by adding CaCl
2
[10,11].
Recently, polypeptides of LH1 from Tch. tepidum
have been purified and the amino acid sequences deter-
mined [12]. In addition, the dimeric feature and the
highly symmetric ring assembly of BChls in LH1, as
well as the interaction between BChl a and carotenoid
molecules, have been confirmed [13]. It has been shown
that spirilloxanthin is the major carotenoid (approxi-
mately 92.3%), and that the 889 nm form of LH1–RC
is thermally less stable than the 915 nm form [11,13].
Furthermore, Ca
2+
has been proven to coordinate in a
ratio of 1 : 1 to an a-, b-subunit when the 889 to
915 nm transformation is induced [11]. Our recent study
on the excitation dynamics of the two forms has shown
similar LH1-to-RC excitation trapping kinetics, as well
as similar efficiency of the transfer of excitation energy
from carotenoid to BChl despite some differences in the
BChl-to-carotenoid molecular orientation [14].
Ca
2+
plays vital roles in biological activities, e.g. as
messengers of signal transduction in the cell, and for
structural stabilization of proteins, etc. [15]. Ca
2+
in
protein usually coordinates seven oxygen atoms from
amino acid residues and water molecules, which
accordingly form a pentagonal bi-pyramid cavity.
However, coordination with 6, 8 or even up to 12
atoms is also possible. A helix-loop-helix structural
domain constituting the Ca
2+
binding motif is found
in a large number of Ca
2+
-binding proteins, and is
also known as the EF hand [16]. Proteins containing
the EF hand are divided into two classes according
to their functions: signaling and buffering ⁄ transport
proteins. The former undergoing Ca
2+
-dependent
conformational changes, constitute the largest family,
including well-known members such as the Ca
2+
-AT-
Pase from skeletal muscle sarcoplasmic reticulum
whose transmembrane helices tilt approximately 30°
when transformed from the Ca
2+
-bound form
(E1Ca
2+
) to the Ca
2+
-free form [E2(TG)] [17,18].
The interchangeable 915 and 889 nm forms of LH1–
RC from Tch. tepidum provide us with a unique
opportunity to investigate the structure–function rela-
tionship of these proteins. In the present study, we
used near-infrared Fourier-transform Raman spectros-
copy (FT-Raman) to assess the structural differences
in BChl a molecules between the two forms of LH1–
RC. Compared to the 889 nm form, the 915 nm form
shows a stronger hydrogen bond (H-bond) interaction
between the C
10a
acetyl carbonyl and the tryptophan
(Trp) residue from the b-polypeptide, b-Trp
)8
, and
more severe distortion of the BChl a macrocycle. Fur-
thermore, the twist of all-trans spirilloxanthin was
found to be similar between the two LH1–RC forms
by use of resonance Raman spectroscopy. The results
of 3D structural modeling reveal a specific Ca
2+
-coor-
dination cavity that may induce configurational
changes in the polypeptides, and, as a result, in BChl a
molecules. The results are discussed in terms of the
long-wavelength Q
y
absorption of native LH1–RC.
Furthermore, the systematic shift of fluorescence spec-
tra against temperature shows that the thermal stabil-
ity of the intact LH1–RC is approximately 20 K
higher than that of Ca
2+
-depleted LH1–RC.
Results and Discussion
Steady-state absorption and fluorescence
spectroscopy
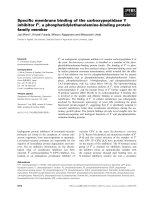
The 915 nm form of LH1–RC exhibits much higher
thermal stability than the 889 nm form. As shown in
Fig. 1A, the absorption spectra of 915 nm LH1–RC
vary slightly from 273 to 323 K, i.e. the LH1–Q
y
absorbance decreases approximately 3% with little
change in band width. In contrast, for the 889 nm
form under similar experimental conditions, dramatic
decreases in the LH1–Q
y
and carotenoid absorption
are seen (Fig. 1B), together with emergence of a new
absorption maximum at 770 nm that is ascribed to
monomeric BChl a. When the temperature exceeds
303 K, a large spectral change is seen, most likely due
to disassembly of the LH1 complex.
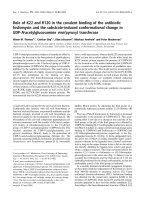
Upon increasing temperature, the fluorescence peak
wavelengths of both the 915 and 889 nm forms shift to
blue, and the emission bands get broader (Fig. 2). For
the 915 nm form, the peak wavelength shifts from
945.4 to 939.5 nm, and the bandwidth increases from
Ca
2+
-binding motif in an LH1 complex F. Ma et al.
1740 FEBS Journal 276 (2009) 1739–1749 ª 2009 The Authors Journal compilation ª 2009 FEBS
494 to 553 cm
)1
[full width at half maximum (fwhm)]
on raising the temperature from 273 to 323 K. The
increase in spectral shift or bandwidth in response to
the increase in temperature may indicate the involve-
ment of more thermally populated excitonic states in
the Q
y
-state manifold of BChl a. Using an energy dif-
ference of 120 cm
)1
between the lowest and the second
lowest excitonic states [19], the population increase in
the second lowest excitonic state in response to a
temperature increase of 50 K was estimated to be
6.4%. Given the amount of spectral shift (66 cm
)1
)
and band broadening (57 cm
)1
), it is reasonable to
ascribe the fluorescence spectral changes to a new ther-
mal equilibrium in the Q
y
state. As shown in the inset
to Fig. 2A, the spectra shift slowly to blue against a
temperature increase below 293 K, and the shift is
faster and shows linear temperature dependence above
293 K. In addition, the decrease in fluorescence inten-
sity may be due to the increased rate of internal con-
version. On the other hand, when the temperature
increases from 273 to 303 K, the fluorescence maxi-
mum of the 889 nm form shifts from 918.8 to
914.1 nm, while the bandwidth increases from 534 to
569 cm
)1
(fwhm). When the temperature exceeds
303 K, the fluorescence intensity decreases consider-
ably due to dissociation of the LH1–RC assembly.
The tendency of spectral shift appears to be signifi-
cantly different between the two LH1–RC forms, i.e.
nonlinear and linear temperature dependence are
observed for the 915 and 889 nm forms, respectively,
which may reflect their structural differences. The
915 nm LH1–RC form exhibits slower (273–293 K)
and faster (293–323 K) phases of band shift (Fig. 2A);
however, the 889 nm complex shows monophasic
behavior (273–303 K; Fig. 2B) with a slope compara-
ble to the faster phase of the 915 nm form. Comparing
300 400 500 600 700 800 900 1000
300 400 500 600 700 800 900 1000
0.00
0.05
0.10
0.15
0.20
323 K
293 K
273 K
LH1-Q
y
Car
Wavelength (nm)
Wavelength (nm)
0.00
0.05
0.10
0.15
323 K
313 K
303 K
293 K
283 K
770 nm
273 K
Car
LH1-Q
y
Absorbance
Absorbance
A
B
Fig. 1. Steady-state UV-visible spectra of the 915 nm (A) and
889 nm (B) LH1–RC preparations from Tch. tepidum at the indi-
cated temperatures. Arrows in (B) indicate the direction of absor-
bance change upon temperature increase from 273 to 323 K.
900 950 1000
0
1000
2000
3000
10 580
10 600
10 620
10 640
Wavelength (nm)
Wavelength (nm)
900 950
0
1000
2000
3000
270 280 290 300
270
280 290 300 310 320
10 880
10 900
10 920
10 940
Fluorescence intensity / a.u.
Fluorescence intensity / a.u.
A
B
T/K
T/K
ν
m
·cm
–1
ν
m
·cm
–1
Fig. 2. Fluorescence emission spectra recorded at various temper-
atures for the 915 nm (A) and 889 nm (B) LH1–RC preparations
from Tch. tepidum. Arrows show the direction of temperature
change from 273 to 323 K in (A) and from 273 to 303 K in (B).
Insets show the change of emission maxima (in wave number)
against temperature. The excitation wavelength was 590 nm.
F. Ma et al. Ca
2+
-binding motif in an LH1 complex
FEBS Journal 276 (2009) 1739–1749 ª 2009 The Authors Journal compilation ª 2009 FEBS 1741
the 915 and 889 nm forms, a difference of 20 K in the
starting temperature of the faster phases was found
(293 versus 273 K), indicating that the pigment–pro-
tein assembly of the 915 nm complex is more stable,
most likely because of the binding of Ca
2+
. This result
is in agreement with a recent differential scanning calo-
rimetry study on the same core complexes [20], in
which the dissociation temperature of the 915 nm form
was found to be 15 K higher than that of the 889 nm
form, and the enthalpy change for the former was
found to be approximately 28% larger than that for
the latter.
The Stokes shifts between absorption and fluores-
cence maxima are 28.9–24.5 nm for the 915 nm form
and 29.8–25.1 nm for the 889 nm form over the tem-
perature ranges 273–323 and 273–303 K, respectively,
and are considerably larger than those of mesophilic
purple bacteria such as Rs. rubrum (approximately
15 nm). Therefore, for Tch. tepidum, the spectral over-
lap integral between LH1 emission and RC absorption
(maximum at 865 nm) must be much smaller. How-
ever, the rates of LH1-to–RC excitation energy trans-
fer are rather similar from the thermophilic to the
mesophilic species [14], implying that the rate is not
strictly proportional to the spectral overlap integral.
Resonance Raman spectroscopy
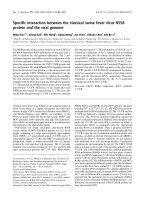
Figure 3A shows the resonance Raman spectrum of a
915 nm form with spirilloxanthin as the major caro-
tenoid component (approximately 92.3%). The key
Raman lines at 1504 cm
)1
(m
1
, C=C stretching) and
1143 cm
)1
(m
2
, C–C stretching) can be assigned to
all-trans spirilloxanthin in LH1. The Raman bands
from 15-cis spirilloxanthin in the RC normally seen at
1528, 1239 and 1160 cm
)1
[21] do not show up because
the majority of spirilloxanthin molecules associate with
LH1 and only a minor amount in the 15-cis configura-
tion binds preferentially to the RC [22]. The Raman
band at approximately 965.3 cm
)1
is characteristic of
the out-of-plane movement of C–H (m
4
), which
becomes symmetry-allowed only when the polyene
backbone experiences nonplanar distortion [23]. As the
m
4
mode is localized to and originates from the twists
at C
11
=C
12
and C
7
=C
8
and their conjugates, C
11¢
C
12¢
and C
7¢
C
8¢
, it is concluded that all-trans spirilloxan-
thin bound to LH1 takes on a twisted configuration,
similarly to the case for LH1 of Rs. rubrum [21,23].
The Raman spectra do not change appreciably
between the 915 and 889 nm LH1–RC forms, indicat-
ing that the configuration of spirilloxanthin does not
vary despite a large difference in the Q
y
absorption
wavelength of BChl a (26 nm). A similar conclusion
was reached in a recent investigation of the same com-
plexes by means of circular dichromism spectroscopy
[11].
Near-infrared FT-Raman spectroscopy
Figure 4 shows the FT-Raman spectra for the 915 and
889 nm LH1–RC forms from Tch. tepidum, and
Table 1 lists the assignments based on recent work by
Frolov et al. [24]. The key Raman lines labeled with
carotenoid correspond to the m
1
(1504 cm
)1
), m
2
(1147 cm
)1
) and m
3
(1023 cm
)1
) modes of spirilloxan-
thin (see above), while those labeled R1–R4 originate
ν
4
ν
3
ν
2
Intensity / a.u.
ν
1
Raman shift·cm
–1
800 1000 1200 1400 1600
967.4
997
1145
1187
1278
1352
1387
1447
1504
997
965.3
1143
1185
1276
1352
1392
1444
1504
A
B
Fig. 3. Room-temperature resonance Raman spectra for the
915 nm (A) and 889 nm (B) LH1–RC preparations from Tch. tepi-
dum. The excitation wavelength was 514 nm.
∗
∗
1675
1671
1065
1641
1641
∗
∗
∗
∗
∗
1171 (R4)
1444 (R3)
1534 (R2)
1609 (R1)
1170 (R4)
1436 (R3)
1540 (R2)
Intensity
/
a.u.
1610 (R1)
1000
1200
1400
1600
Raman shift·cm
–1
1024 (ν
3
)
1147 (ν
2
)
1147( ν
2
)
1023 (ν
3
)
1504 (ν
1
)
1504 (ν
1
)
A
B
Fig. 4. Room-temperature FT-Raman spectra for the 915 nm (A)
and 889 nm (B) LH1–RC core complexes from Tch. tepidum. The
excitation wavelength was 1064 nm.
Ca
2+
-binding motif in an LH1 complex F. Ma et al.
1742 FEBS Journal 276 (2009) 1739–1749 ª 2009 The Authors Journal compilation ª 2009 FEBS
from BChl a, and are sensitive to the core size of bac-
teriochlorin and the molecular conformation of BChl a.
These modes are known to be conserved in various LHs
[25,26]. It is worthy of noting that the band at
1065 cm
)1
in the Raman spectrum of 915 nm LH1–RC
is not seen in the 889 nm form (Fig. 4A,B), probably
due to variation in the resonance conditions of Raman
excitation [24].
For both forms of LH1–RC, the presence of meth-
ane bridge stretching at approximately 1610 cm
)1
(R1)
confirms the penta-coordination of BChl a molecules
[27] that is often seen when the a- and b-polypeptides
of LH1 have higher flexibility [28]. Raman lines R5 or
R6 overlapped with the intense carotenoid band (m
3
)
and therefore cannot be resolved. For both the 915
and 889 nm forms, the R1 and R4 Raman lines appear
at similar frequencies (Table 1); however, the R2 and
the R3 frequencies vary considerably, i.e. 1540 versus
1531 cm
)1
and 1436 versus 1444 cm
)1
, respectively.
The R1–R4 lines of the LH1 complexes from Rb. sph-
aeroides 2.4.1 and Rhodospirillum (Rsp.) rubrum G
9
[26] are conserved in the 889 nm LH1–RC form from
Tch. tepidum. Therefore, the macrocycle configurations
of BChl a are most likely similar among these com-
plexes. However, the R2 and R3 lines and those with
asterisks in the Raman spectrum of the 915 nm form
are distinctly different from those of the 889 nm form,
both in frequency and intensity, suggesting significant
differences in the BChl a conformations between the
two LH1–RC forms of Tch. tepidum. According to
recent theoretical studies on the peridinin–chlorophyll–
protein complex and the light-harvesting complex II
Table 1. Raman shifts obtained from the near-infrared FT-Raman spectra of BChl a in the 915 and 889 nm LH1–RC forms from Tch. tepi-
dum (see Fig. 4) and the corresponding assignments. ‘Carotenoid’ indicates that the Raman lines of BChl a overlap with those originating
from carotenoid. Intensities are indicated after the Raman shifts.
Raman shift (cm
)1
)
Key Raman
lines
b
Assignments
c
915 nm LH1 889 nm LH1 LH1 ⁄ LH2
a
1671 s 1676 m 1640–1680 mC
9
=O, mC
10a
=O
1641 m 1641 m 1630–1660 mC
2a
=O
1610 w 1609 vw 1608–1609 R1 as mC
a
C
m
(a, b, c, d)
1585 w 1594 vw 1570–1590 as mC
a
C
m
(c, d)
1567 w 1567 w as mC
a
C
m
(a, b)
1540 sh 1534 sh 1530–1537 R2 mC
b
C
b
,smC
a
C
m
(c), mCN(III)
1456 vw — — s mC
a
C
m
(a), mCN(II)
1436 vw 1444 w 1444–1445 R3 CH
3
bend, s mC
a
C
m
(d), mCN(IV)
— 1408 sh 1406–1409 CH
3
bend, C
6
C
16
1394 sh 1391 w 1408–1415 mCN(I), dC
m
H(a, d), CH
3
bend
1372 m 1370 w 1385–1396 dC
m
H(d), CH
3
bend
1354 sh 1350 vw 1371–1376 mCN(III), dC
m
H(b), CH
3
bend, d defs
1331 vw 1333 sh 1346–1348 mCN(III), dC
m
H(b), CH
3
bend,
CH
2
bend, CH bend1291 m 1291 m 1284–1288
1279 m 1281 m 1273–1277 CH
3
bend, CH bend
1258 w 1253 m 1252–1257 mCN(IV), mC
7
C
17
, d defs
1236 m 1206 sh 1235–1237 dC
m
H(d), mC
a
C
b
(II), CH
2
bend,
CH bend1194 sh 1209–1212
1170 sh 1171 sh 1173–1175 R4 dC
m
H(b)
carotenoid vs carotenoid vs 1142 ⁄ 1137 ⁄
carotenoid
R5 mCN(III), mC
5
C
5a
, CH bend
1117 sh 1116 m 1116–1119 mCN(I)
1093 vw 1089 vw 1090–1095
1065 s — 1065–1066 d (IV), CH
3
bend, CH
2
bend
carotenoid s carotenoid s 1024 ⁄ 1029 ⁄
carotenoid
R6 CH
3
bend, mCC (saturated)
1000 m 998 vw 1000–1003 CH
3
bend, mC
2a
=O
969 w 959 m 967–969 mC
10b
O, mC
10
C
10a
,
948 w 949–952 d defs
— 927 w 925–927 s dNCC
m
(d)
a
These Raman frequencies are from reference [25] and are given for comparison.
b
R1–R4 are key Raman lines that are sensitive to the core
size of BChl a [26].
c
Assignments based on reference [24]. See Scheme 1 for the numbering system of BChl a .
F. Ma et al. Ca
2+
-binding motif in an LH1 complex
FEBS Journal 276 (2009) 1739–1749 ª 2009 The Authors Journal compilation ª 2009 FEBS 1743
(LHCII) chlorophylls [29], distortion of the Chl a mac-
rocycle is the key structural factor governing the Q
y
absorptive transition energy.
As seen in Fig. 4 (and with reference to the number-
ing system of BChl a in Scheme 1), the three Raman
lines above 1600 cm
)1
for the 915 nm ⁄ 889 nm forms
may be ascribed to the stretching modes of the
methane bridge (1610 ⁄ 1609 cm
)1
), the C
2
acetyl
(1641 ⁄ 1641 cm
)1
) and the C
9
keto–C
10a
acetyl carbo-
nyls (1671 ⁄ 1676 cm
)1
). It is known that, for free
BChl a in nonpolar solvent, lines for the two carbonyl
stretching modes appear at 1663 and 1685 cm
)1
, but
downshift as much as approximately 40 cm
)1
for
BChl a bound to protein via an H-bond, and, impor-
tantly, a downshift of the C
2
acetyl stretching correlates
linearly with the red shift of the Q
y
absorption [25]. As
the frequency of the particular mode at 1641 cm
)1
is
identical between the 915 and 889 nm forms, the
H-bond interaction with the C
2
acetyl carbonyl cannot
be responsible for the shift of Q
y
absorption from 915
to 889 nm. Compared with the 889 nm form, the C
9
keto ⁄ C
10a
acetyl carbonyl stretching of the 915 nm
form shows a downshift of 5 cm
)1
, indicating a stron-
ger H-bond between the Trp
)8
residue of the b-subunit
and the C
10a
acetyl carbonyl (see below).
3D modeling of Ca
2+
-binding motifs
The amino acid sequences of LH1 from Tch. tepidum
show the highest homology to the LH1 peptides from
Rs. rubrum, i.e. the 50.0% and 53.3% (E-value,
2 · 10
)11
⁄ 0) identity for a- and b-polypeptides, respec-
tively. For comparison, the corresponding identities
to LH2 of Rs. molischianum are 35.0% and 40.5%
(E-value, 2 · 10
)4
⁄ 6 · 10
)9
), respectively, and those to
the LH2 peptides of Rps. acidophila are 28.6% and
34.2% (E-value, 3 · 10
)3
⁄ 2 · 10
)5
). However, as the
available structures of the a- and b-polypeptides of
H
CH
2
H
= R
Scheme 1. BChl a chemical structure and numbering. Right, numbering of carbon atoms according to the Fischer system. Left, genetic
labeling of meso and pyrrolic carbon atoms.
Ca
2+
-binding motif in an LH1 complex F. Ma et al.
1744 FEBS Journal 276 (2009) 1739–1749 ª 2009 The Authors Journal compilation ª 2009 FEBS
LH1 from Rs. rubrum were determined independently
in solution [7], they are not suitable to serve as tem-
plates for the LH1 of Tch. tepidum with sufficient
structural details of BChl a molecules and the loop
domain at the C-terminus.
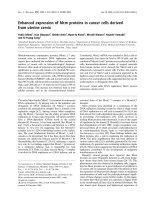
Figure 5A shows the BChl a binding sites and the
loop motif of the LH1 polypeptides of Tch. tepidum
based on SWISS-MODEL modeling using the LH2
template from Rs. molischianum; those obtained using
the LH2 template from Rps. acidophila are presented
in Fig. 5B. With regard to the possible H-bond to
BChl a, the NH
2
of b-Trp
)8
falls into close proximity
to BChl a, i.e. 3.63 A
˚
to O
10a
when the LH2 crystallo-
graphic structure of Rs. molischianum is used as a tem-
plate (Fig. 5A, upper right) and 3.62 and 5.86 A
˚
to
O
10b
and O
10a
, respectively, when the LH2 of Rps. aci-
dophila was used (Fig. 5B, upper right). In the LH2s
of Rs. molischianum and Rps. acidophila, the amino
acid corresponding to b-Trp
)8
in LH1 of Tch. tepidum
is phenylalanine (Phe), which cannot form an H-bond
with the acetyl carbonyl of BChl a. Previous 3D struc-
tural modeling of LH1 of Roseospirillum parvum 930I
proved that the H-bonds between the thiol groups of
cysteine (a-Cys
+3
, b-Cys
)4
) and BChl a are responsible
for the long-wavelength LH1–Q
y
absorption (909 nm)
[30]. Similarly, the H-bonds found in the LH1 of Tch.
tepidum may be responsible for the extremely red
absorption of BChl a (915 nm), although other factors
such as BChl–BChl excitonic interactions are certainly
also in operation.
The possible Ca
2+
coordinations optimized by
means of SWISS-MODEL modeling based on the
LH2 templates of Rs. molischianum and Rps. acidophila,
respectively, are shown in the lower right parts of
Fig. 5A,B. In both cases, the Ca
2+
-binding cavities are
localized in the C-termini, which comprise O of Leu
)4
,
Ser
)5
, Thr
)6
, OD1 of Asp
)7
and OD1 and OD2 of
Asp
)13
in Fig. 5A, O of Val
)3
, Leu
)4
, Ser
)5
, Thr
)6
,
Asp
)7
and OG of Ser
)5
in Fig. 5B (O, OD1 ⁄ 2 and OG
are oxygen atoms of the backbone carbonyl, side-chain
acetyl or hydroxyl carbonyl, and side-chain hydroxyl,
respectively). The Ca
2+
chelation motifs agree well
with the EF-hand characteristics, i.e. they tend to
localize to the helix-loop-helix motifs with a coordina-
tion number of 6 or 7.
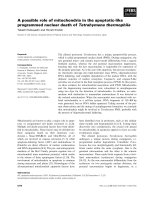
Figure 6 shows the results of MODELLER model-
ing based on an averaged template (the LH1 from
Rs. rubrum and the LH2s from Rs. molischianum and
Rps. acidophila). The H-bond between b-Trp
)8
and
BChl a and the presence of a Ca
2+
coordination cavity
(consisting of O of Val
)3
, Leu
)4
, Ser
)5
, Thr
)6
, Asp
)7
and OD2 of Ser
)13
) within a helix-loop-helix motif
are predicted, which is similar to the results of
A
B
α
α
α
α
β
α
β
β
β
Fig. 5. Three-dimensional models of a polypeptide subunit of LH1
of Tch. tepidum obtained by SWISS-MODEL modeling using the
crystallographic structures of LH2 from Rs. molischianum (A) and
Rps. acidophila (B) as templates. In each panel, the structures
within circles were magnified to show more detail and these are
shown at upper and lower right. Color codes: deep blue, secondary
structure of polypeptide subunit; orange, amino acid; green, BChl a;
red, His; pink, Trp
)8
; yellow, hydrogen atoms in NH
2
of Trp
)8
; light
grey, oxygen atoms of BChl a; purple, oxygen atoms most probably
coordinating to Ca
2+
.
F. Ma et al. Ca
2+
-binding motif in an LH1 complex
FEBS Journal 276 (2009) 1739–1749 ª 2009 The Authors Journal compilation ª 2009 FEBS 1745
SWISS-MODEL modeling. To our surprise, a consid-
erable tilt of the optimized polypeptides with respect
to the template is predicted, especially for the b-poly-
peptide. Furthermore, the orientation of the histidine
(His) coordinating to BChl a changes significantly in
a- and b-polypeptides as seen in the top right of
Fig. 6. This implies a large difference in the orientation
of BChl a molecules between the LH1 of Tch. tepidum
and the template, and, as a result, a large difference in
the BChl–BChl excitonic interactions. In addition, the
results show that the locations of a- and b-His residues
are rather different between the LH1 of Tch. tepidum
and the template. It is therefore expected that coordi-
nation of His residues to BChl a induces considerable
structural heterogeneity in the BChl a molecules bound
to a- and b-polypeptides, and this is supported by a
recent transient spectroscopic study of LH–RC forms
from Tch. tepidum [14].
Although the modeling results for Ca
2+
-induced
conformational changes in the LH1 of Tch. tepidum
are preliminary and qualitative, they reveal basic struc-
tural differences between the 915 and 889 nm forms of
LH1–RC from Tch. tepidum, e.g. the strength of the
H-bond between the b-Trp
)8
residue and the C
10a
ace-
tyl carbonyl of BChl a, the excitonic interaction among
the BChl a molecules in LH1, and deformation of the
BChl a macrocycle induced by Ca
2+
binding, all of
which may account for the low absorptive transition
energy of BChl a molecules in native LH1. We pro-
pose that the presence of a specific Ca
2+
-binding motif
in the a-, b-subunit of LH1 is responsible for the long-
wavelength LH1–Q
y
absorption of Tch. tepidum,as
well as for the high thermal stability of this particular
pigment–protein assembly.
Conclusion
Based on the spectroscopic and 3D structural modeling
results for the 915 and 889 nm forms of LH1–RC
from Tch. tepidum, this paper proposes a specific
Ca
2+
-coordination cavity localized to the C-terminus
of the a-subunit of LH1, which agrees with the
EF-hand characteristics. This Ca
2+
-binding motif may
be responsible for the reversible conformation change
in the a- and b -polypeptides between the forms, which
in turn lead to changes in the arrangement of BChl a
molecules, in the strength of the H-bond between
b-Trp
)8
and the O
10
of BChl a, and in distortion of
BChl a macrocycle. All of these structural variations
are helpful to understand the long-wavelength Q
y
absorption of the native LH1–RC complex from Tch.
tepidum. Furthermore, thermal equilibrium among the
α
α
α
α
β
β
β
Fig. 6. Three-dimensional model of the LH1
polypeptides of Tch. tepidum obtained by
MODELLER modeling based on the aver-
aged template (LH1 from Rs. rubrum and
the LH2s from Rs. molischianum and Rps.
acidophila). The model at the top right
shows details of the BChl a binding motifs
of the optimized LH1 and the template,
while that at the bottom right shows details
of the possible Ca
2+
-binding cavity; both
models are re-oriented for clarity with
respect to the model on the left. Color
code: dark green, secondary structure of
LH1 polypeptides; blue, secondary structure
of the template; orange, amino acids of LH1
polypeptides; red, His coordinating to BChl a
in LH1 of Tch. tepidum; purple, His coordi-
nating to BChl a in the template; yellow,
hydrogen atoms coordinating to BChl a; light
blue: oxygen atoms coordinating to Ca
2+
.
Ca
2+
-binding motif in an LH1 complex F. Ma et al.
1746 FEBS Journal 276 (2009) 1739–1749 ª 2009 The Authors Journal compilation ª 2009 FEBS
excitonic states of BChls and other structural changes
in the 915 nm form of LH1, as reflected by the temper-
ature-dependent fluorescence spectra, reveal higher
dissociation enthalpy of this complex with respect to
the 889 nm form, which may account for the higher
thermal stability of the native LH1–RC complex from
Tch. tepidum.
Experimental procedures
Preparation of LH1–RC complexes
Chromatophore was isolated by sonication of the Tch. tepi-
dum cells suspended in 20 mm Tris ⁄ HCl buffer (pH 8.5)
followed by differential centrifugation at 4 °C for 15 min
(5000 g). Chromatophores thus obtained were extracted
with 0.35% w ⁄ v lauryldimethylamine N-oxide at 25 °C for
60 min, followed by centrifugation at 4 °C for 90 min
(150 000 g). The LH1–RC core complex with an LH1–Q
y
absorption maximum at 915 nm (Fig. 1A) was prepared as
described previously [24]. The final concentration of LH1–
RC was determined to be approximately 10 lm by using a
molar extinction coefficient for BChl a of e
915 nm
= 4.3 ·
10
3
mm
)1
cm
)1
[11]. As the preparation was eluted using a
linear gradient of CaCl
2
from 10 to 25 mm, the ionic force
was estimated be approximately 75 mm. This LH1–RC
preparation is considered to be intact as the LH1–Q
y
absorption maximum, 915 nm, is similar to that of the
chromatophore. The 889 nm preparation, i.e. the LH1–RC
complex with an LH1–Q
y
absorption maximum at approxi-
mately 889 nm (Fig. 1B), was prepared by adding 200 mm
EDTA to the intact 915 nm form. For spectroscopic
measurements, these preparations were suspended in buffer
containing 20 mm Tris ⁄ HCl and 0.8% w ⁄ v n-octyl-b-d-
glucopyranoside (pH 7.5).
Steady-state UV-visible and near-infrared
fluorescence spectroscopy
UV-visible absorption spectroscopy with a spectral resolu-
tion of 0.5 nm was performed using a U-3310 spectropho-
tometer (Hitachi, Japan). Near-infrared fluorescence spectra
(spectral resolution of 0.25 nm) were recorded using a liquid
nitrogen-cooled linear photodiode array (OMA V: 10242.2
Princeton Instruments, Trenton, NJ, USA) attached to an
imaging polychromater (SpectraPro 2300i; Acton Research,
Acton, MA, USA), for which excitation pulses at 590 nm
(approximately 2 mJÆpulse
)1
, approximately 7 ns, 10 Hz)
were supplied by an optical parametric oscillator (Quanta-
Ray MOPO-SL; Spectra Physics, Mountain View, CA, USA)
driven by an Nd
3+
:YAG laser (Quanta-Ray PRO-230; Spec-
tra Physics). Sample temperatures were controlled exactly in
the range 273–323 K using a water-flow type thermostat
(RTE-110; Neslab Instruments Inc., Newington, NH, USA).
Resonance Raman and near-infrared FT-Raman
spectroscopy
Room-temperature resonance Raman spectra (spectral reso-
lution of 1.4 cm
)1
) were recorded with a liquid nitrogen-
cooled CCD detector (SPEC-10-400B ⁄ LN; Roper Scientific
Research, Trenton, NJ, USA) attached to a 0.5 m poly-
chromator (grating density 1200 grooves per mm, Spectro-
pro 550i; Acton Research Corporation). A continuous-wave
Ar
+
laser (2060-10S; Spectra Physics) provided the Raman
excitation power of 1.8 mW at 514 nm. Raman scattering
light was collected in a backscattering geometry, and was
focused onto the entrance slit of the polychromator after
passing through a Raman notch filter (HSNF-514.0-1.5;
Kaiser Optical Systems, Ann Arbor, MI, USA). The
Raman spectra were obtained using an exposure time of
15 s and a spectral resolution of 1.4 cm
)1
. The absorbance
of the LH1–RC samples was 5 cm
)1
at 514 nm.
Raman spectra, with pre-resonance to the Q
y
transition
of BChl a, were recorded on a FT-Raman spectrometer
(DIGILAB FTS-3500; Bio-Rad, Krefeld, Germany) with a
resolution of 0.5 cm
)1
; the excitation source was a continu-
ous-wave Nd
3+
:YAG laser operated at 1064 nm. The spec-
tra were obtained by averaging of 200 scans. The optical
densities of the two forms of LH1–RC were adjusted to
120 cm
)1
at the maximal Q
y
absorption.
3D structural modeling of LH1
The 3D modeling was performed using two methods: SWISS-
MODEL, accessed using the Deep View Swiss-PDB Viewer
version 4.0 [31–33], and MODELLER [34,35]. SWISS-
MODEL superimposes a template with the target sequence,
and is fully automated by a homology-modeling server
( The a-, b-polypeptides of
LH2 from Rps. acidophila (PDB record 1nkz) and Rs. molis-
chianum (PDB record 1lgh) as well as those of LH1 from Rs.
rubrum (PDB records 1xrd and 1wrg) were used as the
templates. MODELLER is used for homology or compara-
tive 3D modeling of protein structures. It implements com-
parative modeling by satisfaction of spatial restraints, and
can perform additional tasks such as de novo modeling of
loops, etc. We used an average of the three templates above
(multiple-model) to increase the accuracy. Five models were
thus obtained, and the one with the lowest discrete optimized
protein energy (DOPE potential) was chosen. Sequence
identity between target LH1 polypeptides from Tch. tepidum
and each template was calculated using MODELLER.
Acknowledgements
This work has been supported by the Natural Science
Foundation of China (grant nos NSFC 20703067 and
20673144, and NSFC-JSPS. 20711140133) and by the
F. Ma et al. Ca
2+
-binding motif in an LH1 complex
FEBS Journal 276 (2009) 1739–1749 ª 2009 The Authors Journal compilation ª 2009 FEBS 1747
National Basic Research Program of China (grant no.
2009CB220008).
References
1 Scheuring S, Francia F, Busselez J, Melandri BA,
Rigaud JL & Le
´
vy D (2004) Structural role of PufX
in the dimerization of the photosynthetic core com-
plex of Rhodobacter sphaeroides. J Biol Chem 279,
3620–3626.
2 Siebert CA, Qian P, Fotiadis D, Engel A, Hunter CN
& Bullough PA (2004) Molecular architecture of photo-
synthetic membranes in Rhodobacter sphaeroides: the
role of PufX. EMBO J 23, 690–700.
3 Cogdell RJ, Southall J, Gardiner AT, Law CJ, Gall A,
Roszak AW & Isaacs NW (2006) How purple photo-
synthetic bacteria harvest solar energy. C R Chim 9,
201–206.
4 McDermott G, Prince SM, Freer AA, Hawthornthwa-
ite-Lawless AM, Papiz MZ, Cogdell RJ & Isaacs NW
(1995) Crystal structure of an integral membrane light-
harvesting complex from photosynthetic bacteria.
Nature 374, 517–521.
5 Koepke J, Hu XC, Muenke C, Schulten K & Michel H
(1996) The crystal structure of the light-harvesting com-
plex II (B800–850) from Rhodospirillum molischianum.
Structure 4, 581–597.
6 Roszak AW, Howard TD, Southall J, Gardiner AT,
Law CJ, Isaacs NW & Cogdell RJ (2003) Crystal struc-
ture of the RC–LH1 core complex from Rhodopseudo-
monas palustris. Science 302, 1969–1972.
7 Wang ZY, Gokan K, Kobayashi M & Nozawa T
(2005) Solution structures of the core light-harvesting a
and b polypeptides from Rhodospirillum rubrum: impli-
cations for the pigment–protein and protein–protein
interactions. J Mol Biol 347, 465–477.
8 Madigan MT (1984) A novel photosynthetic purple bac-
terium isolated from a Yellowstone hot spring. Science
225, 313–315.
9 Watson AJ, Hughes AV, Fyfe PK, Wakeham MC, Hol-
den-Dye K, Heathcote P & Jones MR (2005) On the
role of basic residues in adapting the reaction center–
LH1 complex for growth at elevated temperatures in
purple bacteria. Photosynth Res 86, 81–100.
10 Fathir I, Ashikaga M, Tanaka K, Katano T, Nirasawa
T, Kobayashi M, Wang ZY & Nozawa T (1998) Bio-
chemical and spectral characterization of the core light
harvesting complex 1 (LH1) from the thermophilic pur-
ple sulfur bacterium Chromatium tepidum. Photosynth
Res 58, 193–202.
11 Kimura Y, Hirano Y, Yu LJ, Suzuki H, Kobayashi M
& Wang ZY (2008) Calcium ions are involved in the
unusual red-shift of the light-harvesting 1 Q
y
transition
of the core complex in thermophilic purple sulfur
bacterium Thermochromatium tepidum. J Biol Chem
283, 13867–13873.
12 Wang ZY, Shimonaga M, Suzuki H, Kobayashi M &
Nozawa T (2003) Purification and characterization of
the polypeptides of core light-harvesting complexes
from purple sulfur bacteria. Photosynth Res 78, 133–
141.
13 Suzuki H, Hirano Y, Kimura Y, Takaichi S, Kobayashi
M, Miki K & Wang ZY (2007) Purification, character-
ization and crystallization of the core complex from
thermophilic purple sulfur bacterium Thermochroma-
tium tepidum. Biochim Biophys Acta 1767, 1057–1063.
14 Ma F, Kimura Y, Zhao XH, Wu YS, Wang P, Fu LM,
Wang ZY & Zhang JP (2008) Excitation dynamics of
two spectral forms of the core complexes from
photosynthetic bacterium Thermochromatium tepidum.
Biophys J 95, 3349–3357.
15 Krebs J & Micnalak M (2007) Calcium: A Matter of
Life or Death. Elsevier Press, Amsterdam.
16 Kretsinger RH (1972) Gene triplication deduced from
the tertiary structure of a muscle calcium binding pro-
tein. Nat New Biol 240, 85–88.
17 Toyoshima C & Nomura H (2002) Structural changes
in the calcium pump accompanying the dissociation of
calcium. Nature 418, 605–611.
18 Toyoshima C, Nomura H & Sugita Y (2003) Structural
basis of ion pumping by Ca
2+
-ATPase of sarcoplasmic
reticulum. FEBS Lett 555, 106–110.
19 Wu HM, Ra
¨
tsep M, Jankowiak R, Cogdell RJ &
Small GJ (1998) Hole-burning and absorption studies
of the LH1 antenna complex of purple bacteria: effect
of pressure and temperature. J Phys Chem B 102,
4023–4034.
20 Kimura Y, Yu LJ, Hirano Y, Suzuki H & Wang ZY
(2009) Calcium ions are required for the enhanced ther-
mal stability of the light-harvesting-reaction center core
complex from thermophilic purple sulfur bacterium
Thermochromatium tepidum. J Biol Chem 284, 93–99.
21 Kuki M, Naruse M, Kakuno T & Koyama Y (1995)
Resonance Raman evidence for 15-cis to all-trans
photoisomerization of spirilloxanthin bound to a
reduced form of the reaction center of Rhodospirillum
rubrum S1. Photochem Photobiol 62, 502–508.
22 Qian P, Saiki K, Mizoguchi T, Hara K, Sashima T,
Fujii R & Koyama Y (2001) Time-dependent changes
in the carotenoid composition and preferential binding
of spirilloxanthin to the reaction center and anhydro-
rhodovibrin to the LH1 antenna complex in Rhodobium
marinum. Photochem Photobiol 74, 444–452.
23 Papagiannakis E, Das SK, Gall A, van Stokkum IHM,
Robert B, van Grondelle R, Frank HA & Kennis JTM
(2003) Light harvesting by carotenoids incorporated
into the B850 light-harvesting complex from Rhodo-
bacter sphaeroides R-26.1: excited-state relaxation,
Ca
2+
-binding motif in an LH1 complex F. Ma et al.
1748 FEBS Journal 276 (2009) 1739–1749 ª 2009 The Authors Journal compilation ª 2009 FEBS
ultrafast triplet formation, and energy transfer to bacte-
riochlorophyll. J Phys Chem B 107, 5642–5649.
24 Frolov D, Gall A, Lutz M & Robert B (2002) Struc-
tural asymmetry of bacterial reaction centers: a
Q
y
resonant Raman study of the monomer bacterio-
chlorophylls. J Phys Chem A 106, 3605–3613.
25 Na
¨
veke A, Lapouge K, Sturgis JN, Hartwich G, Simo-
nin I, Scheer H & Robert B (1997) Resonance Raman
spectroscopy of metal-substituted bacteriochlorophylls:
characterization of Raman bands sensitive to bacterio-
chlorin conformation. J Raman Spectrosc 28, 599–604.
26 Lapouge K, Na
¨
veke A, Gall A, Ivancich A, Seguin J,
Scheer H, Sturgis JN, Mattioli TA & Robert B (1999)
Conformation of bacteriochlorophyll molecules in pho-
tosynthetic proteins from purple bacteria. Biochemistry
38, 11115–11121.
27 Sturgis JN & Robert B (1997) Pigment binding-site and
electronic properties in light-harvesting proteins of pur-
ple bacteria. J Phys Chem B 101 , 7227–7231.
28 Fiedor L (2006) Hexacoordination of bacteriochloro-
phyll in photosynthetic antenna LH1. Biochemistry 45,
1910–1918.
29 Zucchelli G, Brogioli D, Casazza AP, Garlaschi FM &
Jennings RC (2007) Chlorophyll ring deformation
modulates Q
y
electronic energy in chlorophyll–protein
complexes and generates spectral forms. Biophys J 93,
2240–2254.
30 Tuschak C, Beatty JT & Overmann J (2004) Photo-
synthesis genes and LH1 proteins of Roseospirillum
parvum 930I, a purple non-sulfur bacterium with
unusual spectral properties. Photosynth Res 81, 181–
199.
31 Peitsch MC (1995) Protein modeling by E-mail. Nat
Biotechnol 13, 658–660.
32 Guex N & Peitsch MC (1997) SWISS-MODEL and
the Swiss-Pdb viewer: an environment for com-
parative protein modeling. Electrophoresis 18,
2714–2723.
33 Schwede T, Kopp J, Guex N & Peitsch MC (2003)
SWISS-MODEL: an automated protein homology-mod-
eling server. Nucleic Acids Res 31, 3381–3385.
34 Martı
´
-Renom MA, Stuart AC, Fiser A, Sa
´
nchez R,
Melo F & Sali A (2000) Comparative protein structure
modeling of genes and genomes. Annu Rev Biophys Bio-
mol Struct 29, 291–325.
35 Sali A & Blundell TL (1993) Comparative protein mod-
eling by satisfaction of spatial restraints. J Mol Biol
234, 779–815.
F. Ma et al. Ca
2+
-binding motif in an LH1 complex
FEBS Journal 276 (2009) 1739–1749 ª 2009 The Authors Journal compilation ª 2009 FEBS 1749