Báo cáo khoa học: Receptor- and calcium-dependent induced inositol 1,4,5-trisphosphate increases in PC12h cells as shown by fluorescence resonance energy transfer imaging pot
Bạn đang xem bản rút gọn của tài liệu. Xem và tải ngay bản đầy đủ của tài liệu tại đây (564.1 KB, 11 trang )
Receptor- and calcium-dependent induced inositol
1,4,5-trisphosphate increases in PC12h cells as shown by
fluorescence resonance energy transfer imaging
Mitsuhiro Morita
1,2
, Fumito Yoshiki
1
, Akira Nakane
1
, Yoshiumi Okubo
1
and Yoshihisa Kudo
1
1 Laboratory of Cellular Neurobiology, School of Life Science, Tokyo University of Pharmacy and Life Science, Japan
2 Department of Neurosurgery, University of New Mexico, Albuquerque, NM, USA
Phosphatidylinositol hydrolysis and subsequent
increases in intracellular calcium, activated by G-pro-
tein-coupled receptors or receptor tyrosine kinases, are
important regulators of various cellular functions [1,2].
The initial step in receptor-mediated phosphatidylinosi-
tol (PtdIns) metabolism involves the activation of
phospholipase C (PLC), which in turn hydrolyzes
PtdIns. When the substrate is phosphatidylinositol
Keywords
calcium; fluorescent resonance energy
transfer; inositol 1,4,5-trisphosphate;
muscarinic acetylcholine receptor;
phospholipase C
Correspondence
M. Morita, Laboratory of Cellular
Neurobiology, School of Life Science, Tokyo
University of Pharmacy and Life Science,
1432-1, Horinouchi, Hachioji, 192-0392,
Tokyo, Japan
Fax: +81 426 76 8841
Tel: +81 426 76 8963
E-mail:
(Received 15 May 2007, revised 4 August
2007, accepted 8 August 2007)
doi:10.1111/j.1742-4658.2007.06035.x
The production and further metabolism of inositol 1,4,5-trisphosphate
[Ins(1,4,5)P
3
] require several calcium-dependent enzymes, but little is
known about subsequent calcium-dependent changes in cellular
Ins(1,4,5)P
3
. To study the calcium dependence of muscarinic acetylcholine
receptor-induced Ins(1,4,5)P
3
increases in PC12h cells, we utilized an
Ins(1,4,5)P
3
imaging system based on fluorescence resonance energy trans-
fer and using green fluorescent protein variants fused with the pleckstrin
homology domain of phospholipase C-d1. The intracellular calcium con-
centration, monitored by calcium imaging, was adjusted by thapsigargin
pretreatment or alterations in extracellular calcium concentration, enabling
rapid receptor-independent changes in calcium concentration via store-
operated calcium influx. We found that Ins(1,4,5)P
3
production was
increased by a combination of receptor- and calcium-dependent compo-
nents, rather than by calcium alone. The level of Ins(1,4,5)P
3
induced by
the receptor was found to be half that induced by the combined receptor
and calcium components. Increases in calcium levels prior to receptor acti-
vation did not affect the subsequent receptor-induced Ins(1,4,5)P
3
increase,
indicating that calcium does not influence Ins(1,4,5)P
3
production without
receptor activation. Removal of both the receptor agonists and calcium
rapidly restored calcium and Ins(1,4,5)P
3
levels, whereas removal of cal-
cium alone restored calcium to its basal concentration. Similar calcium-
dependent increases in Ins(1,4,5)P
3
were also observed in Chinese hamster
ovary cells expressing m1 muscarinic acetylcholine receptor, indicating that
the observed calcium dependence is common to Ins(1,4,5)P
3
production.
To our knowledge, our results are the first showing receptor- and calcium-
dependent components within cellular Ins(1,4,5)P
3
.
Abbreviations
BSS, basal salt saline; CCh, carbachol; CFP, cyan fluoresent protein; CHO, Chinese hamster ovary cells; FRET, fluorescent resonance
energy transfer; GFP, green fluorescent protein; Ins(1,4,5)P
3
, inositol 1,4,5-trisphosphate; mAChR, muscarinic acetylcholine receptor;
MDCK cells, Madin–Darby canine kidney cells; PHD, pleckstrin homology domain; PtdIns, phosphatidylinositol; PtdIns(4,5)P
2
,
phosphatidylinositol 4,5-bisphosphate; PLC, phospholipase C; SOC, store-operated calcium entry; Tg, thapsigargin; YFP, yellow fluoresent
protein.
FEBS Journal 274 (2007) 5147–5157 ª 2007 The Authors Journal compilation ª 2007 FEBS 5147
4,5-bisphosphate [PtdIns(4,5)P
2
], one of the hydrolysis
products, inositol 1,4,5-trisphosphate [Ins(1,4,5)P
3
],
can induce the release of calcium from intracellular
calcium stores via the Ins(1,4,5)P
3
receptor, a mecha-
nism referred to as Ins(1,4,5)P
3
-induced calcium
release [3]. The pattern of calcium increase via
Ins(1,4,5)P
3
-induced calcium release has been shown to
be diverse, namely transient, sustained and oscillatory
[4]. In some cases, the intracellular Ins(1,4,5)P
3
concen-
tration oscillates simultaneously with the calcium con-
centration [2,5]. Some PLCs contain calcium-binding
domains [6], and other Ins(1,4,5)P
3
-metabolizing
enzymes, including inositol polyphosphate 3-kinases
and inositol polyphosphate 5-phosphatases, are regu-
lated by calcium [7]. Together, these findings suggest a
complicated mutual regulation between Ins(1,4,5)P
3
metabolism and Ins(1,4,5)P
3
-induced calcium release,
which is thought to contribute to the overall fine-
tuning of cellular functions.
Biochemical assays of PtdIns metabolism, using
radiolabeled compounds with restricted spatial and
temporal resolution, differ from cellular responses
under physiological conditions, because radiolabeling
usually requires lithium to enhance the accumulation
of PtdIns metabolism products [8]. Alternatively,
imaging assays, using green fluorescent protein (GFP)
variants fused with either the C1 domain of protein
kinase C or the pleckstrin homology domain (PHD)
of PLCd can assess PtdIns metabolism at a temporal
resolution similar to that of calcium imaging [5].
These fusion proteins bind to the products of PtdIns
metabolism and change their intracellular localization.
Recently, a fluorescence resonance energy transfer
(FRET)-based assay of the redistribution of PHD
fusion proteins from plasma membrane to cytosol
was found to be a more reliable and quantitative
method for measuring increases in cellular
Ins(1,4,5)P
3
[9]. PHD binds to PtdIns(4,5)P
2
, and
more preferentially to Ins(1,4,5)P
3
, at a 20-fold higher
affinity [5]. In addition, the PHD fusion proteins of
the cyan and yellow variants of GFP (cyan fluoresent
protein CFP–PHD and yellow fluoresent protein
YFP–PHD) bound to PtdIns(4,5)P
2
before stimula-
tion, and were localized close to the plasma mem-
brane. As the hydrolysis of PtdIns proceeds, the
subsequently formed PtdIns(4,5)P
2
is converted to
Ins(1,4,5)P
3
, and the fusion proteins essentially lose
their ability to interact with each other, becoming
redistributed throughout the cytosol while bound to
Ins(1,4,5)P
3
. This loss of interaction between the
fusion proteins is reflected in the change in their
respective fluorescent intensities, as monitored by
FRET.
In this study, we used FRET-based Ins(1,4,5)P
3
imaging to monitor the response of the rat pheo-
chromocytoma cell line (PC12h) towards muscarinic
acetylcholine receptor (mAChR) activation. Using this
system, we quantitatively assessed the interaction
between intracellular calcium and Ins(1,4,5)P
3
metabo-
lism. Furthermore, we compared these results with
those obtained from Chinese hamster ovary (CHO)
cells expressing m1 mAChR to determine the variation
between the two cell types.
Results
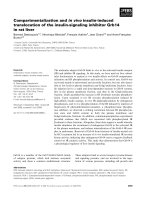
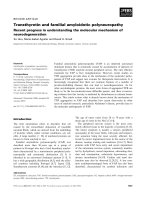
FRET-based imaging of Ins(1,4,5)P
3
metabolism
in PC12h cells
PHD proteins fused with the cyan and yellow variants
of GFP (CFP–PHD and YFP–PHD, respectively) were
coexpressed in PC12h cells, and their interaction was
analyzed by measuring changes in fluorescence inten-
sity. Increases in cellular calcium and Ins(1,4,5)P
3
were
induced using carbachol (CCh; 100 lm), which specifi-
cally activates mAChR and induces Ins(1,4,5)P
3
pro-
duction in PC12 cells, even at 500 lm[10]. Following
CCh stimulation, the fluorescence intensity of the
FRET donor (CFP–PHD) increased, whereas the
intensity of the corresponding acceptor (YFP–PHD)
decreased, as expected from dissociation of the
exchanging partners, causing a subsequent decrease in
the overall YFP ⁄ CFP ratio (Fig. 1). After complete
removal of CCh, fluorescence intensities returned to
their original values over several minutes.
Fig. 1. Ins(1,4,5)P
3
FRET-based imaging applied to PC12h cells in
response to mAChR activation. (A) Representative response of
PC12h cells expressing CFP–PHD and YFP–PHD to CCh (100 l
M,
1 min, bar). The fluorescence ratio (EYFP ⁄ ECFP) (red line) was cal-
culated from the corresponding fluorescence changes in CFP (cyan
line) and YFP (yellow line), which are shown in normalized form
(F ⁄ F
o
).
Calcium-dependent Ins(1,4,5)P
3
metabolism in PC12h cells M. Morita et al.
5148 FEBS Journal 274 (2007) 5147–5157 ª 2007 The Authors Journal compilation ª 2007 FEBS
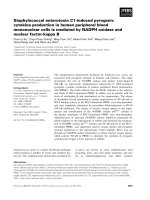
Calcium dependence of Ins(1,4,5)P
3
metabolism
in PC12h cells
To determine whether Ins(1,4,5)P
3
metabolism in
PC12h cells responding to mAChR activation is depen-
dent on calcium, we stimulated cells in normal (2 mm
Ca
2+
)orCa
2+
-free extracellular solution [Ca
2+
-free
basal salt saline (BSS)]. In the presence of 2 mm extra-
cellular calcium, mAChR activation induced both a
transient and a sustained increase in intracellular
calcium, as measured by Fura 2 ⁄ AM-based calcium
imaging, together with a sustained increase in
Ins(1,4,5)P
3
, which peaked later than calcium
(Fig. 2Aa). By contrast, when Ca
2+
-free BSS was
used, only a transient calcium increase was observed,
and the level of Ins(1,4,5)P
3
production was reduced
(Fig. 2Ab). This initial transient calcium increase was
insensitive to extracellular calcium, a finding similar to
that of other cells exposed to a variety of agonists [11].
These findings indicate that transient calcium increases
result from the release of Ca
2+
from intracellular
stores, whereas subsequent sustained calcium increases
reflect calcium entry, including the so-called store-
operated calcium (SOC), which is activated by deple-
tion of the calcium store. Because use of Ca
2+
-free
BSS effectively prevented any sustained calcium
increase, as well as reducing the production of
Ins(1,4,5)P
3
to 63.2 ± 15.8% (mean ± SEM, n ¼ 7,
P < 0.01, t-test) of the peak amplitude in normal
medium, a significant proportion of the Ins(1,4,5)P
3
increase can be regarded as dependent on intracellular
calcium.
The calcium dependence of this increase in
Ins(1,4,5)P
3
was further examined using other stimula-
tory conditions. To prevent intracellular calcium
increases triggered by CCh while still maintaining nor-
mal extracellular calcium, cells were loaded with the
calcium chelator BAPTA-AM (10 lm, 30 min). We
found that CCh did not trigger any detectable increase
in calcium, as measured with Fura 2 ⁄ AM, a high-affin-
ity indicator, but an increase in Ins(1,4,5)P
3
was
observed, albeit at a reduced level, 68.4 ± 13.2%
(n ¼ 4, P < 0.05, t-test) of the peak amplitude
observed in the absence of treatment (Fig. 2Ba).
Although depolarization with 30 mm KCl induced a
receptor-independent increase in calcium, it did not
induce an increase in Ins(1,4,5)P
3
(Fig. 2Bb). Pretreat-
ment with the sarco-endoplasmic calcium ATPase
inhibitor, thapsigargin (Tg), which depletes calcium
stores and induces SOC, and variations in extracellular
calcium concentration induced a similar increase in cal-
cium via SOC, but had no effect on Ins(1,4,5)P
3
pro-
duction. By contrast, mAChR activation after the
calcium increase induced an increase in Ins(1,4,5) P
3
(Fig. 2Bc), but less than that observed in the absence
of treatment (65.2 ± 18.8%; n ¼ 5, P < 0.05, t-test),
even in the presence of both receptor activation and
calcium increase (Fig. 2Bc). These findings suggest
that calcium becomes less effective in enhancing
Ins(1,4,5)P
3
production if its level is increased prior to
receptor stimulation. Although the effect of calcium
increases prior to receptor stimulation was not studied
further, it is likely that the same effect may account
for the finding that the total Ins(1,4,5)P
3
increase
induced by receptor activation and calcium entry was
slightly larger in the absence than in the presence of
preceding calcium treatment (Fig. 3). Basal calcium
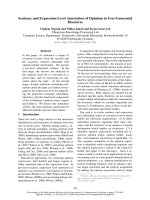
Fig. 2. Calcium dependence of cellular calcium and Ins(1,4,5)P
3
lev-
els in PC12h cells. Cellular calcium (upper traces) and Ins(1,4,5)P
3
(lower traces) were measured in PC12h cells containing Fura 2 ⁄ AM
or expressing CFP–PHD and YFP–PHD, respectively. (A) Effects of
extracellular calcium on responses induced by CCh (100 l
M, bars).
Responses are shown as mean ± SEM. (a) Normal BSS (2 m
M
Ca
2+
; n ¼ 7); (b) Ca
2+
-free BSS (Ca
2+
-free; n ¼ 7). (B) Effects of
cellular calcium on Ins(1,4,5)P
3
levels. Representative changes of
(a) a cell pretreated with BAPTA-AM (10 l
M, 30 min) and exposed
to CCh (100 l
M, bar); (b) a cell depolarized with KCl (30 mM, bar);
and (c) a cell responding to SOC entries and mAChR activation. In
(c), the cells were pretreated with Tg (1 l
M, 5 min) in Ca
2+
-free
BSS prior to imaging, SOC entries were induced after substitution
of Ca
2+
-free BSS (white bar) with normal BSS (bold bar), and stimu-
lation with CCh (100 l
M, bar). Scale bars: horizontal (30 s); vertical
(0.1) for DRatio (340 ⁄ 380) and (0.1) for DRatio (YFP ⁄ CFP).
M. Morita et al. Calcium-dependent Ins(1,4,5)P
3
metabolism in PC12h cells
FEBS Journal 274 (2007) 5147–5157 ª 2007 The Authors Journal compilation ª 2007 FEBS 5149
and Ins(1,4,5)P
3
levels in all experiments in Fig. 2 were
within 11.2 and 28.5%, respectively, of their mean val-
ues in containing 2 mm calcium (Fig. 2Aa); these basal
levels were not altered significantly by pretreatment
with calcium-free medium, BAPTA-AM and Tg.
Fluctuations in the basal Ins(1,4,5)P
3
level were larger
than those of calcium, presumably because of fluctua-
tions in transfection efficiency of CFP–PHD and
YFP–PHD expression vectors. Taken together, these
results suggest that increased calcium alone is not suffi-
cient to increase Ins(1,4,5)P
3
in PC12 cells. Moreover,
the requirement for receptor activation suggests
that calcium has a modulatory effect on Ins(1,4,5)P
3
production once it has been induced by receptor
activation.
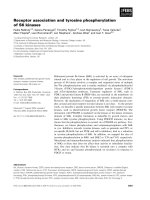
Calcium-dependent enhancement of receptor-
induced Ins(1,4,5)P
3
production in PC12h cells
To investigate the modulatory effect of calcium on
receptor-induced Ins(1,4,5)P
3
production, mAChRs
were activated with CCh in Ca
2+
-free BSS (Fig. 2Ab);
the extracellular solution was replaced with normal
BSS containing CCh, which induced a second calcium
increase and a further increase in Ins(1,4,5)P
3
(Fig. 3Aa). Both of these calcium increases were
accompanied by increased Ins(1,4,5)P
3
, indicating that
calcium can enhance receptor-induced Ins(1,4,5)P
3
increases. The peak Ins(1,4,5)P
3
increases were similar
for both mAChR-activated and reintroduced extracel-
lular calcium, indicating that calcium entry supple-
mented a reduction in Ins(1,4,5)P
3
production caused
by the restoration of intracellular calcium. To separate
the calcium-dependent component of Ins(1,4,5)P
3
induction, PC12h cells were pretreated with Tg in
Ca
2+
-free BSS (1 lm, 5 min) to prevent the possible
release of calcium, and were subjected to the same
stimulation protocol. We found that Tg pretreatment
successfully prevented the release of calcium induced
by mAChR activation, but did not inhibit the calcium
entry caused by re-addition of extracellular calcium
(Fig. 3Ab). The receptor-induced Ins(1,4,5)P
3
increase
was smaller in the absence of calcium release than in
its presence [compare initial Ins(1,4,5)P
3
peaks in
Fig. 3Aa,b]. The reintroduction of extracellular cal-
cium induced a larger Ins(1,4,5)P
3
increase when the
cells had been pretreated with Tg. Figure 3B summa-
rizes the Ins(1,4,5)P
3
increases induced by receptor
activation and the reintroduction of calcium, as well as
the effects of Tg on the components of these responses.
The peak amplitudes were calculated as the difference
between signals before and after mAChR activation
(Fig. 3B). For cells not pretreated with Tg, the recep-
tor-induced Ins(1,4,5)P
3
increase was 79.6 ± 7.4% of
that induced by reintroduced calcium, whereas for
the pretreated cells it was, 39.8 ± 3.0%, which was
significantly lower (P<0.01, t-test) than for untreated
cells. The total Ins(1,4,5)P
3
increase induced by the
Fig. 3. Effect of calcium release and calcium entry on cellular
Ins(1,4,5)P
3
levels in PC12h cells. (A) Representative changes in
cellular calcium (upper trace) and Ins(1,4,5)P
3
(lower trace) levels.
Cells were stimulated with CCh (100 l
M, bars) in Ca
2+
-free BSS
(white bars), which was replaced with normal BSS (bold bars).
Where indicated, cells were pretreated without (a) and with (b) Tg
(1 l
M, 5 min) in Ca
2+
-free BSS. Scale bars: horizontal (30 s); vertical
(0.1) for DRatio (340 ⁄ 380) and (0.1) for DRatio (YFP ⁄ CFP). (B) Effect
of Tg pretreatment on the total amplitude of Ins(1,4,5)P
3
increases
in response to mAChR activation, in the absence (white bars) and
presence (hatched bars) of extracellular calcium. Results were cal-
culated from the traces as indicated in (A), with (Tg, n ¼ 16) and
without (–, n ¼ 20) Tg pretreatment. Each bar represents the
mean ± SEM for the ratio of YFP ⁄ CFP, represented by differences
between the peak and basal values, prior to CCh stimulation (DR).
Calcium-dependent Ins(1,4,5)P
3
metabolism in PC12h cells M. Morita et al.
5150 FEBS Journal 274 (2007) 5147–5157 ª 2007 The Authors Journal compilation ª 2007 FEBS
reintroduction of calcium in Tg-pretreated cells was
slightly, but significantly, larger than that in untreated
cells (P<0.05, t-test), whereas the receptor-induced
portion of the Ins(1,4,5) P
3
increase was significantly
smaller in Tg-pretreated than in untreated cells
(P<0.01, t-test). These results strongly suggest that
calcium modulates the receptor-induced Ins(1,4,5)P
3
production in PC12h cells.
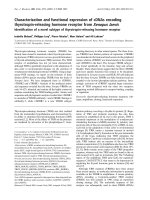
The calcium dependence of increased Ins(1,4,5)P
3
production was further investigated by more accurately
controlling the amount of intracellular calcium,
because we had found that the total amounts of cal-
cium differed for released calcium and calcium entry
(Fig. 4). When extracellular calcium was reintroduced
to Tg-pretreated PC12h cells, the calcium increase
was uniform and not affected by mAChR activation
(Fig. 4, also see Fig. 5). By contrast to our previous
results (Fig. 3Ab), in which cells were also treated with
Tg, receptor activation accompanied by calcium entry
enhanced Ins(1,4,5)P
3
production (Fig. 4A). Although
removal of extracellular calcium restored the intra-
cellular calcium concentration, the increase in
Ins(1,4,5)P
3
was sustained. In addition, the subsequent
increase in calcium was less effective at enhancing the
initial receptor-activated Ins(1,4,5)P
3
increase.
Although similar to our previous results (Fig. 3Aa),
these findings show more clearly that the presence
of calcium initially enhanced receptor-induced
Ins(1,4,5)P
3
. By contrast to the immediate restoration
of intracellular calcium, the removal of extracellular
calcium led to a gradual decrease in Ins(1,4,5)P
3
.
Because the rates of Ins(1,4,5)P
3
and calcium restora-
tion were similar following the termination of receptor
activation caused by the removal CCH, these findings
suggest that PC12h cells can clear Ins(1,4,5)P
3
and ⁄ or
re-synthesize PtdIns(4,5)P
2
as rapidly as they clear cal-
cium. This result could be observed with our imaging
system, which uses FRET to measure the rapid trans-
location of fluorescent proteins. Because our results
suggested that mAChR induces Ins(1,4,5)P
3
produc-
tion even after the removal of calcium entry, we com-
pared the averaged time-dependent restoration plots
for Ins(1,4,5)P
3
and calcium following removal of
extracellular calcium and removal of both calcium and
carbachol (Fig. 4Ba,b). Although the removal of cal-
cium after 1 min had little effect on the level of recep-
tor- and calcium-induced Ins(1,4,5)P
3
, the removal of
both calcium and CCh reduced the receptor- and
calcium-induced Ins(1,4,5)P
3
to 31%. By contrast, the
time-dependent restoration of intracellular calcium was
similar under both conditions.
The gradual loss of Ins(1,4,5)P
3
production may
have been due to the retention of calcium in some
Ins(1,4,5)P
3
metabolism-related process, which includes
calcium-dependent enzymes, even after intracellular
calcium restoration. To address this, we assayed the
Fig. 4. Calcium and Ins(1,4,5)P
3
restoration rates following the
removal of calcium entry or calcium entry and receptor activation.
(A) Representative changes in cellular calcium (upper trace) and
Ins(1,4,5)P
3
(lower trace) levels. Cells were pretreated with Tg
(1 l
M,5 min) in Ca
2+
-free BSS and stimulated with CCh (100 lM,
bar) in Ca
2+
-free BSS (white bars) or normal BSS (bold bars).
mAChR activation (1 min) in the presence of extracellular calcium
was followed by its removal (1 min) and reintroduction (1 min).
Scale bars: horizontal (30 s); vertical (0.05) for DRatio (340 ⁄ 380)
and (0.1) for DRatio(YFP ⁄ CFP). (B) Time-dependent restoration of
cellular calcium and Ins(1,4,5)P
3
levels following removal of calcium
or calcium and CCh. The average changes in Ins(1,4,5)P
3
(a, n ¼ 4)
and intracellular calcium (b, n ¼ 14) are expressed as mean ± SEM.
All traces were calculated from the response to the stimulatory
paradigm, as shown in (A). The black and red lines represent the
changes occurring after flushing the calcium and calcium ⁄ CCh
mixture, respectively. The flushing process was initiated at the
point indicated by the arrows. Bar ¼ 10 s.
M. Morita et al. Calcium-dependent Ins(1,4,5)P
3
metabolism in PC12h cells
FEBS Journal 274 (2007) 5147–5157 ª 2007 The Authors Journal compilation ª 2007 FEBS 5151
effects of increased calcium prior to receptor activation
by comparing the receptor- and calcium-induced
Ins(1,4,5)P
3
increases in Tg-pretreated cells in the pres-
ence (Fig. 5A) and absence (Fig. 5B) of preceding cal-
cium entry (1 min), which had been removed 1 min
prior to receptor activation. Because a similar level of
Ins(1,4,5)P
3
had been induced under both conditions,
the preceding calcium increase had no effect on either
receptor- or calcium-induced Ins(1,4,5)P
3
, suggesting
that the calcium-dependent process in Ins(1,4,5)P
3
metabolism is unable to retain calcium without recep-
tor activation. Therefore, in the absence of receptor
activation, Ins(1,4,5)P
3
metabolism is likely either
insensitive to calcium or incapable of retaining it. By
contrast, once the calcium-dependent process has been
activated by both receptor and calcium, the effects of
calcium are retained, even after the calcium is
removed.
Calcium-dependent enhancement of receptor-
induced Ins(1,4,5)P
3
increases in CHO cells
expressing m1 mAChR
PC12h cells express m1 mAChR and utilize it in the
CCh-induced increases in calcium and Ins(1,4,5)P
3
.To
investigate the cell-type dependence of Ins(1,4,5)P
3
production, we assayed receptor- and calcium-induced
Ins(1,4,5)P
3
increases in CHO cells that express
m1 mAChR (CHO-m1 cells), using the same stimula-
tory conditions as described above (Fig. 3). Because
original CHO cells, which do not express m1 mAChR,
lack both calcium and Ins(1,4,5)P
3
responses to CCh
[13], any responses observed were likely due to
mAChR. We found that mAChR activation, coupled
with the reintroduction of extracellular calcium,
induced both the release and entry of calcium, as well
as increasing Ins(1,4,5)P
3
levels (Fig. 6Aa). Further-
more, although Tg pretreatment effectively inhibited
the additional release of calcium, it had no effect on
calcium entry. Although the lack of calcium release
essentially reduced the degree of receptor-induced
Ins(1,4,5)P
3
, it enhanced Ins(1,4,5)P
3
induced by the
reintroduction of extracellular calcium (Fig. 6Ab). The
receptor-induced level of Ins(1,4,5)P
3
in cells not pre-
treated with Tg was 120 ± 12.8% of the Ins(1,4,5)P
3
level induced by the reintroduction of extracellular cal-
cium (Fig. 6B). By contrast, in cells pretreated with
Tg, the level of receptor-induced Ins(1,4,5)P
3
was
46.3 ± 4.1%, because Tg prevented any further release
of calcium. The Ins(1,4,5)P
3
increases induced by the
reintroduction of extracellular calcium were about the
same for cells pretreated with Tg (DR; 0.49 ± 0.06)
and those without (DR; 0.49 ± 0.05). These results
were similar to those obtained for PC12h cells, indicat-
ing that the Ins(1,4,5)P
3
metabolism of both cell types
(PC12h and CHO) exhibits similar calcium depen-
dence.
Discussion
We have shown that a FRET-based Ins(1,4,5)P
3
imag-
ing system can be used to monitor the level of
Ins(1,4,5)P
3
production in mAChR-activated PC12h
cells, with the main focus centered on the effects of
intracellular calcium changes. We found that removal of
extracellular calcium had no effect on mAChR-induced
calcium release, although it prevented subsequent
calcium entry, thus reducing the overall production of
Ins(1,4,5)P
3
. By contrast, calcium increases induced by
depolarization or SOC without mAChR activation did
not increase Ins(1,4,5)P
3
production, indicating that
Ins(1,4,5)P
3
increases are likely to be modulated, but
not activated, by calcium. The effect of calcium on
Ins(1,4,5)P
3
production was further investigated by
separately analyzing receptor- and calcium-induced
Ins(1,4,5)P
3
increases. The level of receptor-induced
Ins(1,4,5)P
3
was about half that induced by the combi-
nation of receptor and calcium, and was further
enhanced by the subsequent increase in intracellular
calcium levels. The increase in calcium levels just prior
Fig. 5. Effect of prior calcium levels on cellular Ins(1,4,5)P
3
produc-
tion in PC12h cells. Representative changes in cellular calcium
(upper trace) and Ins(1,4,5)P
3
(lower trace) levels. In all experi-
ments, cells were pretreated with Tg (1 l
M,5 min) in Ca
2+
-free BSS
and stimulated with CCh (100 l
M, bars) in Ca
2+
-free BSS (white
bars) and later in normal BSS (bold bar). (A) mAChR activation
(1 min) in the absence of extracellular calcium followed by its
re-introduction (1 min); (B) addition (1 min) and removal (1 min) of
extracellular calcium, followed by mAChR activation (1 min) in the
absence of extracellular calcium and its reintroduction (1 min).
Scale bars: horizontal (30 s); vertical (0.05) for DRatio(340 ⁄ 380) and
(0.1) for DRatio(YFP ⁄ CFP).
Calcium-dependent Ins(1,4,5)P
3
metabolism in PC12h cells M. Morita et al.
5152 FEBS Journal 274 (2007) 5147–5157 ª 2007 The Authors Journal compilation ª 2007 FEBS
to receptor activation did not affect subsequent recep-
tor- and calcium-induced Ins(1,4,5)P
3
, suggesting that
calcium has no effect on Ins(1,4,5)P
3
production in the
absence of mAChR preactivation. Although removal of
receptor agonists and calcium from the medium pro-
moted the rapid recovery of both calcium and
Ins(1,4,5)P
3
levels, the removal of calcium alone led to
the recovery of calcium, but had little or no effect on
Ins(1,4,5)P
3
production. These findings were confirmed
by assaying the receptor- and calcium-induced effects
on Ins(1,4,5) P
3
production in CHO cells expressing
m1 mAChR.
Imaging of Ins(1,4,5)P
3
with fluorescently labeled
PHD fusion proteins relies on the cellular localization
of fluorescent fusion proteins by confocal microscopy
[5,14] and measurement of the interaction between the
fusion proteins using FRET, as shown here [9]. Both
methods depend on the redistribution of fusion
proteins from the plasma membrane to the cytosol. In
our earlier study on PC12h cells, in which we used
confocal microscopy, mAChR activation resulted in
the production of a redistribution peak, which was sig-
nificantly delayed relative to the increase in calcium
levels [15]. By contrast, when we used FRET, we
observed that calcium increase and Ins(1,4,5)P
3
pro-
duction occurred within a similar time frame. FRET is
considered the more accurate measure of time depen-
dence, because the interaction between fusion proteins
changes almost instantaneously following the disrup-
tion of PtdIns(4,5)P
2
binding. Therefore, the delay
observed in our previous study indicates that the
release of fusion proteins from the plasma membrane
and their migration to the cytosol requires several tens
of seconds. A similar, but shorter, delay has been
reported in CHO cells, suggesting that the diffusion
constant of the fusion proteins, or the spatial organiza-
tion between the plasma membranes and confocal
planes, varies among cell types.
We could not determine whether the redistribution
of fluorescently labeled PHD fusion proteins from the
plasma membrane to the cytosol results from an
increase in Ins(1,4,5)P
3
or a decrease in PtdIns(4,5)P
2
.
Because PHD from PLCd1 has a 20-fold greater affinity
for Ins(1,4,5)P
3
than for PtdIns(4,5)P
2
[5], however, the
fluorescently labeled PHD fusion proteins would likely
favor Ins(1,4,5)P
3
binding, thus moving from the
plasma membrane to the cytosol immediately following
an increase in Ins(1,4,5)P
3
. This has been observed in
Madin–Darby canine kidney (MDCK) cells, in which
Ins(1,4,5)P
3
injection caused the redistribution of
fusion proteins, regardless of calcium production [5].
Moreover, the introduction of inositol 5-phosphatase,
which hydrolyzes Ins(1,4,5)P
3
, inhibited any further
Fig. 6. Effect of calcium release and calcium entry on cellular
Ins(1,4,5)P
3
in CHO cells expressing an m1 receptor. (A) Represen-
tative changes in cellular calcium (upper trace) and Ins(1,4,5)P
3
(lower trace) levels. Cells were stimulated with CCh (100 lM, bars)
in Ca
2+
-free BSS (white bar), later replaced by normal BSS (bold
bar). Where indicated, cells were incubated in the absence (a) or
presence (b) of Tg pretreatment (1 l
M, 5 min) in Ca
2+
-free BSS.
Scale bars: horizontal (30 s); vertical (0.1) for DRatio (340 ⁄ 380) and
(0.1) for DRatio (YFP ⁄ CFP). (B) Effect of Tg pretreatment on the
total amplitude of Ins(1,4,5)P
3
response to mAChR activation, in
the absence (white bar) or presence (hatched bar) of extracellular
calcium. Values were calculated from the traces in (A) with (Tg,
n ¼ 14), and without (–, n ¼ 19) Tg pretreatment. Each bar repre-
sents the mean ± SEM for the ratio of YFP ⁄ CFP, using the differ-
ences between peak and basal values prior to CCh stimulation
(DR).
M. Morita et al. Calcium-dependent Ins(1,4,5)P
3
metabolism in PC12h cells
FEBS Journal 274 (2007) 5147–5157 ª 2007 The Authors Journal compilation ª 2007 FEBS 5153
redistribution of the fusion proteins [5]. By contrast,
others have failed to observe the Ins(1,4,5)P
3
-dependent
redistribution of fusion proteins [9]. For example, in
N1E-115 cells, weak photoactivation of caged
Ins(1,4,5)P
3
has been found to induce a total release of
calcium, although uncaged Ins(1,4,5)P
3
was not suffi-
cient to promote the redistribution of fusion pro-
teins [9]. In addition, using radiolabeled inositol in
adrenal glomerular cells, enhanced accumulation of
Ins(1,4,5)P
3
, but not the redistribution of fusion pro-
teins, was observed in the presence of an inosi-
tol 3-kinase inhibitor (Sr
3+
) [9]. A recent study, testing
the response of N1E-115 cells to bradykinin, suggested
that the redistribution of fusion protein is reflected by
the combination of increases and decreases in
Ins(1,4,5)P
3
and PtdIns(4,5)P
2
[16].
To address the CCh-induced FRET signal changes
in PC12h cells to increased Ins(1,4,5)P
3
or to
decreased PtdIns(4,5)P
2
, we tested the effects of inosi-
tol 5-phosphatase expression, which had been utilized
to attribute PHD fusion protein translocation to
Ins(1,4,5)P
3
increase in previous studies [5,17], on
CCh-induced calcium release and Ins(1,4,5)P
3
metabo-
lism. We found that this enzyme significantly, but
partially suppressed these responses (Fig. S1). The
partial inhibition of calcium release suggests that this
enzyme does not possess sufficient activity for com-
plete hydrolysis of the Ins(1,4,5)P
3
resulting from
CCh stimulation, and we therefore could not use this
enzyme to determine the process underlying the fluo-
rescence changes. These fluorescence changes, how-
ever, were completely abolished in 4 of 36 cells
expressing inositol 5-phosphatase, but in 0 of 15 cells
not expressing this enzyme, indicating that these fluo-
rescence changes were likely due to an increase in
Ins(1,4,5)P
3
production.
The effect of calcium on Ins(1,4,5)P
3
production has
been described in cell types other than PC12h, by
measuring the translocation of GFP and PHD fusion
protein. In cerebellar Purkinje cells, increased intracell-
ular calcium induced a more efficient increase in
Ins(1,4,5)P
3
than did the activation of the group I
metabotropic glutamate receptor [17]. In bovine adre-
nal glomerular cells, both intracellular calcium and
receptor induced an increase in Ins(1,4,5)P
3
[18]. In
both MDCK and CHO cells, the apparently synchro-
nized oscillation of intracellular calcium and
Ins(1,4,5)P
3
following receptor activation may be due
to the calcium dependence of Ins(1,4,5)P
3
production
[5,19]. That is, positive and negative calcium feedback
in Ins(1,4,5)P
3
metabolism may induce Ins(1,4,5)P
3
oscillation, which in turn promotes calcium oscillation.
By contrast, the PC12 cell line is believed to be incapa-
ble of generating an oscillatory calcium response.
Several of our results, however, are in apparent
disagreement with this oscillation hypothesis. For
example, we found similar calcium-dependent
Ins(1,4,5)P
3
increases in PC12h and CHO cells, and
calcium was retained in Ins(1,4,5)P
3
metabolism-
related enzymes even after the restoration of calcium
levels. In HEK293 cells, mAChR-induced calcium
oscillation was not accompanied by Ins(1,4,5)P
3
oscillation, suggesting that calcium oscillation may not
always require Ins(1,4,5)P
3
oscillation [20]. To
determine the physiological role of the calcium depen-
dence of Ins(1,4,5)P
3
metabolism, a more detailed
analysis of the effects of calcium and the cross-talk
between other signaling systems (e.g. protein kinase C)
is required.
Although calcium has been found to affect receptor
desensitization processes via G-protein receptor kinase
or PKC [21,22], it is less likely that calcium increases
Ins(1,4,5)P
3
metabolism by inhibiting receptor desen-
sitization, inasmuch as the reduction in Ins(1,4,5)P
3
metabolism by receptor desensitization during CCh
stimulation was almost negligible. It is therefore likely
that the effect of calcium on Ins(1,4,5)P
3
production
may be a reflection of the calcium dependence of
PLC. Other enzymes involved in Ins(1,4,5)P
3
meta-
bolism, such as inositol polyphosphate 3-kinase and
inositol polyphosphate 5-phosphatase, are calcium
dependent, but their activation by calcium is expected
to promote Ins(1,4,5)P
3
degradation, thus reducing
the amount of cellular Ins(1,4,5)P
3
. The calcium-
dependent activation of these enzymes may explain
the reduced cellular Ins(1,4,5)P
3
content in MDCK
cells observed at higher extracellular calcium concen-
trations [5]. Four PLC enzyme subtypes, designated
b, c, d and e, have been identified to date, with all,
except for e, possessing a calcium-binding domain
and requiring calcium for proper activation [6].
Although PC12 cells express PLCb,-c and -d[23],
there is little evidence of PLCe expression in this cell
line. PLCe is usually expressed in neurons [24], and
PC12 cells exhibit considerable neuronal character
[25], suggesting that PLCe can be expressed in PC12h
cells. Calcium-dependent PLC isozymes are inactive
in these cells at calcium concentrations below 100 nm,
but become active following physiological activation
[26]. Therefore, the calcium-independent component
of the mAChR-induced Ins(1,4,5)P
3
increase, which
was approximately half the total Ins(1,4,5)P
3
increase,
may reflect the activity of calcium-independent PLCe.
This PLC subtype is activated by mAChR via a small
G-protein Rho [27], with a similar mechanism
hypothesized in PC12h cells. The calcium-dependent
Calcium-dependent Ins(1,4,5)P
3
metabolism in PC12h cells M. Morita et al.
5154 FEBS Journal 274 (2007) 5147–5157 ª 2007 The Authors Journal compilation ª 2007 FEBS
activation of receptor-induced Ins(1,4,5)P
3
increases
we observed in PC12h cells is reflected in the corre-
sponding activation of calcium-dependent PLCs, par-
ticularly PLCb and -d, with PLCb activated by Gq in
a calcium-dependent manner [28] and purified PLCd
activated by calcium alone [26]. Thus, although PC12
cells express significant amounts of PLCd, an increase
in intracellular calcium in the absence of receptor
activation would induce Ins(1,4,5)P
3
production only
when PLCd is overexpressed [29]. The lack of activity
of endogenous PLCd in PC12 cells and other cell
types has yet to be established, but changes in cellu-
lar PtdIns(4,5)P
2
content may provide one possible
explanation. For example, the ratio of PtdIns to
PtdIns(4,5)P
2
(100 : 2.8) in NIE-115 cells has been
reported to decrease almost immediately (within 10 s)
after bradykinin stimulation [16]. Because the binding
of PHD to PtdIns(4,5)P
2
is essential for PLCd acti-
vation [26], the low PtdIns(4,5)P
2
content prior to
receptor activation may lead to inhibition of this
enzyme. Recently, a Gq-coupled calcium-sensing
receptor was shown to induce PtdIns(4,5)P
2
produc-
tion through the utilization of a small G-protein [30],
suggesting that this receptor activates Gq-dependent
PLCb and calcium-dependent PLCd via PtdIns(4,5)P
2
production. If mAChR-activation in PC12h cells fol-
lows a similar pathway, receptor-induced PtdIns(4,5)
P
2
may provide the PtdIns(4,5)P
2
necessary for the
calcium-dependent activation of PLCd.
The Ins(1,4,5)P
3
imaging method utilized here
reveals some interesting quantitative and time-depen-
dent properties of Ins(1,4,5)P
3
metabolism. Because
PtdIns metabolism is a fundamental mechanism that
controls several major cellular processes, with varying
dynamics, this method, coupled with the overexpres-
sion of enzymes involved in Ins(1,4,5)P
3
metabolism or
their suppression by RNA interference, may lead to a
greater understanding of the molecular mechanisms
involved in many cellular functions.
Experimental procedures
Recombinant DNA
The expression vectors for CFP–PHD and YFP–PHD were
constructed as described for the GFP fusion protein [15],
using an expression vector containing the SRa promoter
[31].
Cell culture and transfection
PC12h cells were seeded on 12-mm diameter polyethylene–
imine precoated cover slips (1 lgÆmL
)1
) in Dulbecco’s
modified Eagle’s medium-high (Asahi Technoglass, Funab-
ashi, Japan) containing 5% horse serum (Gibco BRL,
Gaithersburg, MD) and 5% semifetal bovine serum
(Mitsubishi Kagaku, Tokyo, Japan). The CFP–PHD and
YFP–PHD expression vectors were transfected using Trans-
Fast (Promega, Madison, WI). CHO cells expressing
m1 mAChR, the gift of T. Haga (Gakushuin University,
Tokyo, Japan), were seeded on 12-mm cover slips in Nutri-
ent Mixture (Ham) F-12 containing 10% fetal bovine serum
(Equitech-Bio, Ingram, TX), whereas the CFP–PHD and
YFP–PHD expression vectors were transfected using Lipo-
fectAMINE2000 (Gibco BRL). All cells were imaged for
48–72 h.
Imaging
Extracellular BSSs were used in all physiological experi-
ments (normal BSS; 130 mm NaCl, 5.4 mm KCl, 5.5 mm
glucose, 2 mm CaCl
2
,1mm MgCl
2
,20mm Hepes,
pH 7.4). Calcium-free extracellular solution (Ca
2+
-free
BSS) lacked CaCl
2
and contained 0.5 mm EGTA. To load
the calcium indicator, the cells were incubated for 45 min
at 30 °C in normal BSS containing Fura 2 ⁄ AM (7.5 lm;
Dojin-kagaku, Kumamoto, Japan), washed three times,
and incubated at room temperature for 20 min. For cal-
cium imaging, sulfinpyrazone (100 lm) was added to nor-
mal BSS at each step after repeated washing. Fluorescence
images in Figs 1–4 and 6 were obtained using an E600FN
upright microscope (Nikon, Tokyo, Japan) equipped with
a Polychrome IV, high-speed tunable scanning monochro-
matic light source (T.I.L.L. Photonics GmbH, Gra
¨
felfing,
Germany) and a C6790 CCD camera (Hamamatsu Pho-
tonics, Hamamatsu, Japan), while the images in Figs 5
and 6 were obtained using an IX70 inverted microscope,
fitted with an OSP-EXA filter exchanger (Olympus,
Tokyo, Japan) and a C6790 CCD camera. The image data
were analyzed using aquacosmos software (Hamamatsu
Photonics). For FRET imaging, the fluorescence was split
by a W-View dichroic mirror system (Hamamatsu Photon-
ics) equipped with a dichroic mirror (510LP) and the
barrier filters 480DF30 and 535DF25 for YFP–PHD
and CFP–PHD, respectively. Calcium and Ins(1,4,5)P
3
increases were expressed as changes in the ratio of fluores-
cence intensities (DR). For calcium imaging, the fluores-
cence ratio was calculated by dividing the fluorescence
intensity obtained at 510 nm after excitation at 340 nm by
the intensity at 510 nm after excitation at 380 nm. For
Ins(1,4,5)P
3
imaging, the fluorescence ratio was calculated
by dividing the fluorescence intensity of YFP–PHD
(535 nm) by the intensity of CFP–PHD (489 nm), both of
which were obtained by excitation at 430 nm. The fluores-
cence ratio of the FRET response is larger in Figs 3–6
than Figs 1–2, because of the different neutral density fil-
ter configuration for excitation, and each of YFP–PHD
and CFP–PHD.
M. Morita et al. Calcium-dependent Ins(1,4,5)P
3
metabolism in PC12h cells
FEBS Journal 274 (2007) 5147–5157 ª 2007 The Authors Journal compilation ª 2007 FEBS 5155
Materials
CCh was purchased from Wako Chemicals (Tokyo, Japan).
All other chemicals were purchased from Sigma (St Louis,
MO).
Acknowledgements
This work was supported by Grant-in-Aid 10214204 for
Scientific Research on Priority Areas (B) on ‘Regulation
of Neural Transduction by Glial Cells’, Grant-in-Aid
15082101 for Scientific Research on Priority Areas on
‘Elucidation of Glia–Neuron Network-Mediated Infor-
mation Processing Systems’ and Grant-in-Aid 14780582
for Young Scientists on ‘Application of an Insect
Receptor to the Investigation of Neuronal Networks’
all from the Ministry of Education, Science and Culture
in Japan. We thank Ms Hiromi Yanaka and Ms Keiko
Suzuki for their excellent secretarial assistance. We also
thank Dr John A. Conner of the University of New
Mexico for scientific criticism of the manuscript.
References
1 Berridge MJ, Lipp P & Bootman MD (2000) The versa-
tility and universality of calcium signalling. Nat Rev
Mol Cell Biol 1, 11–21.
2 Carafoli E (2002) Calcium signaling: a tale for all sea-
sons. Proc Natl Acad Sci USA 99, 1115–1122.
3 Irvine RF & Schell MJ (2001) Back in the water: the
return of the inositol phosphates. Nat Rev Mol Cell Biol
2, 327–338.
4 Fewtrell C (1993) Ca
2+
oscillations in non-excitable
cells. Annu Rev Physiol 55, 427–454.
5 Hirose K, Kadowaki S, Tanabe M, Takeshima H &
Iino M (1999) Spatiotemporal dynamics of inositol
1,4,5-trisphosphate that underlies complex Ca
2+
mobili-
zation patterns. Science 284, 1527–1530.
6 Rhee SG (2001) Regulation of phosphoinositide-specific
phospholipase C. Annu Rev Biochem 70, 281–312.
7 Woodring PJ & Garrison JC (1997) Expression, purifi-
cation, and regulation of two isoforms of the inositol
1,4,5-trisphosphate 3-kinase. J Biol Chem 272, 30447–
30454.
8 Berridge MJ, Downes CP & Hanley MR (1982) Lithium
amplifies agonist-dependent phosphatidylinositol
responses in brain and salivary glands. Biochem J 206,
587–595.
9 van der Wal J, Habets R, Varnai P, Balla T & Jalink K
(2001) Monitoring agonist-induced phospholipase C
activation in live cells by fluorescence resonance energy
transfer. J Biol Chem 276, 15337–15344.
10 Vicentini LM, Ambrosini A, Di Virgilio F, Pozzan T &
Meldolesi J (1985) Muscarinic receptor-induced phos-
phoinositide hydrolysis at resting cytosolic Ca
2+
con-
centration in PC12 cells. J Cell Biol 100, 1330–1333.
11 Bennett DL, Bootman MD, Berridge MJ & Cheek TR
(1998) Ca
2+
entry into PC12 cells initiated by ryanodine
receptors or inositol 1,4,5-trisphosphate receptors.
Biochem J 329, 349–357.
12 Ebihara T & Saffen D (1997) Muscarinic acetylcholine
receptor-mediated induction of zif268 mRNA in PC12D
cells requires protein kinase C and the influx of extracel-
lular calcium. J Neurochem 68, 1001–1010.
13 Burford NT, Tobin AB & Nahorski SR (1995) Differen-
tial coupling of m1, m2 and m3 muscarinic receptor
subtypes to inositol 1,4,5-trisphosphate and adenosine
3¢,5¢-cyclic monophosphate accumulation in Chinese
hamster ovary cells. J Pharmacol Exp Ther 274, 134–142.
14 Varnai P & Balla T (1998) Visualization of phospho-
inositides that bind pleckstrin homology domains:
calcium- and agonist-induced dynamic changes and rela-
tionship to myo-[
3
H]inositol-labeled phosphoinositide
pools. J Cell Biol 143, 501–510.
15 Morita M, Yoshiki F & Kudo Y (2003) Simultaneous
imaging of phosphatidyl inositol metabolism and
Ca(2+) levels in PC12h cells. Biochem Biophys Res
Commun 308, 673–678.
16 Xu C, Watras J & Loew LM (2003) Kinetic analysis of
receptor-activated phosphoinositide turnover. J Cell Biol
161, 779–791.
17 Okubo Y, Kakizawa S, Hirose K & Iino M (2001)
Visualization of IP(3) dynamics reveals a novel AMPA
receptor-triggered IP(3) production pathway mediated
by voltage-dependent Ca(2+) influx in Purkinje cells.
Neuron 32, 113–122.
18 Balla T, Nakanishi S & Catt KJ (1994) Cation sensitiv-
ity of inositol 1,4,5-trisphosphate production and
metabolism in agonist-stimulated adrenal glomerulosa
cells. J Biol Chem 269, 16101–16107.
19 Young KW, Nash MS, Challiss RA & Nahorski SR
(2003) Role of Ca
2+
feedback on single cell inositol
1,4,5-trisphosphate oscillations mediated by G-protein-
coupled receptors. J Biol Chem 278, 20753–20760.
20 Sinnecker D & Schaefer M (2004) Real-time analysis of
phospholipase C activity during different patterns of
receptor-induced Ca
2+
responses in HEK293 cells. Cell
Calcium 35, 29–38.
21 Haga K, Kameyama K, Haga T, Kikkawa U, Shiozaki
K & Uchiyama H (1996) Phosphorylation of human m1
muscarinic acetylcholine receptors by G protein-coupled
receptor kinase 2 and protein kinase C. J Biol Chem
271, 2776–2782.
22 Pitcher JA, Freedman NJ & Lefkowitz RJ (1998) G
protein-coupled receptor kinases. Annu Rev Biochem 67,
653–692.
23 Mazzoni M, Bertagnolo V, Neri LM, Carini C,
Marchisio M, Milani D, Manzoli FA & Capitani S
Calcium-dependent Ins(1,4,5)P
3
metabolism in PC12h cells M. Morita et al.
5156 FEBS Journal 274 (2007) 5147–5157 ª 2007 The Authors Journal compilation ª 2007 FEBS
(1992) Discrete subcellular localization of phosphoinosi-
tidase C beta, gamma and delta in PC12 rat pheochro-
mocytoma cells. Biochem Biophys Res Commun 187,
114–120.
24 Wu D, Tadano M, Edamatsu H, Masago-Toda M,
Yamawaki-Kataoka Y, Terashima T, Mizoguchi A,
Minami Y, Satoh T & Kataoka T (2003) Neuronal line-
age-specific induction of phospholipase Cepsilon expres-
sion in the developing mouse brain. Eur J Neurosci 17,
1571–1580.
25 Pollock JD, Krempin M & Rudy B (1990) Differential
effects of NGF, FGF, EGF, cAMP, and dexamethasone
on neurite outgrowth and sodium channel expression in
PC12 cells. J Neurosci 10, 2626–2637.
26 Allen V, Swigart P, Cheung R, Cockcroft S & Katan M
(1997) Regulation of inositol lipid-specific phospholipase
Cdelta by changes in Ca
2+
ion concentrations. Biochem
J 327, 545–552.
27 Evellin S, Nolte J, Tysack K, vom Dorp F, Thiel M,
Weernink PA, Jakobs KH, Webb EJ, Lomasney JW &
Schmidt M (2002) Stimulation of phospholipase C-epsi-
lon by the M3 muscarinic acetylcholine receptor medi-
ated by cyclic AMP and the GTPase Rap2B. J Biol
Chem 277, 16805–16813.
28 Park D, Jhon DY, Kriz R, Knopf J & Rhee SG (1992)
Cloning, sequencing, expression, and Gq-independent
activation of phospholipase C-beta 2. J Biol Chem 267,
16048–16055.
29 Kim YH, Park TJ, Lee YH, Baek KJ, Suh PG, Ryu SH
& Kim KT (1999) Phospholipase C-delta1 is activated
by capacitative calcium entry that follows phospholipase
C-beta activation upon bradykinin stimulation. J Biol
Chem 274, 26127–26134.
30 Huang C, Handlogten ME & Miller RT (2002) Parallel
activation of phosphatidylinositol 4-kinase and phos-
pholipase C by the extracellular calcium-sensing recep-
tor. J Biol Chem 277, 20293–20300.
31 Takebe Y, Seiki M, Fujisawa J, Hoy P, Yokota K,
Arai K, Yoshida M & Arai N (1988) SR alpha
promoter: an efficient and versatile mammalian cDNA
expression system composed of the simian virus 40 early
promoter and the R-U5 segment of human T-cell leuke-
mia virus type 1 long terminal repeat. Mol Cell Biol 8,
466–472.
Supplementary material
The following supplementary material is available
online:
Fig. S1. Effect of INPP5A expression on the levels
of calcium and Ins(1,4,5)P
3
in PC12h cells following
mAChR activation.
This material is available as part of the online article
from
Please note: Blackwell Publishing is not responsible
for the content or functionality of any supplementary
materials supplied by the authors. Any queries (other
than missing material) should be directed to the corre-
sponding author for the article.
M. Morita et al. Calcium-dependent Ins(1,4,5)P
3
metabolism in PC12h cells
FEBS Journal 274 (2007) 5147–5157 ª 2007 The Authors Journal compilation ª 2007 FEBS 5157