Báo cáo khoa học: Purification and functional characterization of human 11b hydroxylase expressed in Escherichia coli doc
Bạn đang xem bản rút gọn của tài liệu. Xem và tải ngay bản đầy đủ của tài liệu tại đây (415.24 KB, 12 trang )
Purification and functional characterization of human
11b hydroxylase expressed in Escherichia coli
Andy Zo
¨
llner
1
, Norio Kagawa
1,2
, Michael R. Waterman
2
, Yasuki Nonaka
3
, Koji Takio
4
,
Yoshitsugu Shiro
4
, Frank Hannemann
1
and Rita Bernhardt
1
1 Department of Biochemistry, Saarland University, Saarbru
¨
cken, Germany
2 Department of Biochemistry, Vanderbilt University School of Medicine, Nashville, TN, USA
3 College of Nutrition, Koshien University, Takarazuka, Hyogo, Japan
4 Biometal Science Laboratory, Riken Spring-8 Center, Harima Institute, Hyogo, Japan
The final steps in the synthesis of the major human
glucocorticoid, cortisol, and the most important miner-
alocorticoid in humans, aldosterone [1], are catalyzed
by 95% identical mitochondrial cytochrome P450 iso-
zymes, 11b-hydroxylase (CYP11B1; EC 1.14.15.4) and
CYP11B2 [2]. Cortisol is synthesized from 11-deoxy-
cortisol through a hydroxylation reaction at position
11b catalyzed by CYP11B1, whereas aldosterone is
synthesized from 11-deoxycorticosterone via a series of
reactions catalyzed by CYP11B2.
CYP11B1 is expressed in the adrenal zona fasiculata
and is regulated by adrenocorticotrophic hormone
(ACTH). The human aldosterone synthase, CYP11B2,
on the other hand, is expressed in the zona glomerulosa
Keywords
Biacore measurements; congenital adrenal
hyperplasia; expression; human CYP11B1;
stopped-flow experiments
Correspondence
R. Bernhardt, Department of Biochemistry,
Saarland University, 66123 Saarbru
¨
cken.
Germany
Fax: +49 681 302 4739
Tel: +49 681 302 3005
E-mail:
Website: />HP1.html
(Received 24 August 2007, revised 3
December 2007, accepted 18 December
2007)
doi:10.1111/j.1742-4658.2008.06253.x
The human 11b-hydroxylase (hCYP11B1) is responsible for the conversion
of 11-deoxycortisol into the major mammalian glucocorticoid, cortisol. The
reduction equivalents needed for this reaction are provided via a short elec-
tron transfer chain consisting of a [2Fe-2S] ferredoxin and a FAD-contain-
ing reductase. On the biochemical and biophysical level, little is known
about hCYP11B1 because it is very unstable for analyses performed
in vitro. This instability is also the reason why it has not been possible to
stably express it so far in Escherichia coli and subsequently purify it. In the
present study, we report on the successful and reproducible purification of
recombinant hCYP11B1 coexpressed with molecular chaperones GroES ⁄
GroEL in E. coli. The protein was highly purified to apparent homogene-
ity, as observed by SDS ⁄ PAGE. Upon mass spectrometry, the mass-to-
charge ratio (m ⁄ z) of the protein was estimated to be 55 761, which is
consistent with the value 55 760.76 calculated for the form lacking the
translational initiator Met. The functionality of hCYP11B1 was analyzed
using different methods (substrate conversion assays, stopped-flow, Bia-
core). The results clearly demonstrate that the enzyme is capable of
hydroxylating its substrates at position 11-beta. Moreover, the determined
NADPH coupling percentage for the hCYP11B1 catalyzed reactions using
either 11-deoxycortisol or 11-deoxycorticosterone as substrates was approx-
imately 75% in both cases. Biacore and stopped-flow measurements indi-
cate that hCYP11B1 possesses more than one binding site for its redox
partner adrenodoxin, possibly resulting in the formation of more than one
productive complexes. In addition, we performed CD measurements to
obtain information about the structure of hCYP11B1.
Abbreviations
ACTH, adrenocorticotrophic hormone; AdR, adrenodoxin reductase; Adx, adrenodoxin; bCYP11B1, bovine 11b hydroxylase; hCYP11B1,
human 11b hydroxylase.
FEBS Journal 275 (2008) 799–810 ª 2008 The Authors Journal compilation ª 2008 FEBS 799
and is regulated by angiotensin II and potassium, with
ACTH having mostly a short-term effect on expression
[3,4]. Interestingly, in bovine CYP11B1 (bCYP11B1),
which is the most widely studied CYP11B1 so far due
to its availability, both functions of the human
CYP11B isoforms (cortisol and aldosterone formation)
are performed by a single protein.
CYP11B1 deficiency results in decreased cortisol-
production leading subsequently to an elevated plasma
ACTH level, and an accumulation of steroid precur-
sors. Such an enzyme deficiency is known to be the
cause in 5–8% [5,6] of patients suffering from congeni-
tal adrenal hyperplasia, an autosomal recessive inher-
ited inborn error in steroidogenesis that ranks among
the most frequent inborn errors of metabolism.
CYP11B1 deficiency leads to flooding of the androgen
synthesis pathway by accumulation of steroid precur-
sors, resulting in hyperandrogenism. In approximately
two thirds of patients, hypertension can be diagnosed
because of the accumulation of 11-deoxycorticosterone
and its metabolites. Overproduction of androgens such
as in classic CYP11B1 deficiency leads, for example, to
severe virilization of external genitalia in newborn
females as well as to bone age acceleration in both
sexes [2,6,7].
On the other hand, hCYP11B1 can also be a target
of drug action in the case of hydrocortisolism, which
plays an important role in the metabolic syndrome. So
far, the development of selective and specific inhibitors
was only possible using recombinant yeast or V79 cells
for inhibition studies [8].
The reduction equivalents needed for all
CYP11B1 ⁄ B2 catalyzed reactions are provided via a
short electron transfer chain consisting of a [2Fe-2S]
ferredoxin, adrenodoxin (Adx) and a NADPH-depen-
dent, FAD containing reductase, adrenodoxin reduc-
tase (AdR; EC 1.18.1.2) [8,9]. This electron transfer
chain is also responsible for providing electrons for the
conversion of cholesterol to pregnenolone, the precur-
sor molecule of all steroid hormones, which is pro-
duced in a reaction catalyzed by CYP11A1 [10,11].
So far, little is known about the interaction between
hCYP11B1 and its redox partner Adx. This is mainly
due not only to the scarce availability of human adre-
nals, but also to the instability of this protein, which
has hindered its expression in Escherichia coli and its
subsequent purification. Therefore, most of the studies
performed to date have been carried out using bovine
CYP11B1 in a detergent solubilized system or in lipo-
somes [12,13]. However, the instability of the solubi-
lized enzyme, mainly due to its hydrophobic nature,
has hindered any detailed investigation [13]. Moreover,
purification of the homologous bovine protein from
adrenal glands is known to be difficult, time consum-
ing and renders only small quantities of the purified
protein (4–8 mg from 1.25 g of mitochondrial pellets
[14]). In the present study, we describe the successful
expression of human CYP11B1 in E. coli as well as its
subsequent purification in significant quantities. Addi-
tionally, we were able to functionally characterize this
enzyme by using bovine Adx and AdR as electron
donors. Taking this into account, this study opens new
perspectives for the investigation of the structure and
functions of this physiologically important protein.
Results and Discussion
Previously, rat CYP11B1 and CYP11B2 was expressed
in E. coli JM109 using a bacterial expression vector
pTrc99A [15]. However, the expression level of the
proteins was 10–20 nmolÆL
)1
culture media, which is
too low to obtain quantities of the purified proteins
for in depth characterization.
As it was very efficacious for the expression of
human CYP19 [16], mouse CYP27B1 [17] and bovine
CYP21 [18], the coexpression of molecular chaperones
GroES ⁄ GroEL also resulted in an efficient expression
of human CYP11B1. Utilizing the pET⁄ BL21 expres-
sion system with the coexpression of molecular chaper-
ones GroES ⁄ GroEL, the human CYP11B1 has been
expressed in E. coli with a yield of approxi-
mately 400 nmolÆ L
)1
culture. In addition to greatly
increasing the expression level, our expression system
using pET ⁄ BL21 shortened the incubation time to
approximately 24 h compared to 45 h for the
pTrc99A ⁄ JM109 system used for the expression of rat
CYP11B1 and CYP11B2 [15].
The expressed form of hCYP11B1 was stable in the
presence of detergents and glycerol and highly purified
through three chromatographic steps to the specific
content of 19.8 nmolÆmg
)1
, as estimated from the
reduced CO-difference spectrum and protein assay (the
theoretical value 17.8 nmolÆmg
)1
). The purified protein
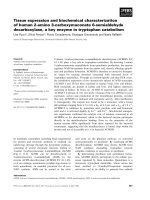
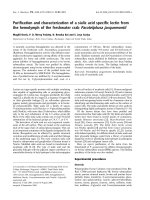
was apparently homogeneous upon SDS ⁄ PAGE
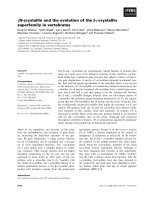
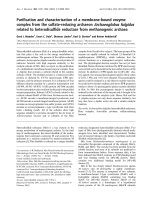
(Fig. 1) and showed a single major peak on HPLC
analysis using a POROS column (Fig. 2A). The peak
was collected and subjected to MALDI-TOF analysis.
Signals of singly (m ⁄ z = 55761) and doubly
(m ⁄ z = 27898) charged apoprotein were observed
(Fig. 2B). The m ⁄ z value is in good agreement with the
calculated molecular mass of 55760.76 for the transla-
tional initiator Met-deleted hCYP11B1.
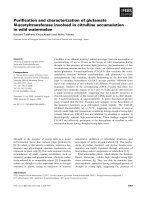
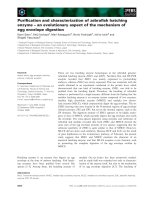
As shown in Fig. 3, the UV ⁄ visible spectrum of
purified recombinant CYP11B1 revealed a pronounced
Soret peak at 392 nm in the absence of substrates
(Fig. 3, spectrum 1), indicating that the protein is in its
Functional characterization of hCYP11B1 A. Zo
¨
llner et al.
800 FEBS Journal 275 (2008) 799–810 ª 2008 The Authors Journal compilation ª 2008 FEBS
high spin state. The spectrum was not changed by the
addition of 17,21-hydroxyprogesterone (spectrum 2),
although the P450 was reduced by sodium dithionite
(spectrum 3) and formed the reduced CO complex
(spectrum 4) that produced a typical P450 peak of
reduced CO-difference spectrum at 448 nm (Fig. 3,
lower panel). The finding that the recombinant protein
is in its five coordinated high spin state [9,19] is of
importance because it has been postulated that the
high spin state of cytochrome P450s is more stable
compared to its low spin state probably due to slight
conformational differences of the active site.
Additional spectroscopic measurements have been
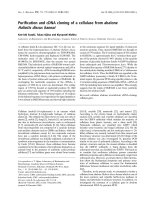
performed using CD spectropolarimetry. The CD
spectrum of 11B1 in the far-UV region (Fig. 4A)
describes a mainly alpha helical conformation, as
expected for a cytochrome P450 enzyme because all
P450 structures solved to date are predominantly alpha
helical. The spectrum of CYP11B1 is characterized in
this region by a negative dichroic double band with
minima at 210 and 221 nm, which do not change after
substrate supplementation (data not shown). The heli-
cal content of the protein at 20 °C was determined to
be greater than 50% according to the contin and
selcon prediction programs [20,21]. In the near-UV
and visible region, the CD spectra of CYP11B1 display
two large signals of negative sign (Fig. 4B), one with a
minimum below 280 nm and a second with a minimum
near the position of the Soret maximum (386 nm) in
the absorption spectrum. The negative cotton effect in
the Soret region has been observed in other cyto-
chromes P450 and can be attributed to a solvent-acces-
sible heme pocket. In addition, two signals of positive
sign appeared at 290 and 326 nm. The 260–280 nm
region reflects mainly tyrosine transitions, whereas the
signal at 326 can be attributed to an anisotropy of
the porphyrin absorption band [22]. Upon addition
of substrate, the signal of the positive CD band
at 290 nm and the negative band at 386 nm decreased
(Fig. 4B). A similar observation was described for sub-
strate binding of cytochrome P450RR1 from Rhodo-
coccus rhodochrous [23].
The functionality of the enzyme was demonstrated
by performing hCYP11B1-dependent substrate conver-
sion assays using 11-deoxycorticosterone and 11-de-
oxycortisol as substrate and by a subsequent HPLC
analysis of the steroid product pattern (Fig. 5). The
hCYP11B1 electron transfer chain was always reconsti-
tuted using bovine AdR and bovine Adx, which is
Purified human CYP11B1
24
µg
8
Fig. 1. SDS polyacrylamide gel electrophoresis of the purified
CYP11B1. Different amounts of the purified hCYP11B1 (2, 4, 8 lg
per lane) were separated by SDS ⁄ PAGE (10%) and visualized by
Coomassie staining.
A
0 5 10 15 20 25 20 40
27898
55761
60 80 100
Time (min) m/z (×10
3
)
B
Fig. 2. HPLC and mass spectral analysis of the purified hCYP11B1. (A) The purified hCYP11B1 was applied on RP-HPLC analysis using
POROS R1 ⁄ 10 (2.1 · 100 mm; Applied Biosystems) as described in Experimental procedures. The protein absorbance was monitored at
215 nm. (B) The apoprotein peak (15.5 min peak in Fig. 2A) was collected and subjected to MALDI-TOF MS with sinapic acid as matrix.
A. Zo
¨
llner et al. Functional characterization of hCYP11B1
FEBS Journal 275 (2008) 799–810 ª 2008 The Authors Journal compilation ª 2008 FEBS 801
capable of interacting with hCYP11B1 possessing a
90% amino acid sequence identity with human Adx.
As shown in Fig. 6, the recombinant enzyme was
able to efficiently convert 11-deoxycortisol to cortisol
with a k
cat
of 1.67 s
)1
and a K
m
of 338.4 ± 30.2 lm
for 11-deoxycortisol. Human CYP11B1 is also able
to convert 11-deoxycorticosterone to corticosterone
(k
cat
= 0.85 s
)1
and K
m
= 179.5 ± 19.1 lm 11-deoxy-
corticosterone).
The fact that the binding affinity of hCYP11B1 to
11-deoxycorticosterone is significantly higher compared
to the affinity for its natural substrate, 11-deoxycorti-
sol, might be caused by the additional hydroxyl group
at position C17 of 11-deoxycortisol. This additional
OH group is likely to hinder the entrance of the
slightly more hydrophilic and bulky substrate 11-de-
oxycortisol into the active site of the enzyme.
Compared with the published values for the forma-
tion of corticosterone by the bovine enzyme,
bCYP11B1 (k
cat
= 0.1 s
)1
), the obtained values using
hCYP11B1 are approximately ten-fold higher. This
finding is quite surprising because the sequence identity
between the human enzyme and the bovine enzyme is
high (73%). However, some of the main differences
between human and bovine CYP11B1 are located in
0.15
0.10
0.05
AbsorbanceΔAbsorbance
1
2
3
4
1: Free
2: 17,21-OH-Prog
3: Reduced
4: Reduced-CO
0.00
0.15
0.10
0.05
0.00
-0.05
350 400 450 500
4-3
550 600 650 700
350 400 450 500 550
Wavelength (nm)
600 650 700
Fig. 3. UV ⁄ visible spectra of the purified human CYP11B1. The
absolute spectra of the purified CYP11B1 (0.15 l
M) was analyzed
without substrate (1), with 0.1 m
M of 17,21-hydroxy-progester-
one (2), as a reduced form with 17,21-hydroxy-progesterone in the
presence of sodium dithionite (3), and as a reduced CO complex
with 17,21-hydroxy-progesterone (4). The reduced CO-different
spectrum (4-3) in the presence of 17,21-hydroxy-progesterone is
shown in the lower panel.
B
A
Fig. 4. CD spectra of CYP11B1. The CD spectrum recorded in
the far-UV of CYP11B1 is shown in the absence of substrate
at 20 °C (A). The protein concentration was 5 l
M in 10 mM potas-
sium phosphate buffer, pH 7.4. CD spectra in the near ultraviolet
and visible light were recorded in the absence (black) and in the
presence of substrate 11-deoxycortisol (gray) at 20 °C (B). The con-
centration of CYP11B1 was 10 l
M in 10 mM potassium phosphate
buffer, pH 7.4. Substrate was added to a concentration of 20 l
M.
Functional characterization of hCYP11B1 A. Zo
¨
llner et al.
802 FEBS Journal 275 (2008) 799–810 ª 2008 The Authors Journal compilation ª 2008 FEBS
substrate recognition sites 2 and 3 (SRS2 and SRS3),
which are mainly composed of the F and G helix of
the cytochrome [24]. This inconsistency might be the
cause for the significantly different interspecies conver-
sion rates. However, the alterations may also be
explained by the broader substrate-binding spectrum
of bCYP11B1 resulting from the combination of the
functions of CYP11B1 and CYP11B2 within one
enzyme.
Comparison of the k
cat
values obtained for the con-
version of 11-deoxycorticosterone by hCYP11B1 with
values published for corticosterone formation by rec-
ombinantly expressed and purified CYP11B1 from rats
(2.18 s
)1
) indicated that the maximal rate determined
for hCYP11B1 has not been significantly altered
(approximately 2.5-fold lower).
The k
cat
values obtained for hCYP11B1 catalyzed
reactions are in the range of values previously reported
for CYP106A2 catalyzed steroid hydroxylations and
significantly faster than the k
cat
value determined for
the formation of pregnenolone from cholesterol cata-
lyzed by CYP11A1, which is the rate limiting step in
steroidogenesis.
Additional studies performed to correlate the
NADPH consumption during the reaction with the
amount of product formed (i.e. the coupling percent-
age) revealed a 72% coupling when using 11-deoxy-
corticosterone as substrate and a 76% coupling when
using 11-deoxycorticosterone as substrate, respectively.
These findings indicate that, during the reaction
of hCYP11B1 with either 11-deoxycorticosterone or
11-deoxycortisol, approximately 25% of the consumed
NADPH is spent in other reactions (e.g. hydrogen
BA
Fig. 5. Typical steroid product pattern
recorded at 440 nm after HPLC separation
with an isocratic solvent system consisting
of acetonitrile ⁄ water (60 : 40) at a flow rate
of 1 mLÆmin
)1
on a C18 reversed phase col-
umn. Substrate conversions of CYP11B1
were performed with increasing amounts
of Adx (gray, dark gray, black lines).
(A) Conversions of the substrate 11-deoxy-
corticosterone (DOC) to the products B (cor-
ticosterone) and 18OH-B using cortisol (F)
as internal standard. (B) shows the conver-
sion of the substrate 11-deoxycortisol (RSS)
to F using 11-deoxycorticosterone as inter-
nal standard.
A
B
k
k
m
m
Fig. 6. hCYB11B1 substrate conversion assays were performed
using the reconstituted electron transfer chain consisting of bovine
Adx and bovine AdR as well as different substrate concentrations:
11-deoxycortisol (A) and 11-deoxycorticosterone (B). Steroid separa-
tion was achieved via HPLC analysis as indicated in Experimental
procedures. V
max
values (nmol productÆmin
)1
Ænmol
)1
hCYP11B1)
were subsequently converted into k
cat
values (s
)1
).
A. Zo
¨
llner et al. Functional characterization of hCYP11B1
FEBS Journal 275 (2008) 799–810 ª 2008 The Authors Journal compilation ª 2008 FEBS 803
peroxide formation). Besides the formation of hydro-
gen peroxide, other NADPH consuming reactions
probably involving the redox partners AdR and Adx
are taking place. Further studies will focus on investi-
gating this interesting question.
Experiments performed to determine the Adx depen-
dency of the hCYP11B1 catalyzed reaction were car-
ried out under substrate saturation conditions. The
k
cat
values obtained in these experimental set ups were
in the range of the values shown above using different
substrate concentrations (Table 1). The Adx-dependent
K
m
values obtained from these studies using 11-deoxy-
corticosterone or 11-deoxycortisol as substrate did not
reveal any significant differences, indicating that the
interaction between Adx and hCYP11B1 is not
affected by the different substrates (Table 1). In addi-
tion to this, the obtained Adx-dependent K
m
value
using 11-deoxycorticosterone as substrate was in the
range of values determined in previous studies for the
interaction between bovine Adx and bCYP11B1.
Biacore measurements were performed to investigate
the binding behavior between bovine Adx
ox
and
hCYP11B1
ox
or bCYP11B1
ox
in more detail. Among
the binding models available in the standard software
(e.g. 1 : 1 binding or complexes with higher stoichio-
metry), the best fit was always observed with the
‘bivalent analyte’ model. This suggested that CYP11B1
possesses more than one binding site for Adx. Taking
possible steric hindrances on the chip surface into
account, only the formation of the first predominant
1 : 1 complex has been considered (Table 2), as was
the case in a previous study [25]. As seen in Table 2,
the K
D
values obtained for the predominant 1 : 1 com-
plexes for both CYP11B1 species were in the nm range.
Surprisingly, the k
on
rate of the bCYP11B1 ⁄ Adx com-
plex was two-fold slower compared with the on-rate
for the hCYP11B1 ⁄ Adx complex. On the other hand,
the off rate was five-fold faster for the hCYP11-
B1 ⁄ Adx, indicating a slightly weaker stability com-
pared to the physiological interaction.
To characterize the electron transfer from Adx to
hCYP11B1, we performed stopped flow experiments.
The recorded reaction traces displayed three phases
that could be fitted separately (Fig. 7). This might indi-
cate that there are three different Adx binding sites on
hCYP11B1 or that complex rearrangements leading to
different reduction rates take place during the reaction.
The k
obs
values determined for the first phase were
always in the range of 60 s
)1
, indicating a fast process.
However, the amplitude of this phase was only
approximately 15–20% of the overall reaction ampli-
tude, indicating that this productive complex might be
thermodynamically less favored. Due to the velocity
and the small amplitude change, it was not possible to
determine the Adx dependency of this first process.
Both the second phase and the third phase displayed
an Adx dependency of the k
obs
rate, which could be
evaluated using the Michaelis–Menten equation
(Fig. 7). Combined with the data obtained from Bia-
core experiments, which indicated the possibility of
more than one complex formation, and considering
that no impurities could be detected in polyacrylamid
gel electrophoresis using our hCYP11B1 preparation,
it is unlikely that the observed phases are a result of a
heterogenous sample composition. Since it is known
that the Adx concentration plays a role in the regula-
tion of the activity of CYP11A1 [26], CYP11B1 [27]
and CYP11B2 [28], this finding is not surprising. The
maximal velocities extracted from the plots shown in
Fig. 7B,C for the second and third phase were 3.89 s
)1
and 0.65 s
)1
, respectively. The K
D
values obtained
from these experiments for the interaction between the
relevant redox states of Adx and hCYP11B1 were
0.78 lm for the second phase and 2.2 lm for the third
phase. Since the K
D
value obtained from the optical
Table 1. Kinetic parameters obtained for the conversion of 11-deoxycorticosterone or 11-deoxycortisol using different Adx concentrations
under substrate saturation (left). Kinetic parameters obtained using different substrate concentrations are also shown (right).
Substrate
Adx-dependent Substrate-dependent
K
m
(lM) k
cat
(s
)1
) K
m
(lM) k
cat
(s
)1
)
11-Deoxycorticosterone 2.0 ± 0.21 1 ± 0.06 180 ± 19 0.85 ± 0.07
11-Deoxycortisol 2.4 ± 0.5 1.48 ± 0.08 338 ± 30 1.67 ± 0.14
Table 2. Values obtained for the complex formation between
bovine Adx and CYP11B1 from different species using a Biacore
3000 system. Values were determined using a bivalent mechanism.
The values shown below characterize the formation of the predomi-
nant 1 : 1 complex. The 2 : 1 complex was not considered (see
Results and Discussion).
Complex k
on
(s
)1
ÆM
)1
) k
off
(s
)1
) K
D
(M · 10
)6
)
bAdx- ⁄ hCYP11B1 775 000 0.1089 0.141
bAdx ⁄ bCYP11B1 300 000 0.019 0.063
Functional characterization of hCYP11B1 A. Zo
¨
llner et al.
804 FEBS Journal 275 (2008) 799–810 ª 2008 The Authors Journal compilation ª 2008 FEBS
biosensor measurements and the value obtained for the
productive complex leading to the second reaction
phase are in the same range, it can be assumed that
this complex is the predominant complex seen with the
Biacore device. Moreover, analysis of the amplitude
change of these phases extracted from the stopped-flow
experiments indicates that the second complex is fur-
ther stabilized in the presence of increasing amounts of
Adx, whereas the complex leading to the third reaction
phase is favored in the presence of small amounts of
Adx (Fig. 7). These findings suggest different thermo-
dynamic attributes for the productive complexes.
Nevertheless, it cannot be ruled out that the differ-
ent reaction phases observed in these experiments are
caused by complex rearrangements or conformational
gating that might be necessary before an efficient elec-
tron transfer can take place. More investigations
including Adx and CYP11B1 mutants will be necessary
to investigate this question in more detail. However,
considering the current data, it is very likely that a
productive interaction (complex formation) between
Adx and CYP11B1 can take place through more than
one productive complex, as previously postulated for
the interaction between bovine CYP11B1 and Adx
[29].
Moreover, comparison of the k
cat
values obtained
from the substrate conversion experiments with the
maximal observed reduction rates from the stopped-
AB
CD
Fig. 7. Stopped flow analysis of the Adx-dependent hCYP11B1-CO complex formation. The transient reaction traces obtained for this inter-
action displayed three different phases that could be evaluated by using mono- or biexponential fits. (A) k
obs
values for the first fast phase
using different Adx concentrations were obtained after evaluation using a monoexponential function as shown in the insert. (B) k
obs
values
obtained for the second phase plotted against the corresponding Adx concentration. k
obs,max
and K
m
values were determined by using a
hyperbolic equation as shown in the plot. The insert shows the curve trajectory excluding the first phase, which was best described by a bi-
exponential fit. (C) Plot showing the Adx dependency of the kobs values obtained for the third reaction phase along with the deter-
mined k
obs,max
and K
m
values (D) Adx concentration-dependent amplitude change of the different reaction phases expressed as a percent.
A. Zo
¨
llner et al. Functional characterization of hCYP11B1
FEBS Journal 275 (2008) 799–810 ª 2008 The Authors Journal compilation ª 2008 FEBS 805
flow experiments indicates that only the first fast phase
can enable such high turnover rates. Additionally, it
appears that the second and the third phase seen in
the stopped-flow measurements are negligible during
the hydroxylation reaction, although possessing a
higher amplitude change in the stopped-flow measure-
ments compared to phase 1. Otherwise, the k
cat
values
from the substrate conversion assays were likely to be
in the range of the k
obs,max
values obtained for these
phases. However, more investigations are necessary to
clarify this assumption. In this context, it is possible
that the predominant, but slower phases observed in
the stopped-flow experiments play a role in the regula-
tion of the activity of CYP11B1, especially since the
absolute amplitude change of these phases when using
higher Adx concentrations increases and an involve-
ment of the Adx concentration in the regulation of
CYP11B1 has been demonstrated previously [27]. Nev-
ertheless, the physiological relevance of these different
phases and the postulated different complexes remains
unclear and should be subject of further studies.
In summary, the present study reports on the suc-
cessful purification of functional hCYP11B1 expressed
in E. coli. This will open new possibilities for analyzing
this very important cytochrome P450 in vitro, including
the detailed investigation of the interaction of
hCYP11B1 with its redox partner, Adx. As indicated
by stopped-flow and optical biosensor experiments, it
is very likely that the reaction between hCYP11B1 and
Adx can proceed through more than one productive
complex.
In addition, the purification protocol provided here
will facilitate the examination of mutations in
hCYP11B1 that lead to congenital adrenal hyperplasia,
indicating the medical relevance of the present study.
To date, the examination of such hCYP11B1 mutants
has been only possible through cell culture experi-
ments, which do not provide detailed information on
the influence of such mutations on the protein struc-
ture or on its redox behavior. Finally, the expression
and purification of hCYP11B1 is a necessary prerequi-
site for its future structural characterization.
Experimental procedures
Protein expression and purification
The human CYP11B1 was expressed as a mature form
with N- and C-terminal modifications. The cDNA fragment
encoding the modified CYP11B1 was produced by PCR
using the 5¢-primer (CGCCATATGGCTACTAAAGCTG
CTCGTGTTCCACGTACAGTGCTGCCA) and 3¢-primer
(GCGAAGCTTAATGATGATGATGATGATGGTTGAT
GGCTCTGAAGGTGAGGAG) and inserted into the
NdeI ⁄ HindIII-digested pET17b expression vector. The
cDNA template was as described previously [30]. The DNA
sequence was determined by automated sequencing. This
5¢-primer was designed to alter the N-terminus from
the original GTRAAR– – – to MATKAAR– – –. The
3¢-primer was designed to add six histidine residues at the
C-terminus to facilitate the purification. The CYP11B1
expression plasmid was introduced into E. coli strain
BL21(DE3)pLys along with a GroES ⁄ GroEL expression
vector pGro12 [31].
The human CYP11B1 was expressed and extracted from
E. coli in a similar manner to the methods previously
described for the expression of CYP19 and CYP21 [18].
The extracts (100 mL) from 1 L culture were applied on a
Ni-NTA agarose (10 mL bed volume) column equilibrated
with buffer A (50 mm potassium phosphate, pH 7.4,
500 mm sodium acetate, 20% glycerol, 0.1 mm EDTA,
0.1 mm dithiothreitol, 1% sodium cholate, 1% Tween 20,
0.1 mm phenylmethanesulfonyl fluoride), washed with
75 mL of buffer A plus 40 mm imidazole, and with
20 mL of buffer B (50 mm potassium phosphate, pH 7.4,
20% glycerol, 0.1 EDTA, 0.1 mm dithiothreitol,
40 mm imidazole, 1% sodium cholate, 1% Tween 20,
0.1 mm ATP and 0.1 mm phenylmethanesulfonyl fluoride).
Proteins were eluted with buffer C (200 mm imidazole
acetate, pH 7.4, 20% glycerol, 0.1 mm EDTA, 0.1 mm di-
thiothreitol, 1% sodium cholate, 1% Tween 20). The red-
colored fractions were combined and diluted with five
volumes of buffer D (20% glycerol, 0.1 mm EDTA,
0.1 mm dithiothreitol, 1% sodium cholate, pH 7.4) and
applied on a DEAE-Sepharose (30 · 50 mm) equilibrated
with buffer E (20 mm potassium phosphate, pH 7.4,
20% glycerol, 0.1 mm EDTA, 0.1 m m dithiothreitol,
10 mm imidazole, 1% sodium cholate, 0.1% Tween 20).
The column was washed with 40 mL of buffer E. Pass-
through fractions were then applied on a SP-Sepharose
column (30 · 40 mm) equilibrated with buffer F
(20 mm potassium phosphate, pH 7.4, 20% glycerol,
0.1 mm
EDTA, 0.1 mm dithiothreitol, 10 mm imidazole,
1% sodium cholate). The column was washed with
20 mL of buffer F, and eluted with 0–125 mm NaCl gradi-
ent in buffer G (40 mm potassium phosphate, pH 7.4,
20% glycerol, 0.1 mm EDTA, 0.1 m m dithiothreitol,
10 mm imidazole, 1% sodium cholate). The major red frac-
tions were combined, and repeatedly concentrated and
diluted using a centrifugal device to replace the buffer with
buffer H (50 mm potassium phosphate, pH 7.4, 20% glyc-
erol, 0.1 mm EDTA, 0.1 mm dithiothreitol, 1% sodium
cholate, 0.05% Tween 20).
The protease deficient E. coli strain BL21 was used as
host strain for the heterologous expression of AdR and
Adx. The plasmid containing the coding sequence for AdR
was kindly provided by Y. Sagara [32]. Recombinant Adx
and AdR were purified as described previously [33,34].
Functional characterization of hCYP11B1 A. Zo
¨
llner et al.
806 FEBS Journal 275 (2008) 799–810 ª 2008 The Authors Journal compilation ª 2008 FEBS
Isolation of CYP11B1 from bovine adrenals was performed
as described by Ikushiro et al. [13] with slight modifica-
tions.
RP-HPLC and mass spectrometry of the purified
hCYP11B1
Purity of the h11B1 was assessed by RP-HPLC. RP-HPLC
was conducted on a column Poros R1 ⁄ 10 (2.1 · 100 mm;
Applied Biosystems, Foster City, CA, USA) using a liquid
chromatograph (Agilent model 1100; Agilent Technologies,
Palo Alto, CA, USA) with a 16 min linear gradient of
8–72% CH3CN in 0.1% trifluoroacetic acid at a flow rate
of 0.1 mLÆmin
)1
. Column effluent was monitored by absor-
bance at 215 nm, 254 nm, 275 nm, 290 nm and 400 nm.
The peak eluted at 13.5 min contained the heme extracted
from h11B1 and that at 15.5 min contained the apoprotein.
The apoprotein peak was collected and subjected to
MALDI-TOF MS to verify the integrity of the protein
moiety on Voyager DE-Pro (Applied Biosystems) with sina-
pic acid as matrix.
UV/visible and CD spectroscopy
UV ⁄ visible spectra of CYP11B1 were recorded at room
temperature on a Shimadzu double-beam spectrophoto-
meter (UV2100PC; Shimadzu, Kyoto, Japan). The con-
centration of the 11b-hydroxylase was estimated by carbon
monoxide difference spectra assuming e
450–490
=
91 mm
)1
Æcm
)1
according to [35]. Adx and AdR concentra-
tions were determined using the molar extinction coefficient
e
415
= 9.8 mm
)1
Æcm
)1
[36] and e
450
= 10.9 mm
)1
Æcm
)1
[37],
respectively.
CD spectra were recorded at 20 °C on a Jasco J720 spec-
tropolarimeter (Jasco Corporation, Tokyo, Japan). Samples
contained 10 lm CYP11B1 in 10 mm potassium phosphate
buffer (pH 7.4) in a 1 cm cuvette for measurements in the
250–650 nm range and 5 lm CYP11B1 in the same buffer
in a 0.1 cm cuvette for measurements in the 190–
250 nm range. The spectra were accumulated five times and
then smoothed. The spectrum of the potassium phosphate
buffer was recorded in each case as a baseline. Substrate
11-deoxycortisol was added to a concentration of 20 lm.
Secondary structure content analysis was performed using
the contin and selcon programs [20,21].
Enzyme activity assays
These assays served the purpose to demonstrate the ability
of the recombinant CYP11B1 enzyme to 11b-hydroxylate
its natural substrates, 11-deoxycortisol and 11-deoxycorti-
costerone, to form cortisol and corticosterone, respectively.
Assays aimed at the characterization of the CYP11B1 activ-
ity depending on the Adx concentration were performed as
previously described for CYP11A1 reconstitution assays
[38] with slight modifications. All experiments were per-
formed using bovine Adx, which is capable of interacting
with hCYP11B1. Bovine and human Adx exhibit a
90% primary structure identity. Briefly, the reaction mix-
ture (0.5 mL) consisted of CYP11B1 (0.4 lm), AdR
(0.5 lm), Adx (2–20 lm), 11-deoxycortisol or 11-deoxycorti-
costerone (400 lm), MgCl
2
(1 mm)in50mm Hepes buffer
(pH 7.3, 0.05% (v ⁄ v) Tween 20). In addition to this, a
NADPH regenerating system consisting of MgCl
2
(1 lm),
glucose 6-phosphate (5 lm) and glucose 6-phosphate dehy-
drogenase (1 U) was applied.
In another set of experiments, we varied the substrate
concentration in the range 0–700 lm for both substrates
whereas the Adx concentration was fixed at 10 lm. All other
components were as described above. All reactions were ini-
tiated by the addition of 100 lm NADPH and were carried
out for 10 min at 37 °C. After stopping the reaction by add-
ing chloroform, either cortisol (for 11-deoxycorticosterone
conversion assays) or 11-deoxycorticosterone (for 11-deoxy-
cortisol conversion) was added to the corresponding reac-
tion mixture as an internal standard. After extraction of the
steroids and evaporation of the chloroform phase, the ste-
roids were resuspended in 200 lL acetonitrile and separated
on a Jasco reversed phase HPLC system of the LC900 series
using a 3.9 · 150 mm Waters Nova-Pak C
18
column
(Waters Corporation, Milford, MA, USA). Column temper-
ature was kept constant at 25 °C with a peltier oven. The
mobile phase used for steroid separation was a mixture of
acetonitrile ⁄ water (60 : 40) at a flow rate of 1 mLÆmin
)1
.
Steroid separation was monitored at 240 nm over a period
of 3 min. Product quantification was performed by correlat-
ing the product peak area with the peak area of the known
internal standard steroid (5 nmol cortisol or 11-deoxycorti-
costerone) added prior to the chloroform extraction.
K
m
and V
max
values were determined by plotting the sub-
strate conversion velocities versus the corresponding Adx
or substrate concentrations and by subsequently applying
Michaelis–Menten kinetics (hyperbolic fit) using the pro-
gram sigmaplot 2001 (Systat Software, San Jose, CA,
USA). Extracted V
max
values (nmol productÆmin
)1
Æ
nmol
)1
hCYP11B1) were subsequently converted into
k
cat
values (s
)1
).
To correlate the NADPH consumption with the amount
of product formed (i.e. the coupling percentage), we per-
formed additional experiments. Samples generated for
this purpose contained 400 l m substrate (11-deoxycortisol
or 11-deoxycorticosterone), 0.4 lm hCYP11B1, 3 lm Adx,
0.5 lm AdR in 50 mm Hepes buffer, pH. 7.4, containing
0.05% Tween 20. The reaction was initiated by addition of
NADPH to a final concentration of 100 lm. Reaction con-
ditions were as described above. The sample volume was
500 lL. NADPH consumption was determined spectro-
scopically by recording the absorption changes of the
A. Zo
¨
llner et al. Functional characterization of hCYP11B1
FEBS Journal 275 (2008) 799–810 ª 2008 The Authors Journal compilation ª 2008 FEBS 807
reaction mixture at 340 nm, corresponding to the absorp-
tion maximum of NADPH, at the start of the reaction
(t = 0) and after 10 min. To subtract protein absorption at
this wavelength, we used a reference reaction sample with-
out NADPH. NADPH consumption (i.e. the amount
of NADPH consumed during the reaction) was sub-
sequently determined by using the Lambert–Beer law
(e
340
NADPH = 6.3 mm
)1
Æcm
)1
) and the sample volume.
Product formation was determined as described above by
stopping the reaction with chloroform after 10 min and
subsequently separating the extracted steroids via HPLC.
Product quantification was performed as described before.
NADPH consumption values were subsequently correlated
with the amount of product formed to provide coupling
values expressed in percent (i.e. amount of product
in nmol · consumed amount of NADPH in nmol
)1
· 100).
Optical biosensor measurements
Formation of the bAdx ⁄ bCYP11B1 and bAdx ⁄ hCYP11B1
complexes was assayed on a Biacore 3000 system (Biacore,
Uppsala, Sweden), using the optical biosensor method
described previously [39] with slight modifications.
After activation of the CM5 chip with N-ethyl-N¢-di-
methylaminopropyl-carbodiimide and N-hydroxysuccini-
mide, 75 lL of a 200 lm Adx solution was injected with a
flow of 5 lLÆ min
)1
at 15 °C. The immobilization procedure
was completed by injecting 1 m ethanolamine hydrochloride
to block the remaining ester groups. Approximately
400 response units of Adx were immobilized on the dextran
matrix. Binding of hCYP11B1 or bCYP11B1 was analyzed
after injection of solutions with varying concentrations in
the range 10–500 nm. Each concentration was injected at
least three times. To visualize unspecific background inter-
actions between the dextran matrix and CYP11B1, a refer-
ence cell was created. To remove the bound CYP11B1,
10 lLof a 2mm NaOH solution was injected. K
D
values
were determined using the software biaeval, version 3.1.
Averaged binding curves for the interaction between Adx
and varying CYP11B1 concentrations were fitted simulta-
neously using different binding models available in the eval-
uation software (e.g. 1 : 1 Languimir-binding or a bivalent
binding model as at least two possible interaction sites for
Adx exist on CYP11B1). K
D
values were determined from
the fit with the lowest standard deviation.
Kinetics by rapid mixing
Stopped flow measurements were carried out on a SFM 300
stopped-flow spectrophotometer equipped with a FC 100 ⁄ 10
cuvette and a MPS 60 data-processing unit (Biologic SAS,
Claix, France) at 15 °C. Anaerobic conditions were achieved
by incubation of the stopped-flow device for 20 min with
argon-bubbled buffer containing 5 mm dithionite followed
by repeated flushing with excessively Ar-bubbled reaction
buffer to remove oxygen and remaining dithionite from the
system. All samples were prepared in a glove box in an oxy-
gen-free atmosphere. The reaction buffer applied for all mea-
surements was a 50 mm Hepes buffer (pH 7.4) containing
0.05% Tween 20 [39].
To follow the reduction of cytochrome CYP11B1 by
AdR-reduced Adx, the absorption changes were monitored
at 450 nm, which corresponds to the formation of the
ferrous–carbon monoxide complex [40–43] as previously
described for measurements carried out with CYP11A1
[29,39]. Prior to mixing, syringe A contained CYP11B1
(2 lm) whereas syringe B was filled with NADPH (200 lm),
AdR (2 lm) and varying concentrations of Adx in the
range 0.5–32 lm. The mixture in syringe B was allowed to
age for 5 min to assure complete reduction of Adx. The
solutions in the two syringes were saturated with CO prior
to loading into the driving syringes. All resulting curves
were evaluated using sigmaplot 2001. Kinetic traces were
analyzed using monoexponential or biexponential fits to
extract corresponding reduction rates. The k
obs
values were
plotted against the corresponding Adx concentration and
the curve was fitted with a hyperbolic equation to extract
maximal reduction rates, k
obs,max
. These plots were also
used to obtain K
D
values for the interaction between the
relevant redox states of the reacting proteins.
Acknowledgements
This work was supported by a grant from the Fonds
der Chemischen Industrie to RB and GM37942 to
MRW. The authors would like to thank K. Neumann,
A. Eiden-Plach and W. Reinle for their excellent tech-
nical support.
References
1 Miller WL & Tyrell JB (1995) The adrenal cortex. In
Endocrinology and Metabolism (Felig P, Baxter J &
Frohman L, eds), pp. 555–711. McGraw-Hill Press,
New York, NY.
2 White PC, Curnow KM & Pascoe L (1994) Disorders
of steroid 11-beta-hydroxylase isozymes. Endocr Rev 15,
421–438.
3 Mornet E, Dupont J, Vitek A & White PC (1989) Char-
acterization of two genes encoding human steroid 11
beta-hydroxylase (P-450(11) beta). J Biol Chem 264 ,
20961–20967.
4 Kawamoto T, Mitsuuchi Y, Toda K, Miyahara K, Yo-
koyama Y, Nakao K, Hosoda K, Yamamoto Y, Imura
H & Shizuta Y (1990) Cloning of cDNA and genomic
DNA for human cytochrome P-45011 beta. FEBS Lett
269, 345–349.
5 Zachmann M, Tassinari D & Prader A (1983) Clinical
and biochemical variability of congenital adrenal-hyper-
Functional characterization of hCYP11B1 A. Zo
¨
llner et al.
808 FEBS Journal 275 (2008) 799–810 ª 2008 The Authors Journal compilation ª 2008 FEBS
plasia due to 11-beta-hydroxylase deficiency – a study
of 25 patients. J Clin Endocrin Metab 56, 222–229.
6 Krone N, Grischuk Y, Muller M, Volk RE, Grotzinger
J, Holterhus PM, Sippell WG & Riepe FG (2006) Ana-
lyzing the functional and structural consequences of
two point mutations (P94L and A368D) in the
CYP11B1 gene causing congenital adrenal hyperplasia
resulting from 11-hydroxylase deficiency. J Clin Endo-
crin Metab 91, 2682–2688.
7 Peter M (2002) Congenital adrenal hyperplasia: 11 beta-
hydroxylase deficiency. Semin Reprod Med 20, 249–254.
8 Hakki T & Bernhardt R (2006) CYP17- and CYP11B-
dependent steroid hydroxylases as drug development
targets. Pharmacol Ther 111, 27–52.
9 Bernhardt R (1996) Cytochrome P450: structure, func-
tion, and generation of reactive oxygen species. Rev
Physiol Biochem Pharmacol 127, 137–221.
10 Kimura T (1981) ACTH stimulation on cholesterol side
chain cleavage activity of adrenocortical mitochondria.
Transfer of the stimulus from plasma membrane to
mitochondria. Mol Cell Biochem 36, 105–122.
11 Lambeth JD, Seybert DW & Kamin H (1980) Phospho-
lipid vesicle reconstituted cytochrome-P-450scc – mutu-
ally facilitated binding of cholesterol and adrenodoxin.
J Biol Chem 255, 138–143.
12 Lombardo A, Laine M, Defaye G, Monnier N, Guidi-
celli C & Chambaz EM (1986) Molecular-organization
(topography) of cytochrome-P-45011-beta in mitochon-
drial-membrane and phospholipid-vesicles as studied by
trypsinolysis. Biochim Biophys Acta 863, 71–81.
13 Ikushiro S, Kominami S & Takemori S (1989) Adrenal
cytochrome P-45011 beta-proteoliposomes catalyzing
aldosterone synthesis: preparation and characterization.
Biochim Biophys Acta 984, 50–56.
14 Takemori S, Sato H, Gomi T, Suhara K & Katagiri M
(1975) Purification and properties of cytochrome P-450-
beta-11 from adrenocortical mitochondria. Biochem
Biophys Res Commun 67, 1151–1157.
15 Nonaka Y, Fujii T, Kagawa N, Waterman MR,
Takemori H & Okamoto M (1998) Structure ⁄ function
relationship of CYP11B1 associated with Dahl’s
salt-resistant rats – expression of rat CYP11B1 and
CYP11B2 in Escherichia coli. Eur J Biochem 258,
869–878.
16 Kagawa N, Hori H, Waterman MR & Yoshioka S
(2004) Characterization of stable human aromatase
expressed in E. coli. Steroids 69, 235–243.
17 Uchida E, Kagawa N, Sakaki T, Urushino N, Sawada
N, Kamakura M, Ohta M, Kato S & Inouye K (2004)
Purification and characterization of mouse CYP27B1
overproduced by an Escherichia coli system coexpress-
ing molecular chaperonins GroEL ⁄ ES. Biochem Biophys
Res Commun 323, 505–511.
18 Arase M, Waterman MR & Kagawa N (2006) Purifica-
tion and characterization of bovine steroid 21-hydroxy-
lase (P450c21) efficiently expressed in Escherichia coli.
Biochem Biophys Res Commun 344, 400–405.
19 Ortiz de Montellano PR (1995) Cytochrome P450: Stuc-
ture, Mechanism and Biochemistry, 2nd edn. Plenum
Press, New York, NY.
20 Lobley A, Whitmore L & Wallace BA (2002) DI-
CHROWEB: an interactive website for the analysis of
protein secondary structure from circular dichroism
spectra. Bioinformatics
18, 211–212.
21 Whitmore L & Wallace BA (2004) DICHROWEB, an
online server for protein secondary structure analyses
from circular dichroism spectroscopic data. Nucl Acids
Res 32, W668–W673.
22 Ro
¨
nnberg M, Ellfolk N & Soininen R (1979) Circular
dichroism studies on cytochrome c peroxidase and
cytochrome c-551 of Pseudomonas aeruginosa. Biochim
Biophys Acta 578, 392–400.
23 Banci L, Bertini I, Eltis LD & Pierattelli R (1993) Spec-
troscopic characterization of a newly isolated cyto-
chrome P450 from Rhodococcus rhodochrous. Biophys J
65, 806–813.
24 Belkina NV, Lisurek M, Ivanov AS & Bernhardt R
(2001) Modelling of three-dimensional structures of
cytochromes P450 11B1 and 11B2. J Inorg Biochem 87,
197–207.
25 Gopalakrishnan MM, Grosch HW, Locatelli-Hoops S,
Werth N, Smolenova E, Nettersheim M, Sandhoff K &
Hasilik A (2004) Purified recombinant human prosapo-
sin forms oligomers that bind procathepsin D and affect
its autoactivation. Biochem J 383, 507–515.
26 Bernhardt R (2000) The role of adrenodoxin in adrenal
steroidogenesis. Curr Opinion Endocrinol Diabetes 7,
109–115.
27 Hampf M, Dao NT, Hoan NT & Bernhardt R
(2000) New molecular genetic defects causing 11beta-
hydroxylase deficiency (CAH). Endocr Res 26,
781–782.
28 Bureik M, Lisurek M & Bernhardt R (2002) The
human steroid hydroxylases CYP1B1 and CYP11B2.
Biol Chem 383 , 1537–1551.
29 Schiffler B, Kiefer M, Wilken A, Hannemann F,
Adolph HW & Bernhardt R (2001) The interaction of
bovine adrenodoxin with CYP11A1 (cytochrome
P450scc) and CYP11B1 (cytochrome P45011b) accelera-
tion of reduction and substrate conversion by site-direc-
ted mutagenesis of adrenodoxin. J Biol Chem 276,
36225–36232.
30 Bechtel S, Belkina N & Bernhardt R (2002) The effect
of amino-acid substitutions I112P, D147E and K152N
in CYP11B2 on the catalytic activities of the enzyme.
Eur J Biochem 269, 1118–1127.
31 Nishihara K, Kanemori M, Kitagawa M, Yanagi H &
Yura T (1998) Chaperone coexpression plasmids: differ-
ential and synergistic roles of DnaK-DnaJ-GrpE and
GroEL-GroES in assisting folding of an allergen of
A. Zo
¨
llner et al. Functional characterization of hCYP11B1
FEBS Journal 275 (2008) 799–810 ª 2008 The Authors Journal compilation ª 2008 FEBS 809
Japanese cedar pollen, Cryj2 in Escherichia coli. Appl
Environ Microbiol 64, 1694–1699.
32 Sagara Y, Takata Y, Miyata T, Hara T & Horiuchi T
(1987) Cloning and sequence analysis of adrenodoxin
reductase cDNA from bovine adrenal cortex. J Biochem
(Tokyo) 102, 1333–1336.
33 Sagara Y, Wada A, Takata Y, Waterman MR, Seki-
mizu K & Horiuchi T (1993) Direct expression of adre-
nodoxin reductase in Escherichia coli and the functional
characterization. Biol Pharm Bull 16 , 627–630.
34 Uhlmann H, Beckert V, Schwarz D & Bernhardt R
(1992) Expression of bovine adrenodoxin in E. coli and
site-directed mutagenesis of ⁄ 2 Fe-2S ⁄ cluster ligands.
Biochem Biophys Res Commun 188, 1131–1138.
35 Omura T & Sato R (1964) The carbon monoxide-bind-
ing pigment of liver microsomes. II. Solubilization,
purification, and properties. J Biol Chem 239, 2379–
2385.
36 Huang JJ & Kimura T (1973) Studies on adrenal ste-
roid hydroxylases. Oxidation-reduction properties of
adrenal iron-sulfur protein (adrenodoxin). Biochemistry
12, 406–409.
37 Chu JW & Kimura T (1973) Studies on adrenal steroid
hydroxylases. Molecular and catalytic properties of
adrenodoxin reductase (a flavoprotein). J Biol Chem
248, 2089–2094.
38 Bureik M, Zo
¨
llner A, Schuster N, Montenarh M &
Bernhardt R (2005) Phosphorylation of bovine adreno-
doxin by protein kinase CK2 affects the interaction
with its redox partner cytochrome p450(scc)
(CYP11A1). Biochemistry 44, 3821–3830.
39 Zo
¨
llner A, Pasquinelli MA, Bernhardt R & Beratan
DN (2007) Protein phosphorylation and intermolecular
electron transfer: a joint experimental and computa-
tional study of a hormone biosynthesis pathway. JAm
Chem Soc 129, 4206–4216.
40 Kashem MA, Lambeir AM & Dunford HB (1987)
Rapid spectral scan and stopped-flow studies of carbon-
monoxide binding to bovine adrenocortical cytochrome-
P-450scc. Biochim Biophys Acta 911, 162–167.
41 Lange R, Heiber-Langer I, Bonfils C, Fabre I, Negishi
M & Balny C (1994) Activation volume and energetic
properties of the binding of CO to hemoproteins.
Biophys J 66, 89–98.
42 Tuckey RC & Kamin H (1983) Kinetics of O
2
and CO
Binding to adrenal cytochrome P-450scc. Effect of cho-
lesterol, intermediates, and phosphatidylcholine vesicles.
J Biol Chem 258, 4232–4237.
43 Zo
¨
llner A, Hannemann F, Lisurek M & Bernhardt R
(2002) Deletions in the loop surrounding the iron-sulfur
cluster of adrenodoxin severely affect the interactions
with its native redox partners adrenodoxin reductase
und cytochrome P450
SCC
(CYP11A1). J Inorg Biochem
91, 644–654.
Functional characterization of hCYP11B1 A. Zo
¨
llner et al.
810 FEBS Journal 275 (2008) 799–810 ª 2008 The Authors Journal compilation ª 2008 FEBS