Báo cáo khoa học: Catalytic activation of human glucokinase by substrate binding – residue contacts involved in the binding of D-glucose to the super-open form and conformational transitions ppt
Bạn đang xem bản rút gọn của tài liệu. Xem và tải ngay bản đầy đủ của tài liệu tại đây (722.04 KB, 15 trang )
Catalytic activation of human glucokinase by substrate
binding – residue contacts involved in the binding of
D-glucose to the super-open form and conformational
transitions
Janne Molnes
1,2,3
, Lise Bjørkhaug
1,2
, Oddmund Søvik
1
,Pa
˚
l R. Njølstad
1,4
and Torgeir Flatmark
3
1 Department of Clinical Medicine, University of Bergen, Norway
2 Center for Medical Genetics and Molecular Medicine, Haukeland University Hospital, Bergen, Norway
3 Department of Biomedicine, University of Bergen, Norway
4 Department of Pediatrics, Haukeland University Hospital, Bergen, Norway
Glucokinase (GK), ATP : d-hexose 6-phosphotransfer-
ase (EC 2.7.1.1), catalyses the phosphorylation of a-d-
glucose (Glc) to form glucose 6-phosphate, using
MgATP
2)
as the phosphoryl donor. It is a key regula-
tory enzyme in the pancreatic b-cell [isoform 1 of
human glucokinase (hGK)] [1] and plays a crucial role
in the regulation of insulin secretion, and has been
termed the glucose sensor of the b-cell [2]. GK is also
Keywords
catalytic activation;
D-glucose binding;
glucokinase; hysteresis; intrinsic tryptophan
fluorescence
Correspondence
T. Flatmark, Department of Biomedicine,
University of Bergen, N-5009 Bergen,
Norway
Fax: +47 55586360
Tel: +47 55586428
E-mail: torgeir.fl
(Received 19 December 2007, revised 7
March 2008, accepted 10 March 2008)
doi:10.1111/j.1742-4658.2008.06391.x
a-d-Glucose activates glucokinase (EC 2.7.1.1) on its binding to the active
site by inducing a global hysteretic conformational change. Using intrinsic
tryptophan fluorescence as a probe on the a-d-glucose induced conforma-
tional changes in the pancreatic isoform 1 of human glucokinase, key resi-
dues involved in the process were identified by site-directed mutagenesis.
Single-site W fi F mutations enabled the assignment of the fluorescence
enhancement (DF ⁄ F
0
) mainly to W99 and W167 in flexible loop structures,
but the biphasic time course of DF ⁄ F
0
is variably influenced by all trypto-
phan residues. The human glucokinase–a-d-glucose association
(K
d
= 4.8 ± 0.1 mm at 25 °C) is driven by a favourable entropy change
(DS = 150 ± 10 JÆmol
)1
ÆK
)1
). Although X-ray crystallographic studies
have revealed the a-d-glucose binding residues in the closed state, the con-
tact residues that make essential contributions to its binding to the super-
open conformation remain unidentified. In the present study, we combined
functional mutagenesis with structural dynamic analyses to identify residue
contacts involved in the initial binding of a-d-glucose and conformational
transitions. The mutations N204A, D205A or E256A ⁄ K in the L-domain
resulted in enzyme forms that did not bind a-d-glucose at 200 mm and
were essentially catalytically inactive. Our data support a molecular
dynamic model in which a concerted binding of a-d -glucose to N204, N231
and E256 in the super-open conformation induces local torsional stresses at
N204 ⁄ D205 propagating towards a closed conformation, involving struc-
tural changes in the highly flexible interdomain connecting region II (R192-
N204), helix 5 (V181-R191), helix 6 (D205-Y215) and the C-terminal
helix 17 (R447-K460).
Abbreviations
CR, connecting region; Glc, a-
D-glucose; GNM, Gaussian network model; GST, glutathione S-transferase; hGK, human glucokinase;
ITF, intrinsic tryptophan fluorescence; MH, a-
D-mannoheptulose; MODY2, maturity-onset diabetes of the young type 2; n
H,
Hill coefficient;
PDB, protein databank.
FEBS Journal 275 (2008) 2467–2481 ª 2008 The Authors Journal compilation ª 2008 FEBS 2467
expressed in the liver (hGK isoforms 2 and 3) [3] and
in the central nervous system (hGK isoform 1) [4],
where the enzyme has a similar important function in
glucose metabolism. In humans, a number of naturally
occurring mutations in the GK gene (GCK) have been
detected in patients suffering from familial, mild fast-
ing hyperglycemia (maturity-onset diabetes of the
young type 2; MODY2), persistent hyperinsulinemic
hypoglycemia of infancy and permanent neonatal
diabetes mellitus [5–7].
Although GK is a monomeric enzyme, it shows non-
hyperbolic (sigmoidal) dependence on Glc concentration
in steady-state enzyme kinetics [8,9]. However, the equi-
librium binding of Glc alone is characterized by a hyper-
bolic binding isotherm, as first determined by intrinsic
tryptophan fluorescence (ITF) spectroscopy of rat liver
glucokinase [10]. This enzyme [10] and the recombinant
human enzyme [11] are both activated in vitro by incu-
bation with Glc, and the process has been described as a
reversible transition from an inactive, low affinity state
to a high activity, higher affinity state [10,11]. Crystal
structure analyses of the unliganded and Glc-bound
hGK [12] have confirmed the biochemical and biophysi-
cal studies by demonstrating that the binding of Glc at
the active site indeed induces a large-scale domain move-
ment that closes the active site cleft and creates the
stereochemical environment for binding of the cosub-
strate (MgATP
2)
) and thus catalysis. Moreover, the
maximal activation of rat liver glucokinase by Glc and
the related overall conformational transition, as fol-
lowed in real-time by ITF spectroscopy, was shown to
be a relatively slow process [10] characteristic of a hys-
teretic enzyme [13]. Although X-ray crystallographic
studies have revealed the structures of the unliganded
(super-open) and Glc-bound (fully-closed) states of
hGK [12], the residue contacts that make essential con-
tributions to the binding of Glc to the super-open con-
formation have not been identified. The characterization
of these residues is important for our understanding of
how substrate binding is coupled to the global confor-
mational transition and catalytic activation.
In the present study, recombinant wild-type hGK
and selected mutant forms were isolated aiming: (a) to
examine the contribution of its three tryptophan resi-
dues (Fig. 1A) to the multiphasic fluorescence enhance-
ment induced by Glc binding; (b) to identify the active
site residues involved in the binding of Glc to the
super-open state (Fig. 1C) of this two domain [large
(L) and small (S)] enzyme, and thus the site of initia-
tion of the global conformational transition; and (c) to
gain some insight into how the local torsional stresses
at the contact residues in the super-open state propa-
gate through the structure towards cleft closure and a
catalytically competent conformation. To explore these
aspects, we used a combined approach of molecular
dynamics studies by real-time ITF spectroscopy, struc-
tural dynamic analyses and functional mutagenesis.
Our findings provide new insight into the catalytic acti-
vation of hGK by substrate binding that will be valu-
able in studies of human diseases associated with
mutations in the GCK gene, notably in some mutations
in which the molecular mechanism is not yet under-
stood.
W99
W167
W257
Glc
CompA
T168
K169
D205
N204
N231
E256
E290
E290
E256
N231
N204
D205
A
B
C
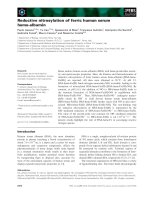
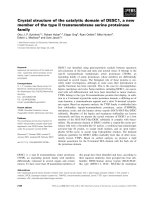
Fig. 1. (A) Localization of tryptophan residues in the 3D structure
of the fully-closed state of wild-type hGK with bound
D-glucose
(Glc) and the allosteric activator compound A (PDB identity: 1v4s).
(B) The Glc contact residues in the substrate-bound state (PDB
identity: 1v4s). All residues were individually mutated. (C) The spa-
cial proximity of active site residues in the L-domain and connecting
region II which are potentially involved in the binding of
D-glucose
in the super-open state (PDB identity: 1v4t). The structural images
were generated using
PYMOL, version 0.99.
Activation of glucokinase by
D-glucose binding J. Molnes et al.
2468 FEBS Journal 275 (2008) 2467–2481 ª 2008 The Authors Journal compilation ª 2008 FEBS
Results
Tryptophan residues in wild-type hGK
The crystal structures of hGK [12] have identified the
positions and the interactions of its three tryptophans in
the absence (super-open state) and in the presence (fully-
closed state) of Glc and 2-amino-4-fluoro-5-(1-methyl-
1H-imidazol-2-ylsulfanyl)-N-thiazol-2-yl-benzamide, a
synthetic allosteric activator termed compound A
(Fig. 1A). Based on the coordinates of the two struc-
tures [protein databank (PDB) identity: 1v4t and 1v4s],
molecular motion analyses (.
yale.edu/cgi-bin/morph.cgi?ID=496337-23316) revealed
a change in the backbone dihedral torsion angle
(Du + Dw) for W99, W167 and W257 to be 110.5°,
26.3° and )0.2°, respectively. It should be noted that
residues 157–179, unassigned in the electron density
map of the super-open structure (1v4t), were ‘repaired’
by the molmovdb algorithm.
Steady-state kinetics of wild-type hGK and the
W
fi
F mutant forms
As previously reported [14,15], the wild-type hGK and
wild-type glutathione S-transferase (GST)-hGK dem-
onstrated the same steady-state kinetic parameters as
well as the K
d
value for Glc in the ITF binding assay
(Fig. 2C), and the GST fusion proteins were therefore
mostly used in the kinetic analyses of mutant proteins.
The wild-type GST-hGK revealed a positive kinetic
cooperativity with Glc [Hill coefficient (n
H
) = 1.7
4.2
4.4
4.6
4.8
5.0
5.2
5.4
5.6
5.8
0
20
40
60
80
100
AC
BD
F
eq
/ F
o
(normalized)
0
20
40
60
80
100
120
140
160
–ln K
d
Glc
[r
2
= 0.96]
Fluorescence intensityFluorescence intensity
0.0
0.2
0.4
0.6
0.8
1.0
[
r
2
= 0.99]
3.3 3.4 3.5 3.6
[Glc] (mM)
x10
3
(K
–1
)
1
T
0
20
40
60
338.6 nm
340.5 nm
Wavelength (nm)
320 340 360 380 400 420 440
340.3 nm
341.0 nm
Wavelength (nm)
320 340 360 380 400 420 440
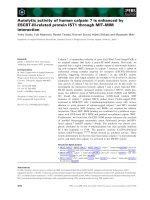
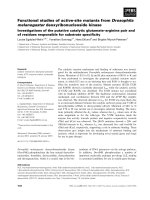
Fig. 2. Effect of D-glucose on the equilibrium fluorescence of wild-type hGK and wild-type GST-hGK. (A) and (B) The fluorescence spectra of
the enzyme (25 °C) in the absence (solid line) and presence (short dashes) of 200 m
M Glc for wild-type hGK (A) and wild-type GST-hGK (B).
(C) The Glc binding isotherm at 25 °C was obtained by monitoring the enhancement in ITF of wild-type GST-hGK (s) and wild-type hGK (
)
by increasing concentrations of Glc. The solid lines represent the fit of the data to two hyperbola as obtained by nonlinear regression analy-
ses, giving K
d
values of 4.8 ± 0.1 mM and 4.9 ± 0.1 mM for wild-type GST-hGK and wild-type hGK, respectively. For both plots, the value at
60 m
M Glc is normalized to 1. (D) van’t Hoff analysis of the temperature dependence of the apparent dissociation constant (K
d
) for the hGK-
Glc interaction measured at 7, 12, 17.5, 22.5, 27.5 and 31.5 °C. A least-square linear fit (r
2
= 0.96) yields a DH
van’t Hoff
of 32 ± 3 kJÆmol
)1
and a DS of 150 ± 10 JÆmol
)1
ÆK
)1
, indicating that the interaction is driven by a favourable entropy change. The measurements were per-
formed using 0.03 mgÆmL
)1
wild-type GST-hGK in 20 mM Hepes, 100 mM NaCl and 1 mM dithiothreitol (pH 7.0). The excitation wavelength
was 295 nm and excitation and emission slits were 3 and 7 nm, respectively (A, B), or 4 and 7 nm, respectively (C, D).
J. Molnes et al. Activation of glucokinase by
D-glucose binding
FEBS Journal 275 (2008) 2467–2481 ª 2008 The Authors Journal compilation ª 2008 FEBS 2469
± 0.1] with a substrate concentration yielding half-
maximum saturation ([S]
0.5
) of 8.4 ± 0.2 mm, whereas
all three W fi F mutants demonstrated a reduced
catalytic activity (Table 1). W167F-hGK showed a
pronounced reduction in ‘catalytic efficiency’ (24-
fold), with an approximate three-fold reduction in
V
max
and a six-fold increase in the [S]
0.5
value for Glc,
and the Hill coefficient was reduced to n
H
=
1.12 ± 0.08. The W257F mutant also revealed a
slightly reduced affinity for Glc, whereas W99F
showed a small increase in both affinity and ‘cata-
lytic efficiency’. A normal positive kinetic cooper-
ativity was observed for the W99F and W257F mutant
forms.
Correlation of tryptophan environments with
fluorescence properties
The static solvent accessibility of W99, W167 and
W257 in the super-open⁄ fully-closed state was calcu-
lated [16] as 27 ⁄ 45, X ⁄ 4.6 and 0.8 ⁄ 0.0%, respectively.
W167 and W257 are ‘buried’ tryptophans, whereas
W99 is a surface residue with a high degree of expo-
sure to aqueous solvent in both states, notably in the
Glc-bound state. Note that no number exists for W167
in the super-open state because residues 157–179 are
unassigned in the electron density map [12]. Figure 3A
shows the fluorescence emission spectrum
(k
ex
= 295 nm) of wild-type hGK at pH 7.0 with
k
max
340.5 nm (k
max
341 nm for wild-type GST-
hGK; Fig. 2B), consistent with the solvent accessibility
of the three tryptophans. On denaturing with 6 m gua-
nidium hydrochloride, a red shift was observed
(k
max
357 nm), close to the spectrum for free trypto-
phan (data not shown). On increasing the temperature
from 7 °Cto37°C, an approximately 25% decrease in
the fluorescence intensity at k
max
and an approximately
5.1 nm red shift in the k
max
were observed (Fig. 3B).
These changes suggest a complex effect of temperature
on the conformational substates of the apo enzyme,
presumably with a more solvent-exposed W99 at the
higher temperature. Moreover, in rapid mixing experi-
ments a temperature change from 1 °Cto39°C
resulted in a time dependent quenching of the fluores-
cence within a time scale of approximately 6 min
(Fig. 3C). A semi-log plot (Fig. 3C, inset) revealed a
biphasic time course with a relatively fast phase
(t
1 ⁄ 2
11 s) and a slow phase (t
1 ⁄ 2
64 s).
Effect of
D-glucose on the equilibrium
fluorescence of wild-type hGK and its W
fi
F
mutant forms
From the equilibrium fluorescence spectra of wild-
type hGK (Fig. 2A), it is seen that, upon the addition
of 200 mm Glc, fluorescence (DF
eq
⁄ F
0
) increases by
approximately 60%, with 1.9 nm blue shift in k
max
.
A similar effect was seen with the wild-type GST-
hGK fusion protein (Fig. 2B). The increase in fluores-
cence units was comparable without (DF
eq
) F
0
33)
and with (DF
eq
) F
0
30) fusion partner, considering
the experimental error in determining the absorption
coefficients at 280 nm for the two proteins. No effect
of Glc was observed on the fluorescence spectrum of
the isolated GST protein (data not shown). The pro-
tein with and without fusion partner also shows the
same time-dependence of the fluorescence enhance-
ment (see below) and revealed identical hyperbolic
binding isotherms for Glc with K
d
values of
4.8 ± 0.1 and 4.9 ± 0.1 mm, respectively, at 25 °C
(Fig. 2C). These data demonstrate that the fusion
partner at the N-terminal does not perturb the sub-
strate-induced conformational changes of hGK, and
the GST fusion proteins were therefore used alterna-
tively in the studies of mutant proteins due to their
potentially higher in vitro stability. To better under-
stand the driving force of the hGK–Glc interaction,
the temperature dependence was determined in the
range 7–32 °C (Fig. 2D). A least-square linear fit
(r
2
= 0.96) yields a DH
van’t Hoff
of 32 ± 3 kJÆmol
)1
from the slope and a DS of 150 ± 10 JÆmol
)1
ÆK
)1
from the y-axis intercept. Thus, the favourable DS
overcomes the unfavourable DH and drives the
association between hGK and Glc.
Table 1. Steady-state kinetic parameters of wild-type GST-hGK and its Trp mutant forms.
GST-hGK V
max
a
(nmolÆmg
)1
Æs
)1
) k
cat
(s
)1
)[S]
0.5
a
(mM)
k
cat
⁄ [S]
0.5
(mM
)1
Æs
)1
) n
H
a
Wild-type 795 ± 12 60.4 ± 0.9 8.4 ± 0.2 7.2 1.71 ± 0.06
W99F 616 ± 8 46.8 ± 0.6 6.2 ± 0.2 7.5 1.75 ± 0.08
W167F 229 ± 10 17.4 ± 0.8 55.2 ± 5.3 0.3 1.12 ± 0.08
W257F 554 ± 14 42.1 ± 1.1 11.4 ± 0.5 3.7 1.66 ± 0.10
a
Based on nonlinear regression and the Hill equation.
Activation of glucokinase by
D-glucose binding J. Molnes et al.
2470 FEBS Journal 275 (2008) 2467–2481 ª 2008 The Authors Journal compilation ª 2008 FEBS
To simultaneously demonstrate the effect of Glc on
both the fluorescence enhancement and the spectral
shifts, the +Glc ⁄ )Glc fluorescence difference spectra
were recorded for wild-type and W fi F mutant forms.
The difference spectrum of wild-type GST-hGK
(DF
eq
⁄ F
0
27%) revealed a k
max
334 nm (Fig. 4A)
compatible with an additive contribution of the three
tryptophans to the Glc-induced fluorescence enhance-
ment. At identical protein concentrations, all the
W fi F mutant forms resulted in a decreased
Glc-induced fluorescence enhancement, being most
pronounced for W99 (DF
eq
⁄ F
0
10%) (Fig. 4B) and
W167 (DF
eq
⁄ F
0
6%) (Fig. 4C), whereas a DF
eq
⁄ F
0
value of approximately 19% was observed for the
W257F mutant form (Fig. 4D). The W167F and
W257F mutants revealed only an approximate 2 nm
shift in k
max
in the +Glc ⁄ )Glc difference spectra
compared to wild-type GST-hGK, whereas the W99F
mutant demonstrated an approximately 11 nm blue
shift, as expected from the low solvent accessibility of
the remaining W167 and W257 residues. For wild-type
GST-hGK and the two ‘buried’ tryptophan mutants
(W167F and W257F), a close correlation (r
2
= 0.99)
was observed between the DF
eq
⁄ F
0
value and the cata-
lytic activity at 200 mm Glc (Fig. 5 and supplementary
Table S1). This correlation is presumably related to a
variable perturbation of the overall structural dynam-
ics in the W167F and W257F mutant forms that
affects the time-dependent Glc-induced conformational
change (supplementary Fig. S1) and catalytic activa-
tion to the same extent. This is in contrast to the
W99F mutant form because W99 is more solvent
110
115
120
125
130
135
Fluorescence intensity
338.6 nm
343.7 nm
Fluorescence intensity
340.5 nm
Fluorescence intensity
F
t
- F
eq
F
t= 0
- F
eq
log
x 100
7
°
C
37
°
C
0
100 200 300
400
320 340 360 380 400 420 440
Wavelength (nm)Wavelength (nm)
Time (s)
350 400 450 500
0
20
40
60
0
20
10
40
30
50
60
80
100
120
140
160
0 50 100 150
0.2
0.4
0.6
0.8
1.0
1.2
1.4
1.6
1.8
2.0
2.2
Time (s)
10 15 25 3520 30 40
110
120
130
140
150
Fluorescence intensity
Temp (
°
C)
BA
C
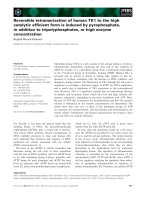
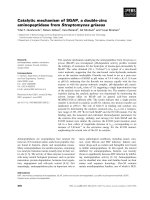
Fig. 3. Steady-state fluorescence of hGK. (A) The spectrum of the isolated wild-type hGK (0.03 mgÆmL
)1
) obtained in the unliganded super-
open state at 25 °C. (B) The effect of temperature (7 °Cto37°C) on the fluorescence intensity of wild-type hGK (0.063 mgÆmL
)1
). The
observed red-shift in k
max
with increasing temperature is emphasized. The graph (inset) shows the temperature dependence of the fluores-
cence intensity at k
max
. (C) A typical ‘temperature-jump’ experiment (measured over a 7 min period), in which the isolated wild-type hGK
enzyme (0.063 mgÆmL
)1
) stored in buffer at approximately 1 °C was rapidly ( 5 s) mixed in the cuvette at 39 °C, demonstrating the
expected decrease in fluorescence intensity at k = 340 nm, with an end point at approximately 6 min. The semi-log plot (inset) shows a
biphasic time course with t
1 ⁄ 2
11 s and t
1 ⁄ 2
64 s. F
t =0
is the fluorescence intensity measured immediately after mixing of the enzyme
(< 5 s after addition), and F
eq
is the equilibrium fluorescence intensity. The fluorescence was read every 0.1 s, and F
t
is the average fluores-
cence intensity of 20 data points (2 s) (first phase) or 100 or 200 data points (10 s or 20 s, respectively) (second phase). The data were anal-
ysed by linear-regression analysis using
SIGMAPLOT TECHNICAL GRAPHING Software. The excitation wavelength was 295 nm, and excitation and
emission slits were 3 and 7 nm in (A, B) or 4 and 7 nm in (C), respectively.
J. Molnes et al. Activation of glucokinase by
D-glucose binding
FEBS Journal 275 (2008) 2467–2481 ª 2008 The Authors Journal compilation ª 2008 FEBS 2471
exposed in a highly flexible surface loop. The far-UV
CD spectrum of wild-type hGK revealed negative
bands at 208.5 and 222 nm (data not shown) charac-
teristic of a protein predominated by a-helical second-
ary structure, with an apparent a-helical content of
approximately 31%. W167F-hGK revealed a similar
CD spectrum, but with an estimated slightly reduced
a-helical content. The thermal denaturation profiles of
the two proteins, as measured at 222 nm in the pres-
ence of 50 mm Glc, gave T
m
values of 44.2 ° C and
42.4 °C for wild-type hGK and W167F-hGK, respec-
tively. These data demonstrate that the secondary
structure and conformational stability of the W167F
mutant is relatively well preserved, and support the
conclusion that the functional effects of the W fi F
mutation are presumably mainly related to a structural
perturbation due to its localization next to T168 and
K169 whose side-chains normally form hydrogen bond
interactions with Glc in the fully-closed conformation.
D-glucose-induced conformational dynamics
The time course of the fluorescence enhancement
induced by Glc was followed on a second-to-minute
time scale. As shown in Fig. 6, a rapid initial phase
(0–5 s) represented approximately 80% of the total
increase in fluorescence of wild-type hGK (Fig. 6A)
and wild-type GST-hGK (Fig. 6B), and includes the
two phases observed by transient kinetics [11], but the
equilibrium level (DF
eq
⁄ F
0
) was not reached until
approximately 3 min at 25 °C. The data in Fig. 6C
refer to the total fluorescence change, DF
eq
⁄ F
0
, (black
bars) or the amplitude of the fast phase, DF
initial
⁄ F
0
(gray bars) or the slow phase, DF
slow
⁄ F
0
, (open bars),
all relative to the baseline value F
0
. A biphasic time
course was also observed for the W99F and W257F
mutant forms (supplementary Fig. S1B,D) although
the total amplitude at equilibrium and the relative pro-
portion of the two phases varied (Fig. 6C), and the
time required to reach the equilibrium value increased.
By contrast, in the W167F mutant form the rapid
phase dominated, with a scarcely detectable slow
phase, and the overall amplitude was markedly
reduced (Fig. 6C and supplementary Fig. S1C). This
may be related to the loss of kinetic cooperativity of
Glc binding (m
H
= 1.12 ± 0.08; Table 1).
a-d-Mannoheptulose (MH) is a nonmetabolized
competitive inhibitor of GK. This Glc analogue has
been proposed to bind at the catalytic site in the closed
conformation of GK [17,18] with a 50% inhibition at
336.4 nm
334.3 nm
323.4 nm
∼ 332 nm
320 340 360 380 400 420
Wavelength (nm)
320 340 360 380 400 420
Wavelength (nm)
320 340 360 380 400 420
Wavelength (nm)
320 340 360 380 400 420
Wavelength (nm)
0
10
20
30
Fluorescence difference
0
10
20
30
AB
CD
Fluorescence difference
0
10
20
30
Fluorescence difference
0
10
20
30
Fluorescence difference
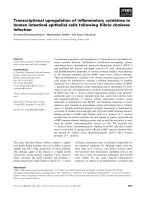
Fig. 4. Effect of D-glucose on the fluorescence of W fi F mutant
forms. The Glc-induced fluorescence changes of the GST fusion
proteins (0.03 mgÆmL
)1
) upon addition of 200 mM Glc are shown as
fluorescence difference spectra. Each spectrum was obtained by
subtracting the signal averaged spectra obtained in the absence of
Glc from the spectra obtained in the presence of Glc. (A) Wild-type
GST-hGK; (B) W99F GST-hGK; (C) W167F GST-hGK and (D) W257F
GST-hGK. All spectra were obtained at 25 °C with an excitation
wavelength of 295 nm and excitation and emission slit widths of 3
and 7 nm, respectively.
WT
W99F
W257F
W167F
[r
2
= 0.99]
ΔF
eq
/ F
o
0.2 0.4 0.6 0.8 1.0 1.2
5
10
15
20
25
30
Relative catalytic activity
Fig. 5. Correlation between the catalytic activity and the D-glucose
induced fluorescence enhancement of wild-type GST-hGK and
W fi F mutant forms. Shown are the values for catalytic activity at
200 m
M Glc (relative to wild-type hGK) and the corresponding val-
ues for fluorescence intensity (Table S1). A linear correlation of
r
2
= 0.99 was obtained for the wild-type hGK, W167 and W257
mutant forms. Graphic points including error bars represent the
mean ± SD of three or four measurements.
Activation of glucokinase by
D-glucose binding J. Molnes et al.
2472 FEBS Journal 275 (2008) 2467–2481 ª 2008 The Authors Journal compilation ª 2008 FEBS
approximately 2 mm [19]. From supplementary
Fig. S2A, it is seen that MH binds to the super-open
conformation and induces an equilibrium enhancement
of hGK fluorescence similar to Glc and with a similar
biphasic time dependency. From the hyperbolic bind-
ing isotherm (supplementary Fig. S2B), a K
d
of
8.0 ± 0.7 mm was calculated at 25 °C.
Functional mutation analysis of Glc contact
residues at the active site
The 3D structure of the closed state of hGK (PDB
identity: 1v4s) has revealed that Glc is hydrogen
bonded to amino acids in the L-domain (residues
N204, D205, N231, E256 and E290) and the S-domain
(residues T168 and K169) (Fig. 1B). To identify the
contact residues involved in the initial binding of Glc
to the super-open state (Fig. 1C) of this two domain
hinge-bending enzyme, all the actual residues were
individually mutated (supplementary Table S2). The
mutant forms were expressed as GST-fusion proteins
and subjected to steady-state enzyme kinetics and
Glc-induced fluorescence enhancement analysis
(Table 2). The main results of this screen (Table 2) are
alternatively shown in supplementary Fig. S3, includ-
ing the ‘catalytic efficiency’ (k
cat
⁄ [S]
0.5
) (black bars)
and the fluorescence enhancement at 200 mm Glc,
(DF
eq
⁄ F
0
)
max
(gray bars). The mutations in the
L-domain (N204A, D205A and E256A ⁄ K) resulted in
enzyme forms that did not give any fluorescence
enhancement by Glc and they were essentially catalyti-
cally inactive at a Glc concentration of 200 mm.
N231A gave a DF
eq
⁄ F
0
response of approximately 6%
versus wild-type and no measureable activity. By con-
trast, the mutations in the S-domain (T168G and
K169N) experienced a variable partial loss ( 20–
40%) of Glc-induced fluorescence enhancement, with
an increased K
d
value and reduced catalytic activity
(Table 2). The titration curves for the mutants T168G,
K169N and Q287V all revealed clear hyperbolic bind-
ing isotherms for Glc (r
2
= 0.99) (data not shown).
For the mutant N231A, the accuracy of the experi-
ments was hindered by the low fluorescence response
to Glc (DF
eq
⁄ F
0
at 200 mm Glc 6%), but the data
were fitted to a hyperbolic binding curve (r
2
= 0.91)
(data not shown).
Structural dynamic analyses
3D structural analyses of the Glc-induced conforma-
tional changes [12] revealed that the enzyme is a very
dynamic structure with a high conformational flexibil-
ity. The crystallographic B factor values for C
a
car-
bons (Fig. 7A), demonstrating the freedom and
restriction for various sites, revealed low values
(£ 30 A
2
) for the Glc-interacting residues in the unli-
ganded state, except for T168 and K169. The confor-
mational fluctuations, computed by the Gaussian
network model (GNM) [20,21], revealed similar sites
(minima) of low translation mobility compatible with
N204, D205, N231 and E256 (Fig. 7B) as potential
0
5
10
15
20
25
30
ΔFluorescence
Time (s)
0
100 200 300
Time (s)
0 100 200 300
50
60
70
80
90
100
A
B
C
Fluorescence intensityFluorescence intensity
100
110
120
130
140
WT W99F W167F W257F
Fig. 6. The time-dependent D-glucose-induced fluorescence
enhancement of wild-type hGK, wild-type GST-hGK and its W fi F
mutant forms. (A, B) The time course for the Glc-induced fluores-
cence enhancement of wild-type hGK (A) and wild-type GST-hGK
(B) as measured on a time scale of 0–6 min, at 200 m
M Glc. (C) A
comparison of the time-dependent fluorescence enhancement in
wild-type GST-hGK and its W fi F mutant forms. Shown are the
values listed in supplementary Table S1 for the total change in ITF
upon addition of 200 m
M Glc, measured as DF
eq
⁄ F
0
(black bars) or
the amplitude of the fast phase DF
initial
⁄ F
0
(i.e. 0–5 s; gray bars)
and slow phase DF
slow
⁄ F
0
(i.e. 5 s to 3 min; open bars). The
change in ITF was followed at 25 °C with an excitation wavelength
of 295 nm and excitation and emission slit widths of 4 and 7 nm,
respectively. Each column represents the mean ± SD of three mea-
surements.
J. Molnes et al. Activation of glucokinase by
D-glucose binding
FEBS Journal 275 (2008) 2467–2481 ª 2008 The Authors Journal compilation ª 2008 FEBS 2473
ligand binding sites. The binding of Glc changes not
only the tertiary structure (large scale domain motion),
but also the secondary structure and side-chain posi-
tioning ⁄ interactions. Thus, 17 helices were identified in
the unliganded super-open state (PDB identity: 1v4t)
versus 19 helices in the Glc and allosteric activator-
bound closed state (PDB identity: 1v4s). The changes
in the backbone and side-chain dihedral angles for the
Glc contact residues are shown in Table 3.
Table 2. Steady-state kinetics and fluorescence properties of wild-type GST-hGK and its active site mutant forms. Each number was obtained from measurements at 12–15 different glu-
cose concentrations. The mutations N204A, D205A, N231A and E256A ⁄ K resulted in enzyme forms that do not bind Glc at all at physiological concentrations of Glc and they are essen-
tially catalytically inactive. Only in the range 200–1600 m
M was measurable activity observed for N204A, N231A and E256A. The catalytic activity presented for these mutants is the
activity measured at a Glc concentration of 200 m
M. NM, not measurable.
Wild-type T168G K169N N204A D205A N231A E256K E256A Q287V E290A
Catalytic activity
(nmolÆmg
)1
Æs
)1
)
795 ± 12 75 ± 2 0.25 ± 0.01 71 NM
a
0.2 NM
c
21 460 ± 3 365 ± 47
Relative catalytic
activity (%)
100 9.4 0.03 8.9 NM 0.03 NM. 2.6 57.9 45.9
[S]
0.5
Glc (mM) 8.4 ± 0.2 26.7 ± 1.5 28.2 ± 2.1 976 ± 89 NM NM
b
NM 1625 ± 359 35.1 ± 0.7 829 ± 196
k
cat
⁄ [S]
0.5
(mM
)1
Æs
)1
) 7.2 0.2 6.7 · 10
)4
5.5 · 10)3NM NM
b
NM 9.8 · 10
)4
1.0 0.03
Hill coefficient (n
H
) 1.71 ± 0.06 1.01 ± 0.05 0.98 ± 0.08 1.31 ± 0.05 NM NM
b
NM 1.46 ± 0.10 1.22 ± 0.03 1.03 ± 0.06
(DF
eq
⁄ F
0
)
max
25.7 ± 0.1 14.7 ± 0.1 19.9 ± 0.2 NM NM 1.5 ± 0.1 NM NM 21.5 ± 0.2 11.7 ± 0.4
K
d
Glc (mM) 4.8 ± 0.1 17.8 ± 0.3 47.9 ± 1.4 NM NM 21.9 ± 7.1 NM NM 23.3 ± 0.9 395 ± 22
a
Catalytic activity was not detectable at 200 times the enzyme concentration used for wild-type hGK.
b
The mutant form had no catalytic activity at physiological [Glc]. We were unable to
estimate n
H
and the [S]
0.5
for Glc.
c
Catalytic activity was nondetectable at 100 times the enzyme concentration used for wild-type hGK.
0.000
0.002
0.004
0.006
0.008
0.010
0.012
0.014
N204
D205
T168
K169
E256
N231
Q287
E290
Fluctuations
T168
K169
N204
D205
N231
E256
Q287
E290
100 200 300 400
0
20
40
60
80
100
A
B
B-factor (A
2
)
Residues
100 200 300 400
Residues
Fig. 7. Crystallographic B-factor values for C
a
carbons (A) and
mobilities in the global modes (B) for the unliganded state of wild-
type hGK (PDB identity: 1v4t). The residue fluctuations (B) were
predicted by the GNM [20,21], and the profile represents the slow-
est frequency mode. As indicated, the residues 157–179 of the
S-domain are unassigned in the electron density map.
Table 3. Changes in backbone and side-chain dihedral angles of
Glc contact residues in wild-type hGK on binding Glc. Values are
calculated from the coordinates of the super-open (PDB identity:
1v4t) and fully-closed (PDB identity: 1v4s) state.
Residue (Du + Dw) Dv
1
Dv
2
N204 )2.1 15.4 178.9
D205 0.3 177.7 16.5
N231 5.3 0.4 8.6
E256 )4.1 33.3 32.0
Activation of glucokinase by
D-glucose binding J. Molnes et al.
2474 FEBS Journal 275 (2008) 2467–2481 ª 2008 The Authors Journal compilation ª 2008 FEBS
It should be noted that the GK activator (com-
pound A; Fig. 1A) binds to the binary hGKÆGlc com-
plex, but it is not known in what way its binding
perturbs the structure [12].
Discussion
The multiphasic global conformational transition
and the kinetic cooperativity of
D-glucose binding
Based on enzyme kinetic studies [8,9], crystal structure
analyses [12] and real-time ITF spectroscopy
[10,11,22], there appears to be broad agreement that
the catalytic activation of monomeric GK by its sub-
strate Glc can be presented by the equation:
GK þ Glc $
k
1
k
1
GK Glc $
k
2
k
2
GK
Glc ð1AÞ
where GK represents the ligand-free, inactive state of
the enzyme, GK Æ Glc its binary low-activity (low-
affinity) enzyme–substrate complex and GK* Æ Glc the
binary complex of the high-activity (higher affinity)
state of the enzyme in which a relatively slow confor-
mational change (isomerization) has occurred, charac-
teristic of a hysteretic enzyme [13]. In transient kinetic
analyses of the Glc-induced enhancement of ITF with
wild-type hGK [11] and seven activating mutations
[22], a biphasic time course was observed suggesting
two kinetically distinguishable events within the time
scale of 0–5 s. The observed rate constant for the first
phase, k
obs1
, was linearly dependent on the Glc con-
centration, whereas the second-phase rate constant,
k
obs2
, exhibited a hyperbolic dependence on the sub-
strate concentration. The amplitude of the first and
second phase represented approximately 25% and
75%, respectively, of the total fluorescence enhance-
ment of wild-type hGK [11]. Based on these analyses,
it was concluded that the positive cooperativity of GK
observed in enzyme kinetics [8,9] is a kinetic behavior
that is mediated by the Glc-induced conformational
change with intermediate stable states of different
affinity for Glc.
In previous transient kinetic analysis [11], the time
scale was 0–5 s, whereas, in the present study (Fig. 6),
the equilibrium enhancement (DF
eq
⁄ F
0
) of ITF is not
reached until approximately 3 min at 25 °C in wild-
type hGK (and wild-type GST-hGK) and found to be
very temperature dependent (data not shown). This
suggests that more than two discernible consecutive
steps (Eqn. 1A) may accompany Glc recognition and
binding at the active site, a conclusion that is further
supported by the molecular dynamics and targeted
molecular dynamics simulations on the enzyme in its
transition from the fully-closed to the super-open state
[23]. The simulations indicate that the overall confor-
mational transition includes three likely stable interme-
diate states with variable degrees of cleft opening.
Our results provide an additional framework to
understand the Glc-induced enhancement in ITF of
wild-type hGK. First, the W fi F mutation analyses
reveal that all the three tryptophans contribute to the
overall enhancement of ITF induced by Glc, with
major contributions of W99 and W167 (Figs 4 and 5
and supplementary Table S1), both located in highly
flexible loop structures. W99, located in one of the
regions connecting the L- and S-domains, undergoes a
large change in the backbone conformation
[(Du + Dw)of 110°] upon Glc binding, whereas the
corresponding change in the microenvironment is more
uncertain for the buried W167 (residues 157–179 not
assigned in the super-open state). Second, the hGK–
Glc association (K
d
= 4.8 ± 0.1 mm at 25 °C) is dri-
ven by a favourable entropy change (DS = 150 ±
10 JÆmol
)1
ÆK
)1
), which overcomes an unfavourable
enthalpy change (DH
van’t Hoff
=32±3kJÆmol
)1
).
The relatively large positive DS is in keeping with that
an increase in protein dynamics plays a dominant role
in the interaction, with large scale domain movement
and cleft closure (desolvation) as well as changes in
peptide backbone conformation ⁄ side-chain rotameric
states [12]. Finally, the temperature induced ( 1 °Cto
39 °C) reversible quenching of ITF (Fig. 3C) is consis-
tent with a slow conformational isomerization, and the
biphasic time course (t
1 ⁄ 2
11 s and t
1 ⁄ 2
64 s) sug-
gests the presence of a relatively stable intermediate in
the transition. This reversible isomerization (‘thermal
hysteresis’) is reminiscent of the Glc-induced confor-
mational isomerization, and supports the existence of
an equilibrium between conformational substates in
the apo enzyme. Interestingly, recent pre-steady-state
analyses of Glc binding to wild-type hGK [24] have
provided evidence that the substrate-free enzyme in
solution is in a preexisting equilibrium between at least
two conformers (i.e. super-open and closed) which
differ in their affinity for Glc as presented by the
equation:
GK þ Glc $ GK Glc $ GK
Glc
l
GK
þ Glc $ GK
Glc
ð1BÞ
where the binding of Glc shifts the equilibrium
towards the high activity (higher affinity) closed state
of the enzyme (GK*).
In the present study, the time course and equilib-
rium (DF
eq
⁄ DF
0
) fluorescent enhancement induced by
Glc were studied in the absence of MgATP
2)
because
J. Molnes et al. Activation of glucokinase by D-glucose binding
FEBS Journal 275 (2008) 2467–2481 ª 2008 The Authors Journal compilation ª 2008 FEBS 2475
such data are not complicated by turnover conditions
with the formation of glucose 6-phosphate. The possi-
bility, therefore, arises that the ITF responses and the
related structural conformational changes measured
for the GKÆ Glc binary complex may be different in
the GKÆ Glc Æ MgATP ternary complex. The question
was recently addressed by Kim et al. [24] using a non-
hydrolyzable ATP analogue (PNP-AMP). Their tran-
sient kinetic analyses suggested that PNP-AMP may
change the equilibrium between the two proposed GK
conformers (Eqn. 1B), but the accuracy of the experi-
ments was hindered by the low signal amplitude [24].
Therefore, they also studied the equilibrium binding of
PNP-AMP to the enzyme, and reported a relatively
large decrease in fluorescence (DF
eq
⁄ F
0
) which was
interpreted as a nucleotide induced conformational
change. However, because no corrections were made
for the large inner-filter effect due to the significant
absorbance of the nucleotide at the selected excitation
wavelength of 285 nm, further fluorescence analyses in
which proper corrections are made for the inner-filter
effect are required before any conclusions can be
drawn. Additionally, Heredia et al. [11] have per-
formed differential scanning calorimetry of wild-type
hGK and concluded that 10 mm MgATP
2)
, in contrast
to 100 mm Glc, did not have any significant effect on
the Cp
exc
(kcalÆmol
)1
Æ°C
)1
) and thermal midpoint tran-
sition temperature, further supporting the conclusion
that more studies are required to settle the issue of
a possible MgATP
2)
induced conformational change
in GK.
Residues involved in the binding of
D-glucose to
the super-open conformation
The 3D structure has revealed that GK is a typical
two-domain enzyme and, in the unliganded state, the
L- and S-domains are far apart and bisected by a wide
open, solvent-accessible cleft [12]. In the Glc-bound
fully-closed state, the two domains are in close proxim-
ity, and the desolvated ligand is engulfed in the cleft
and held in place by extensive hydrogen-bonding inter-
actions with residues in the L-domain (residues N204,
D205, N231, E256 and E290) and the S-domain (resi-
dues T168 and K169) (Fig. 1B). In the super-open
state, however, these contact residues are too far apart
to simultaneously interact with Glc. Those residues
involved in the first binding of Glc to the super-open
conformation and the subdomain in which the global
conformational transition is initiated have not yet been
experimentally identified.
Our point mutation analysis provides experimental
evidence that Glc binds first to residues in the
L-domain and subsequently (after closure) to residues
in the S-domain. The mutations N204A, D205A and
E256A ⁄ K resulted in enzyme forms that did not bind
Glc at all as measured by ITF, and they were essen-
tially catalytically inactive (Table 2 and supplementary
Fig. S3), whereas N231A gave a DF
eq
⁄ F
0
response of
approximately 6% versus wild-type and no measurable
activity. By contrast, in the mutations of the S-domain
(T168G and K169N), Glc induced a significant
fluorescence enhancement ( 60% and 80% versus
wild-type), and with reduced affinity (Table 2 and
supplementary Fig. S3). In the 3D structure of the
super-open state, residues 204, 205, 231 and 256 dem-
onstrate spatial proximity, with N204, N231 and E256
in the most favourable positions (C
c
-C
c
⁄ C
d
distances
in the range of 5.1–5.4 A
˚
) and side-chain orientations
for a concerted interaction with Glc (Fig. 8B). The
side-chain of D205, suggested to be the triggering tar-
get in Glc binding [12], is, however, in a more unfa-
vourable orientation and forms a salt-bridge with
R447 in helix 17 (Fig. 9). This stabilizing salt-bridge is
broken upon Glc-binding (Fig. 8C), and the side-chain
of D205 is reorientated [the side-chain dihedral angles
change by 117.7° (v
1
) and 16.5° (v
2
)] (Table 3),
whereas the (Du + Dw) value is changed by only 0.3°.
Thus, D205 subsequently interacts with Glc. In the
D205A mutant form, there is no salt bridge, and Ala
does not function as a contact residue, offering an
explaination for the Glc nonbinding effect of the
D205A mutation.
Local torsional stresses induced by Glc binding
and propagation of the conformational transition
From the 3D structures of hGK [12], the overall
molecular motion induced by Glc binding is character-
ized by a complex shear ⁄ sliding and hinge type of
movements, as previously described for the structurally
related hexokinase I [25,26]. The core region (middle
and outer layers) of the S-domain is rotated by
approximately 99° as a rigid body compared to 12° for
hexokinase I. Whereas three regions, connecting the
L- and S-domains, were assigned as hinge regions in
hexokinase I [25] no hinge regions were defined for
hGK [12]. Using the Hinge Master algorithm for pre-
diction of hinge regions in the closed conformation
(PDB identity: 1v4s), the highest score was obtained
for residues in two of the regions connecting the
L- and the S-domains [i.e. in connecting region (CR) I
(residues 62–73) and in CR II (residues 192–204)] and
the crystal structures of the two conformational states
demonstrate large changes in the main-chain torsion
angles of both regions on Glc binding. CR II, which
Activation of glucokinase by D-glucose binding J. Molnes et al.
2476 FEBS Journal 275 (2008) 2467–2481 ª 2008 The Authors Journal compilation ª 2008 FEBS
connects helix 5 (S-domain) and helix 6 (L-domain), is
of particular interest in the present context due to its
connection to the two Glc contact residues N204 and
D205. A torsion angle analysis revealed large changes
in the backbone dihedral angles (Du + Dw) of several
residues in CR II on Glc binding (Fig. 8A), and the
related changes in the backbone conformation are
shown in Fig. 8B,C. The short b8 strand is extended
by three residues, helix 5 and helix 6 are both shortend
by one residue, and the two helices change their rela-
tive orientation consistent with hinge-bending motions.
Thus, the conversion from one backbone conformation
to the other of CR II induces large-scale motions in
the protein.
It should be noted that only minor changes in the
petide backbone conformation were observed in the
regions around the Glc contact residues N231 and
E256 as well as in their side-chain rotameric states
(Table 3).
Stabilizing interactions between helix 6 and
helix 17 in the super-open conformation
In both the super-open and fully-closed states, helix 6
interacts specifically with the C-terminal helix (helix
17 ⁄ 19), which adopts a different length in the super-
open (H17, residues 447–460) and fully-closed (H19,
residues 443–461) state, and their relative orientation
(the crossing angle increases from 15.8° to 75.6°) and
main residue contacts also change noticeably upon Glc
binding (Fig. 8B,C). The changes in the interhelical
interactions point to a major contribution in the
dynamic communication between the L- and
S-domains and thus in the transition from the super-
Residue number
180 190 200 210
–150
–100
–50
0
50
100
150
200
250
A
B
C
CRII (β8)
Dihedral angles
(Δϕ + Δ
ψ)Δ
H6H5
*
*N204 and D205
*
Fig. 8. (A) Torsion angle analysis of residues in helix 5 (H5), CR II and
helix 6 (H6) illustrating the large changes in main-chain torsion angles
which occur at CR II (residues 191–203) upon binding of Glc. The
position of the Glc contact residues N204 and D205 is indicated by an
asterisk. (B, C) Demonstrating the related changes in the backbone
conformation based on the structural coordinates of the super-open
state (PDB identity: 1v4t) and the Glc-bound state (PDB identity:
1v4s), respectively. Also note the interhelical contacts between
helix 6 (D205-Y215) and the C-terminal helix 17 (R447-K460) in the
super-open state. The structure illustrates that the inactive form of
the enzyme is stabilized by two salt bridges, D205ÆÆÆR447 and
E216ÆÆÆK458; not shown are additional pairs of residues (I211 ⁄ Y215
and L451 ⁄ V455) involved in hydrophobic interactions (Fig. 9). The
structural images were generated using
PYMOL, version 0.99.
K458
E216
Y215
D205
R447
I211
L451
V455
H17
H6
Fig. 9. Main interhelical contacts between helix 6 (D205-Y215) and
the C-terminal helix 17 (R447-K460) in the super-open state (1v4t).
The structure illustrates that the apo enzyme is stabilized by two
salt bridges, D205ÆÆÆR447 (closest distance 3.2 A
˚
) and E216ÆÆÆK458
(closest distance 3.4 A
˚
), and pairs of residues (I211 ⁄ Y215 and
L451 ⁄ V455, closest distance £ 3.5 A
˚
) involved in hydrophobic inter-
actions. Interstices shown using all-atom dot surface. The structural
image was generated using
PYMOL, version 0.99.
J. Molnes et al. Activation of glucokinase by
D-glucose binding
FEBS Journal 275 (2008) 2467–2481 ª 2008 The Authors Journal compilation ª 2008 FEBS 2477
open (inactive) to the fully-closed (active) conforma-
tion. The interhelical salt bridges and pairs of residues
involved in hydrophobic interactions (Fig. 9), as spe-
cific structural determinants, stabilize the inactive state
of the enzyme. On binding Glc, this constrained con-
formation relaxes and renders the enzyme more active.
This conclusion is consistent with the targeted molecu-
lar dynamics simulations [23] demonstrating that the
‘release’ of the C-terminal helix from the S-domain is a
final event in the conformational transition from the
fully-closed to the super-open state. To date, 11 acti-
vating mutations in hGK have been identified [27–29].
Two of these (Y214C and Y215A) are localized in
helix 6 and three (V455M, A456V and A460R) in
helix 17, and some of these missense mutations (e.g.
Y215A and V455M) perturb the hydrophobic interac-
tions between the two helices that normally stabilize
the inactive enzyme conformation. The activating
mutations result in a variably enhanced affinity for
Glc and increased V
max
[27,28]. Finally, hGK is allos-
terically activated by free polyubiquitin chains assigned
to their equilibrium binding to the ubiquitin-interact-
ing motif (UIM) at helix 17, and the approximately
1.4-fold increase in V
max
and slightly increased affinity
for Glc [30] may be explained by a destabilization of
the interaction between this helix and helix 6. More-
over, deletion of the C-terminal helix results in a cata-
lytically completely inactive enzyme [30].
Two of the substitutions studied (K169N and
E256K) are naturally occurring mutations in the GCK
gene associated with familial, mild fasting hyperglyce-
mia (MODY2), and the information provided by the
present study is expected to represent a valuable refer-
ence for further studies on specific mutations in the
GCK gene in which the molecular mechanism of the
hyperglycemia is not yet understood [27].
Experimental procedures
Materials
The QuickChange
Ò
XL Site-Directed Mutagenesis Kit was
obtained from Stratagene (La Jolla, CA, USA). The Big
Dye
Ò
terminator v1.1 cycle sequencing kit used to prepare
DNA for automated sequencing was provided by Applied
Biosystems (Foster City, CA, USA). The oligonucleotide
primers used for site-directed mutagenesis and sequencing
were obtained from Invitrogen (Carlsbad, CA, USA). The
restriction protease factor Xa was obtained from Protein
Engineering Technology ApS (Aarhus, Denmark). Glutathi-
one SepharoseÒ 4B and SephadexÔ G-25 were purchased
from Amersham Biosciences (GE Healthcare Europe
GMBH, Oslo, Norway). Glc was purchased from
Calbiochem (San Diego, CA, USA). GST, glucose 6-phos-
phate dehydrogenase, b-nicotinamide adenine dinucleotide,
guanidium hydrochloride, ATP, dithiothreitol and magne-
sium chloride were obtained from Sigma-Aldrich (St Louis,
MO, USA). MH was obtained from Glycoteam GmbH
(Hamburg, Germany). The Centricon centrifugal filter unit
was obtained from Millipore (Bedford, MA, USA). All
chemicals and buffers used for fluorescence measurements
were of the highest grade available.
Site-directed mutagenesis
The mutations W99F, W167F, W257F, T168G, K169N,
N204A, D205A, N231A, E256A ⁄ K, Q287V and E290A
were introduced into the wild-type hGK (isoform1)
cDNA using the QuikChange
Ò
XL Site-Directed Muta-
genesis Kit and the specific oligonucleotide primers listed
in supplementary Table S2. The pGEX-3X vector (kindly
provided by F. M. Matschinsky, University of Pennsylva-
nia, USA), containing the restriction protease factor Xa
cleavage site, was used as the template host. DNA
sequencing was used to verify the introduction of the
desired mutations.
Expression and purification of recombinant hGK
The wild-type and mutant forms of hGK isoform 1 were
expressed as GST fusion proteins. Expression in Escherichi-
a coli (BL21) cells at 28 °C and purification of proteins by
glutathione Sepharose 4B affinity chromatography were
performed as previously reported ( 10 mg of soluble pro-
tein per 1 L of culture for the wild-type and 5–10 mg for
the mutant forms) [30]. Wild-type hGK and selected mutant
forms were further purified by removing the GST fusion
protein after cleavage for 2 h at 4 °C by factor Xa at a pro-
tease to substrate ratio of 1 : 25 (by mass). Glutathione
and salts were removed by size exclusion chromatography
(Sephadex G-25), followed by glutathione Sepharose 4B
affinity chromatography to retain free GST and any unc-
leaved GST-hGK. All purification steps were performed at
4 °C in the presence of 5 mm dithiothreitol. The proteins
were concentrated, aliquoted and stored in liquid nitrogen.
The recombinant proteins were isolated to a purity of
> 98% (SDS ⁄ PAGE) for both GST-hGK and hGK, with
an expected molecular mass of 76 kDa and 50 kDa, respec-
tively, as previously described for wild-type hGK [30].
Protein concentrations were determined using A
280
(1 mgÆmL
)1
Æcm
)1
) of 1.05 for the wild-type GST-hGK,
determined according to the method of Gill and von Hippel
[31] in 0.02 m phosphate buffer (pH 6.5) with or without
6 m guanidium hydrochloride. For the mutants W99F,
W167F and W257F GST-hGK, A
280
(1 mgÆmL
)1
) of 0.97
was used. For the isolated wild-type protein (without fusion
partner), A
280
of 0.65 was used whereas, for the isolated
Trp mutants, A
280
of 0.54 was used.
Activation of glucokinase by D-glucose binding J. Molnes et al.
2478 FEBS Journal 275 (2008) 2467–2481 ª 2008 The Authors Journal compilation ª 2008 FEBS
Enzymatic assays
The catalytic activity of GK was measured spectrophotomet-
rically (A
340nm
)at37°C by a glucose 6-phosphate dehydro-
genase coupled assay in a reaction mixture (1 mL) containing
25 mm Hepes (pH 7.4), 25 mm KCl, 7.5 mm MgCl
2
,5mm
dithiothreitol, 0.1% (w ⁄ v) BSA, 5 mm ATP, 1.0 mm NAD
+
,
0.35 U glucose 6-phosphate dehydrogenase and varying con-
centrations of Glc. The reaction was initiated by 0.5 lgof
hGK (pre-incubated with Glc and 5 mm dithiothreitol for
10 min); for mutants with reduced activity, the amount of
protein was correspondingly increased (up to 200-fold).
Reaction rates were calculated from linear regression of the
change in A
340nm
. To determine the kinetic variables, 12–15
dilutions of Glc (0–200 mm) were used but, when analysing
very low-affinity active site mutants, the concentration range
was 0–1600 mm Glc. Nonlinear regression analyses of the
experimental data using the Hill equation were applied to
calculate the [S]
0.5
value for Glc and n
H
.
Intrinsic tryptophan fluorescence measurements
Fluorescence measurements were performed on a Perkin-
Elmer LS-50B instrument (1 cm path-length quartz cell
with maximal stirring; Perkin-Elmer, Waltham, MA, USA)
at 25 °C (constant temperature cell holder) in a buffer con-
taining 20 mm Hepes, 100 mm NaCl and 1 mm dithiothrei-
tol (pH 7). The steady-state emission spectra were recorded
from 305–500 nm with a fixed excitation wavelength of
295 nm, slit widths for excitation and emission of 3 and
7 nm, respectively, and by averaging four scans. To dena-
ture hGK, the protein was incubated with 6 m guanidium
hydrochloride overnight. To study the effect of substrate
(Glc) and substrate analogue (MH), the change in fluores-
cence intensity (DF
eq
⁄ F
0
values at k
max
) was measured as a
function of the concentration of added ligand. A concentra-
tion range of 0–600 mm Glc and 0–40 mm MH was used in
the titrations. The observed fluorescence was corrected for
background emission (< 5%) and dilutions due to ligand
addition, which in most cases did not exceed 10%. Nonlin-
ear regression analysis of the data (the response ⁄ binding
isotherm) was performed using sigmaplot technical
graphing Software (Systat Software Inc., San Jose, CA,
USA) and the equation:
DF
eq
=F
0
¼ðDF
eq
=F
0
Þ
max
½S=ðK
d
þ½SÞ ð2Þ
where F
0
is the fluorescence baseline value, DF
eq
is the equi-
librium fluorescence response, [S] is the ligand concentra-
tion and K
d
is the equilibrium dissociation constant defined
as the ligand concentration of half maximal increase in
fluorescence intensity.
Temperature-induced changes in ITF were followed in
the range 7–37 °C. The sample temperature was controlled
by a thermistor (ETI 2002; Electronic Temperature Instru-
ments Ltd., Worthing, UK) with an accuracy of ± 0.2 °C,
and the cell compartment was flushed with N
2
. The time
course for the Glc-induced fluorescence enhancement
(DF
eq
⁄ F
0
) was followed with excitation and emission slit
widths of 4 and 7 nm, respectively. To determine the
enthalpy and entropy change of the hGK-Glc interaction,
the apparent equilibrium dissociation constant (K
d
) was
measured at six different temperatures, in the range 7–
32 °C at approximately 5 °C intervals. Van’t Hoff analysis
was carried out assuming that DH and DS of the hGK-Glc
interaction vary negligibly with temperature, using the
equation:
ln K
d
¼ DH
van
0
t Hoff
=RT DS=R ð3Þ
where R is the universal gas constant (8.31 JÆmol
)1
ÆK
)1
)
and T is the absolute temperature in kelvin.
CD spectroscopy
Far-UV CD spectra (185–260 nm, light path 1 mm) were
recorded at 25 ° C on a Jasco J-810 spectropolarimeter
equipped with a Peltier element for temperature control.
The isolated wild-type and W167F proteins were diluted in
a20mm sodium phosphate buffer (pH 7) to a final concen-
tration of 15 lm. Each spectrum obtained was an average
of four scans at a scan rate of 50 nmÆmin
)1
. The resultant
spectra were background-corrected and smoothed. The sec-
ondary structure elements of the proteins were evaluated by
the CD Neural Network algorithm [32]. The global confor-
mational stability, as measured by thermal denaturation
(5–90 °C), was determined by measuring the change in ellip-
ticity at 222 nm at a constant scanning rate of 40 °CÆh
)1
. The
apparent transition temperature (T
m
) was determined from
the first derivative of the smoothed denaturation curve.
Structural analyses
In the present study, the MolMovDB of The Yale Morph
Server ( [33,34]
was used to demonstrate the regions of variable secondary
structure in the two determined crystal structures of hGK
[12]. Seventeen helices were identified in the ligand-free
super-open structure (PDB identity: 1v4t) versus 19 helices
in the Glc and allosteric activator compound A bound
fully-closed structure (PDB identity: 1v4s); H17 (residues
447–460) fi H19 (residues 443–461) (http://molmovdb.
mbb.yale.edu/cgi-bin/morph.cgi?ID=496337–23316). The
Molmovdb was also used to predict hinge regions (Hinge
Master algorithm) and to calculate the changes in the back-
bone dihedral torsion angles (Du + Dw) for selected
motifs ⁄ residues upon binding of Glc based on the coordi-
nates of the unliganded and the liganded form. Helix–helix
interactions in the two conformational states were analysed
as described previously [35]. The static solvent accessibility
of individual residues in the two conformational states was
J. Molnes et al. Activation of glucokinase by D-glucose binding
FEBS Journal 275 (2008) 2467–2481 ª 2008 The Authors Journal compilation ª 2008 FEBS 2479
calculated using an algorithm described previously [16].
Global motion analysis of the two conformational states
was performed with the GNM [20,21]. sigmaplot graphi-
cal software was used to visualize the GNM output
files for all residues. Structural images were generated
using pymol, version 0.99 ().
Acknowledgements
This work was supported by Helse Vest, Haukeland
University Hospital, the Norwegian Research Council,
the Novo Nordisk Foundation, the Norwegian Diabe-
tes Association, the University of Bergen, and the
Meltzer Foundation. We thank Anita-Merete Nordbø
for expert technical assistance, Ali Sepulveda Muno
˜
z
for French press preparation of recombinant enzyme
and Ingvild Aukrust and Joa
˜
o Barroso for introduc-
tion to the methods of CD and ITF spectroscopy,
respectively.
References
1 Nishi S, Stoffel M, Xiang K, Shows TB, Bell GI &
Takeda J (1992) Human pancreatic beta-cell glucoki-
nase: cDNA sequence and localization of the polymor-
phic gene to chromosome 7, band p 13. Diabetologia
35, 743–747.
2 Matschinsky FM (2002) Regulation of pancreatic beta-
cell glucokinase: from basics to therapeutics. Diabetes
51(Suppl. 3), S394–S404.
3 Tanizawa Y, Koranyi LI, Welling CM & Permutt
MA (1991) Human liver glucokinase gene: cloning
and sequence determination of two alternatively
spliced cDNAs. Proc Natl Acad Sci U S A 88, 7294–
7297.
4 Hughes SD, Quaade C, Milburn JL, Cassidy L &
Newgard CB (1991) Expression of normal and novel
glucokinase mRNAs in anterior pituitary and islet cells.
J Biol Chem 266, 4521–4530.
5 Gloyn AL (2003) Glucokinase (GCK) mutations in
hyper- and hypoglycemia: maturity-onset diabetes of
the young, permanent neonatal diabetes, and
hyperinsulinemia of infancy. Hum Mutat 22, 353–
362.
6 Njølstad PR, Sagen JV, Bjørkhaug L, Odili S, Shehadeh
N, Bakry D, Sarici SU, Alpay F, Molnes J, Molven A
et al. (2003) Permanent neonatal diabetes caused by glu-
cokinase deficiency: inborn error of the glucose-insulin
signaling pathway. Diabetes 52, 2854–2860.
7 Njølstad PR, Søvik O, Cuesta-Munoz A, Bjørkhaug L,
Massa O, Barbetti F, Undlien DE, Shiota C, Magnuson
MA, Molven A et al. (2001) Neonatal diabetes mellitus
due to complete glucokinase deficiency. N Engl J Med
344, 1588–1592.
8 Cornish-Bowden A & Storer AC (1986) Mechanistic
origin of the sigmoidal rate behaviour of rat liver hexo-
kinase D (‘glucokinase’). Biochem J 240, 293–296.
9 Storer AC & Cornish-Bowden A (1977) Kinetic evi-
dence for a ‘mnemonical’ mechanism for rat liver gluco-
kinase. Biochem J 165, 61–69.
10 Lin SX & Neet KE (1990) Demonstration of a slow
conformational change in liver glucokinase by fluores-
cence spectroscopy. J Biol Chem 265, 9670–9675.
11 Heredia VV, Thomson J, Nettleton D & Sun S (2006)
Glucose-induced conformational changes in glucokinase
mediate allosteric regulation: transient kinetic analysis.
Biochemistry 45, 7553–7562.
12 Kamata K, Mitsuya M, Nishimura T, Eiki J & Nagata
Y (2004) Structural basis for allosteric regulation of the
monomeric allosteric enzyme human glucokinase. Struc-
ture 12, 429–438.
13 Frieden C (1970) Kinetic aspects of regulation of meta-
bolic processes. The hysteretic enzyme concept. J Biol
Chem 245, 5788–5799.
14 Davis EA, Cuesta-Munoz A, Raoul M, Buettger C,
Sweet I, Moates M, Magnuson MA & Matschinsky
FM (1999) Mutants of glucokinase cause hypoglyca-
emia- and hyperglycaemia syndromes and their analysis
illuminates fundamental quantitative concepts of glu-
cose homeostasis. Diabetologia 42, 1175–1186.
15 Liang Y, Kesavan P, Wang LQ, Niswender K, Taniza-
wa Y, Permutt MA, Magnuson MA & Matschinsky
FM (1995) Variable effects of maturity-onset-diabetes-
of-youth (MODY)-associated glucokinase mutations on
substrate interactions and stability of the enzyme.
Biochem J 309, 167–173.
16 Parthiban V, Gromiha MM & Schomburg D (2006)
CUPSAT: prediction of protein stability upon point
mutations. Nucleic Acids Res 34, W239–W242.
17 Moukil MA & Van Schaftingen E (2001) Analysis of
the cooperativity of human beta-cell glucokinase
through the stimulatory effect of glucose on fructose
phosphorylation. J Biol Chem 276, 3872–3878.
18 Moukil MA, Veiga-da-Cunha M & Van Schaftingen E
(2000) Study of the regulatory properties of glucokinase
by site-directed mutagenesis: conversion of glucokinase
to an enzyme with high affinity for glucose. Diabetes
49, 195–201.
19 Brocklehurst KJ, Payne VA, Davies RA, Carroll D,
Vertigan HL, Wightman HJ, Aiston S, Waddell ID,
Leighton B, Coghlan MP et al. (2004) Stimulation of
hepatocyte glucose metabolism by novel small molecule
glucokinase activators. Diabetes 53, 535–541.
20 Yang LW & Bahar I (2005) Coupling between catalytic
site and collective dynamics: a requirement for mecha-
nochemical activity of enzymes. Structure 13, 893–904.
21 Yang LW, Rader AJ, Liu X, Jursa CJ, Chen SC,
Karimi HA & Bahar I (2006) oGNM: online computa-
Activation of glucokinase by D-glucose binding J. Molnes et al.
2480 FEBS Journal 275 (2008) 2467–2481 ª 2008 The Authors Journal compilation ª 2008 FEBS
tion of structural dynamics using the Gaussian Network
Model. Nucleic Acids Res 34, W24–W31.
22 Heredia VV, Carlson TJ, Garcia E & Sun S (2006) Bio-
chemical basis of glucokinase activation and the regula-
tion by glucokinase regulatory protein in naturally
occuring mutations. J Biol Chem 281, 40201–40207.
23 Zhang J, Li C, Chen K, Zhu W, Shen X & Jiang H
(2006) Conformational transition pathway in the allo-
steric process of human glucokinase. Proc Natl Acad
Sci U S A 103, 13368–13373.
24 Kim YB, Kalinowski SS & Marcinkeviciene J (2007) A
pre-steady state analysis of ligand binding to human
glucokinase: evidence for a preexisting equilibrium.
Biochemistry 46, 1423–1431.
25 Aleshin AE, Zeng C, Bartunik HD, Fromm HJ &
Honzatko RB (1998) Regulation of hexokinase I:
crystal structure of recombinant human brain
hexokinase complexed with glucose and phosphate.
J Mol Biol 282, 345–357.
26 Gerstein M, Lesk AM & Chothia C (1994) Structural
mechanisms for domain movements in proteins.
Biochemistry 33, 6739–6749.
27 Matschinsky FM, Magnuson MA, Zelent D, Jetton TL,
Doliba N, Han Y, Taub R & Grimsby J (2006) The
network of glucokinase-expressing cells in glucose
homeostasis and the potential of glucokinase activators
for diabetes therapy. Diabetes 55, 1–12.
28 Pedelini L, Garcia-Gimeno MA, Marina A, Gomez-
Zumaquero JM, Rodriguez-Bada P, Lopez-Enriquez S,
Soriguer FC, Cuesta-Munoz AL & Sanz P (2005)
Structure-function analysis of the alpha5 and the
alpha13 helices of human glucokinase: description of
two novel activating mutations. Protein Sci 14, 2080–
2086.
29 Wabitsch M, Lahr G, Van de Bunt M, Marchant C,
Lindner M, von Puttkamer J, Fenneberg A, Debatin
KM, Klein R, Ellard S et al. (2007) Heterogeneity in
disease severity in a family with a novel G68V GCK
activating mutation causing persistent hyperinsulinaemic
hypoglycaemia of infancy. Diabet Med 24, 1393–1399.
30 Bjørkhaug L, Molnes J, Søvik O, Njølstad PR &
Flatmark T (2007) Allosteric activation of human
glucokinase by free polyubiquitin chains and its
ubiquitin-dependent cotranslational proteasomal
degradation. J Biol Chem 282, 22757–22764.
31 Gill SC & von Hippel PH (1989) Calculation of protein
extinction coefficients from amino acid sequence data.
Anal Biochem 182, 319–326.
32 Bohm G, Muhr R & Jaenicke R (1992) Quantitative
analysis of protein far UV circular dichroism spectra by
neural networks. Protein Eng 5, 191–195.
33 Gerstein M & Krebs W (1998) A database of macromo-
lecular motions. Nucleic Acids Res 26, 4280–4290.
34 Krebs WG & Gerstein M (2000) The morph server: a
standardized system for analyzing and visualizing mac-
romolecular motions in a database framework. Nucleic
Acids Res 28, 1665–1675.
35 Burba AE, Lehnert U, Yu EZ & Gerstein M (2006)
Helix Interaction Tool (HIT): a web-based tool for
analysis of helix-helix interactions in proteins. Bioinfor-
matics 22, 2735–2738.
Supplementary material
The following supplementary material is available
online:
Fig. S1. The time course for the d-glucose-induced flu-
orescence enhancement of wild-type hGK and its
W fi F mutant forms.
Fig. S2. Equilibrium binding of MH.
Fig. S3. The ‘catalytic efficiency’ and the total Glc-
induced fluorescence change of the active site mutants
(fusion proteins).
Table S1. Response of 200 mm glucose on intrinsic
tryptophan fluorescence and catalytic activity of wild-
type GST-hGK and W fi F mutant forms.
Table S2. Oligonucleotides used for PCR-based muta-
genesis.
This material is available as part of the online article
from
Please note: Blackwell Publishing are not responsible
for the content or functionality of any supplementary
materials supplied by the authors. Any queries (other
than missing material) should be directed to the corre-
sponding author for the article.
J. Molnes et al. Activation of glucokinase by D-glucose binding
FEBS Journal 275 (2008) 2467–2481 ª 2008 The Authors Journal compilation ª 2008 FEBS 2481