Báo cáo khoa học: Expression and purification of orphan cytochrome P450 4X1 and oxidation of anandamide pdf
Bạn đang xem bản rút gọn của tài liệu. Xem và tải ngay bản đầy đủ của tài liệu tại đây (792.51 KB, 12 trang )
Expression and purification of orphan cytochrome
P450 4X1 and oxidation of anandamide
Katarina Stark*, Miroslav Dostalek and F. P. Guengerich
Department of Biochemistry and Center in Molecular Toxicology, Vanderbilt University School of Medicine, Nashville, TN, USA
Cytochrome P450 (P450, EC 1.14.14.1, also termed
‘heme thiolate P450’) [1] monooxygenases are involved
in tissue-specific conversions of many naturally occur-
ring substances, for example, vitamins, hormones and
signaling molecules, including the diverse group of the
so-called eicosanoids [2]. P450 families 1–3 are primar-
ily involved in the metabolism of therapeutic drugs
and other xenobiotic chemicals, whereas families 4–51
consist of enzymes involved in the endogenous metab-
olism of important biological compounds, for example,
steroids, fatty acids, vitamins and eicosanoids [3]. P450
subfamily 4F members are known to primarily oxidize
endogenous compounds, for example, fatty acids and
arachidonic acid derivatives [4]. The primary site of
P450 metabolism is the liver, and the amount of P450
found in brain is relatively low, ranging from 1 to
10% of that found in liver [3]. P450 metabolism of
fatty acids may be of importance in brain, as neuro-
transmitters and fatty acids are oxidized by P450s
[4,5].
Arachidonic acid derivatives have been implicated
in a large number of physiologically important
processes. The arachidonic acid derivative anandamide
(arachidonoyl ethanolamide) is a natural endocannabi-
Keywords
anandamide; brain; cytochrome P450;
heterologous expression; mRNA localization
Correspondence
F. P. Guengerich, Department of
Biochemistry and Center in Molecular
Toxicology, Vanderbilt University School of
Medicine, 638 Robinson Research Building,
2200 Pierce Avenue, Nashville,
TN 37232-0146, USA
Fax: +1 615 322 3141
Tel: +1 615 322 2261
E-mail:
*Present address
Experimental Asthma and Allergy Research,
The National Institute of Environmental
Medicine, Karolinska Institute, Stockholm,
Sweden
(Received 2 April 2008, revised 5 May 2008,
accepted 22 May 2008)
doi:10.1111/j.1742-4658.2008.06518.x
Cytochrome P450 (P450) 4X1 is one of the so-called ‘orphan’ P450s with-
out an assigned biological function. Codon-optimized P450 4X1 and a
number of N-terminal modified sequences were expressed in Escherichia
coli. Native P450 4X1 showed a characteristic P450 spectrum but low
expression in E. coli DH5a cells (< 100 nmol P450ÆL
)1
). The highest level
of expression (300–450 nmol P450ÆL
)1
culture) was achieved with a bicis-
tronic P450 4X1 construct (N-terminal MAKKTSSKGKL, change of E2A,
amino acids 3-44 truncated). Anandamide (arachidonoyl ethanolamide) has
emerged as an important signaling molecule in the neurovascular cascade.
Recombinant P450 4X1 protein, co-expressed with human NADPH–P450
reductase in E. coli , was found to convert the natural endocannabinoid
anandamide to a single monooxygenated product, 14,15-epoxyeicosatrie-
noic (EET) ethanolamide. A stable anandamide analog (CD-25) was also
converted to a monooxygenated product. Arachidonic acid was oxidized
more slowly to 14,15- and 8,9-EETs but only in the presence of cyto-
chrome b
5
. Other fatty acids were investigated as putative substrates but
showed only little or minor oxidation. Real-time PCR analysis demon-
strated extrahepatic mRNA expression, including several human brain
structures (cerebellum, amygdala and basal ganglia), in addition to expres-
sion in human heart, liver, prostate and breast. The highest mRNA expres-
sion levels were detected in amygdala and skin. The ability of P450 4X1 to
generate anandamide derivatives and the mRNA distribution pattern sug-
gest a potential role for P450 4X1 in anandamide signaling in the brain.
Abbreviations
CB-25, N-cyclopropyl-11-(3-hydroxy-5-pentylphenoxy)-undecanamide; CB-52, N-cyclopropyl-11-(2-hydroxy-5-pentylphenoxy)-undecanamide;
EET, eicosatrienoic; GAPDH, glyceraldehyde 3-phosphate dehydrogenase; HETE, hydroxyeicosatetraenoic acid; P450, cytochrome P450;
PPAR, peroxisome proliferator activated receptor.
3706 FEBS Journal 275 (2008) 3706–3717 ª 2008 The Authors Journal compilation ª 2008 FEBS
noid found in most human tissues, and acts as an
important signaling mediator in neurological and
other physiological functions [6,7]. Anandamide was
originally found in human brain, binding to the canna-
binoid receptor CB
1
, and is believed to elicit canna-
binoid-like pharmacological activity, i.e. nociception
and hypomotility, with a 30-fold higher affinity in the
brain than in the periphery [7,8]. 2-Arachidonoyl glyc-
erol is another natural endogenous endocannabinoid
[9]. Unlike 2-arachidonoyl glycerol, the naturally
occurring level of anandamide is relatively low in the
central nervous system. When administrated as a drug,
anandamide elicits pharmacological effects mimicking
the effects of D
9
-tetrahydrocannabinol, the active com-
ponent of marijuana (Cannabis sativa L.) [10]. Ananda-
mide has recently been shown to be oxidized by P450s
in mouse liver and brain microsomes [6] and human
liver and kidney microsomes [11], forming a number
of P450-derived hydroxyeicosatrienoic (HETE) and
epoxyeicosatrienoic (EET) ethanolamides in the latter
case.
At least a quarter of the 57 known human P450
(CYP) genes ( />P450.html) remain ‘orphans’, based on the terminology
used for receptors and other proteins without known
ligands. The largest number of orphans is found within
P450 family 4 which consists of six human subfamilies:
4A, 4B, 4F and the recently discovered 4X, 4V and 4Z
[3,12].
Human P450 4X1 (NM_178033.1) is located on
chromosome 1p33 () close
to P450s 4Z1, 4Z2P, 4A11, 4A22 and 4B1. The gene
has 12 exons and the predicted protein has 509 amino
acids. Homologous genes have been found in several
mammalian species, including rat (70% amino acid
similarity), mouse (71%) and dog (75%) (http://
www.ensembl.org). Rat P450 4X1 was originally
cloned using RT-PCR and found to be specifically
expressed in several brain regions (e.g. brainstem, hip-
pocampus, cortex and cerebellum) as well as in vascu-
lar endothelial cells [13]. The mouse ortholog,
P450 4x1, has been proposed to be a major brain
P450, with protein localization demonstrated primar-
ily in brain neurons, choroidal epithelial cells and
vascular endothelial cells [14]. Human P450 4X1
mRNA has been reported in kidney, brain, heart and
liver [15,16]. Expression was detected in brain by
expressed sequence tag analysis and in aorta by
mRNA blotting. However, no quantitation of the
mRNA expression of P450 4X1 in tissues has been
reported. A major limitation of these studies has been
that no heterologous expression system has been pub-
lished to date, and no catalytic activity has been
reported in order to establish a putative physiological
function.
We report the expression and purification of an
N-terminal modified codon-optimized version of
P450 4X1 in Escherichia coli. Recombinant P450 4X1
oxidized anandamide rather specifically to the
14,15-EET ethanolamide derivative, at a slow rate.
Arachidonic acid formed trace amounts of 14,15- and
8,9-EETs but only in the presence of cytochrome b
5
as
an auxiliary factor. The rates of oxidation of a number
of other arachidonic acid derivatives, neurosteroids
(e.g. dopamine and tyramine) and common drugs (e.g.
loratadine and clotrimazole) were below the limits of
detection. Quantitative PCR indicated highest levels of
P450 4X1 mRNA in brain regions and skin. The
oxidation of anandamide (and a stable analog of
anandamide and D
9
-tetrahydrocannabinol), although
slow, suggests a potential role for P450 4X1 in neuro-
vascular function in human brain.
Results
Synthesis of codon-optimized P450 4X1 cDNA
A cDNA was prepared for heterologous expression
using polymerase chain assembly with 63 overlapping
oligonucleotides (supplementary Table S1). The
sequence was codon-optimized for heterologous E. coli
expression, a protocol previously used in this labora-
tory for successful expression of other P450s [17,18]. A
product with a perfect P450 4X1 sequence was used
for further studies and expression. The P450 4X1 insert
was also integrated into a bicistronic vector (conta-
ining the cDNA for human NADPH-P450 reductase,
EC 1.6.2.4) [19].
Expression of N-terminal variants
The alignment of the codon-optimized P450 4X1
sequence was compared to the native P450 4X1
sequence reported in the NCBI database (NM_178033)
(Fig. 1). The modifications introduced at the N-termi-
nus were based on alignments with close P450 family
members. For P450 family 4 enzymes, most heterolo-
gous expression work to date has been performed in
yeast, and a limited amount of information about
E. coli expression is available. In the case of P450 4B1
[20], the best expression was achieved with a sequence
adapted from bovine P450 17A1 [21] in front of the
third codon (corresponding to P450 4X1 construct 2)
(Table 1). In order to optimize expression levels, the
first 45 amino acids were truncated based on predic-
tions from the program sopma (Poˆ le Informatique
K. Stark et al. P450 4X1 and anandamide oxidation
FEBS Journal 275 (2008) 3706–3717 ª 2008 The Authors Journal compilation ª 2008 FEBS 3707
Lyonnais, ) which indicated the
presence of two a-helix structures in the N-terminal
part of the protein (1–11 and 15–44). N-Terminal-
modified P450 4X1 constructs 3 and 4 (Table 1) were
based on modifications previously used for rabbit
P450 2C3 [22] and rat P450 2C11 [23]. Both constructs
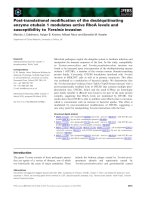
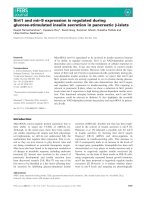
Fig. 1. Optimizations introduced into the P450 4X1 cDNA for E. coli expression. Upper line, predicted amino acid sequence; middle line,
nucleotide sequence predicted from genomic sequence; lower line, nucleotide sequence optimized for E. coli expression.
Table 1. N-Terminal modifications used for heterologous expression of P450 4X1 membranes in E. coli [18] (supplementary Fig. S2). Amino
acid changes are in italics and underlined.
Construct Basis of N-terminal selection N-terminal amino acid sequence
P450 4X1 Native (with E2A change) M
AFSWLETRWARPFYYLAFVFCLALGLLQAIKLYRRQRLLRDLRPFPAPP
P450 4X1 1 Bovine P50 17A1, truncated
MALLLAVFLPFPAPP
P450 4X1 2 Bovine P450 17A1
MALLLAVFSWLETRWARPFYYLAFVFCLALGLLQAIKLYRRQRLLRDLRPFPAPP
P450 4X1 3 Modified rabbit 2C3, truncated
MAKKTSSKGKLPFPAPP
P450 4X1 4 Rat P450 2C11
MARQSFGRGKLPFPAPP
P450 4X1 and anandamide oxidation K. Stark et al.
3708 FEBS Journal 275 (2008) 3706–3717 ª 2008 The Authors Journal compilation ª 2008 FEBS
have sequences truncated before the well-conserved
praline-rich region found at amino acid residues 44–50.
P450 4X1 construct 1 used the bovine P450 17A1
sequence [21] along with a D2–44 truncation (supple-
mentary Table S2 and supplementary Figs S1 and S2).
The levels of expression of native and N-terminally
modified monocistronic P450 4X1 constructs were ini-
tially very modest in E. coli DH5a cells. For the native
monocistronic P450 4X1 construct, the normal expres-
sion level was > 100 nmol P450ÆL
)1
, with the highest
level of expression 200 nmol P450ÆL
)1
; however the
apparent P450 : cytochrome P420 ratio was 1:20
and the weak P450 spectral peak was shifted (to
455 nm). We considered numerous changes to improve
the ratio of P450 to cytochrome P420. A similar pat-
tern was found for the four N-terminal modifications,
with expression levels of 25 nmol P450ÆL
)1
(30 °C,
48 h); at 24 h only P450 4X1 construct 2 showed
expression (60 nmol P450ÆL
)1
). Expression trials with
P450 4X1 constructs 1–4 (Table 1) were also carried
out, using these constructs with co-expression of the
molecular chaperones pGroES ⁄ EL12 in E. coli DH5a
(induced by arabinose, 4 mgÆmL
)1
); in this case,
P450 4X1 construct 1 showed an expression level of
150 nmol P450ÆL
)1
and the remainder yielded
< 25 nmolÆ L
)1
(detection limit).
The inserts were moved into a bicistronic vector
(containing human NADPH-P450 reductase). Expres-
sion trials were carried out using these constructs with
and without co-expression of the molecular chaperones
pGroES ⁄ EL12 in E. coli DH5a under different condi-
tions of temperature and time. In E. coli DH5a cells none
of these constructs expressed > 25 nmol P450ÆL
)1
,
whereas with co-expression of the molecular chaper-
ones pGroES ⁄ EL12 in E. coli DH5a the expression
levels of P450 4X1 construct 3 were considerably
better. The optimal expression temperature for
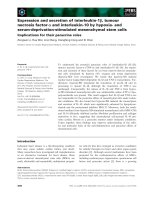
construct 3 was found to be 28 °C and a strong P450
peak was detected (Fig. 2A) 17–21 h following induc-
tion (150–450 nmol P450ÆL
)1
), with expression levels
then decreasing with time to < 70 nmol P450ÆL
)1
after
48 h. The D
600
at the time of induction proved to very
important, because almost no expression was detected
if the value was much lower or higher than 0.5.
Purification of P450 4X1
Solubilization of the bicistronic P450 4X1 membranes
was achieved in the presence of 1% Chaps (w ⁄ v)
(Fig. 2B) and purification was performed using a
Ni-nitrilotriacetic acid column (elution with imidazole,
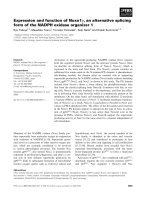
39% yield) (Fig. 2C). Purified P450 4X1 (Fig. 3) was
found to aggregate (in the first trial, after removal of
detergent and KCl and lowering the ionic strength to
100 mm); therefore, subsequent dialysis utilized a final
storage buffer of 200 mm potassium phosphate buffer
(containing 1 mm EDTA and 20% glycerol, v ⁄ v),
which appeared to prevent aggregation.
Real-time quantitative PCR analysis of P450 4X1
In order to investigate the quantitative tissue distri-
bution pattern of P450 4X1 in human tissues, real-time
PCR was used to compare the mRNA levels of
P450 4X1 expression with an internal housekeeping
gene, glyceraldehyde 3-phosphate dehydrogenase
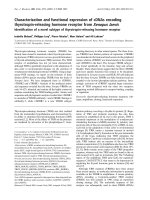
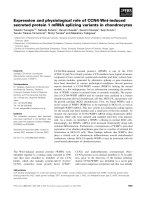
(GAPDH). For graphic representation (Fig. 4) the
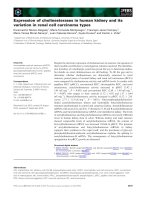
Fig. 2. Fe
2+
-CO versus Fe
2+
difference spectra. (A) P450 4X1 con-
struct 3 expression was performed in E. coli (with pGroES ⁄ EL12).
The spectrum was recorded using 1 ⁄ 2 dilutions of whole-cell
extracts and reducing with Na
2
S
2
O
4
. (B) Solubilized P450 4X1
(1.5 l
M). (C) Difference spectrum of purified P450 4X1 (0.14 lM).
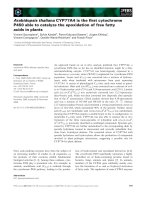
50 kDa
75 kDa
M
r
standards
P450 4X1 (purified)
Fig. 3. SDS ⁄ PAGE of purified recombinant P450 4X1. Lane 1, M
r
markers; lane 2, purified P450 4X1 (4 pmol).
K. Stark et al. P450 4X1 and anandamide oxidation
FEBS Journal 275 (2008) 3706–3717 ª 2008 The Authors Journal compilation ª 2008 FEBS 3709
results of the panels have been normalized to human
adult liver (at 100), and all the other values are com-
pared with adult liver. The expression level in adult
heart is two- to threefold higher than in adult liver,
and the mRNA levels in kidney, colon, breast and fetal
liver and aorta were six- and tenfold higher than in
adult liver. The highest levels were detected in prostate,
skin and particularly amygdala. Whole-brain levels
were two- to threefold higher than in liver, cerebellum
was threefold higher and amygdala was 20-fold higher
(Fig. 4). However, the caveat should be added that all
of the adult mRNA samples were from single donors
(the fetal samples were from a pool of five individuals)
and the issue of interindividual variation has not been
addressed. Because of the difficulty of obtaining
human mRNA from multiple donors for some of these
tissues, we were limited to investigating the expression
levels with single donors in most cases.
Search for catalytic properties of P450 4X1
A number of putative substrates were investigated,
based on both the P450 4X1 mRNA tissue distribution
and other well-known P450 family 4 substrates (e.g.
fatty acids and prostaglandins). In all but two cases,
no oxidation to possible mono- or dioxygenated prod-
ucts was detected under our conditions (supplementary
Table S3). Anandamide, considered the endogenous
ligand of endocannabinoid receptors, exhibits cannabi-
noid-like pharmacological activity [6] and is known to
be oxidized to prostaglandin-like products by cyclo-
oxygenases [24].
P450 4X1 did not form 20-HETE ethanolamide;
however, one of the four potential epoxide (EET)
products was found to increase in the presence of
NADPH (Fig. 5A–E). The MS ⁄ MS spectrum of the
product was very similar to those previously described
for EET ethanolamides [11] and to a 14,15-EET ethan-
olamide standard, with major fragments at m ⁄ z 346
(M-18, -H
2
O), 328 (M-36, -2 ·H
2
O), 303 (M-61, loss
of the ethanolamide group), 285 [loss of 18 (H
2
O)
from m⁄ z 303] and 267 [loss of 18 (H
2
O) from
m ⁄ z 303]. The characteristic fragment m ⁄ z 248 was
readily detectable and a minor m ⁄ z 187 peak was also
found (Fig. 5E) [11]. We conclude that the peak at t
R
8.91 is 14,15–EET ethanolamide. A K
m
of 65 ± 19 lm
and k
cat
of 65 ± 9 pmol product formedÆmin
)1
Ænmol
)1
P450 were measured, using bicistronic membranes
(supplementary Figs S3 and S4). None of the other
EET ethanolamides was formed by P450 4X1. An
experiment with a second preparation of bicistronic
membranes yielded a rate of 130 pmol 14,15-EET
formedÆmin
)1
Ænmol
)1
P450.
Formation of the epoxide was inhibited by pre-incu-
bation (10 min) of P450 4X1 with 1-aminobenzotriazole
(and in the presence of NADPH) [25], providing further
evidence for P450-dependent formation of 14,15–EET
ethanolamide from anandamide. One of two stable
anandamide analogs [26] also yielded a monooxygen-
ated product. N-Cyclopropyl-11-(3-hydroxy-5-pentyl-
phenoxy)-undecanamide (CB–25), a stable analog of
both anandamide and D
9
-tetrahydrocannabinol, was
converted to both a mono- and a dioxygenated prod-
uct, though the position of the oxygen group has not
been determined due to the lack of available standards
(supplementary Fig. S5). Another anadamide analog,
N-cyclopropyl-11-(2-hydroxy-5-pentylphenoxy)-undeca-
namide (CB–52), did not form any products under these
conditions.
When purified P450 4X1 was incubated with ananda-
mide, 14,15-EET ethanolamide was also detected
(Fig. 5). The measured rate was 200 pmol product for-
medÆmin
)1
Ænmol
)1
P450. The addition of cytochrome b
5
did not significantly change the amount of product
formed (180 pmol 14,15-EET ethanolamide formedÆ
min
)1
Ænmol
)1
P450). However, when arachidonic acid
was used as the substrate, 14,15- and 8, 9-EETs were
formed (rates of 18 and 9 pmolÆmin
)1
Ænmol
)1
P450,
respectively) but only in the presence of cytochrome b
5
(molar ratio of 1 : 1) (supplementary Fig. S6). When
another naturally occurring endocannabinoid, 2-arachi-
donoyl glycerol, was incubated with purified P450 4X1
(and NADPH-P450 reductase), no product formation
4000
3500
2500
Relative expression
1500
500
Tissue source
3000
2000
1000
0
Liver
Fetal liver
Kidney
Colon
Breast
Heart
Fetal aorta
Prostate
Skin
Brain
Globus pallidus
Cerebellum
Amygdala
Fig. 4. Tissue distribution of P450 4X1 mRNA measured by real-
time PCR. The relative levels of P450 4X1 mRNA were determined
using real-time PCR in the tissues indicated, using GAPDH as a ref-
erence standard. Different human cDNAs were used as templates
and SYBR Green was used for detection. The mRNA levels are
shown as the ratio of P450 4X1 to GAPDH and represent the mean
of triplicate measurements from each sample. The relative expres-
sion was calculated using the D C
t
method (Livak). The graphs have
standard deviations shown.
P450 4X1 and anandamide oxidation K. Stark et al.
3710 FEBS Journal 275 (2008) 3706–3717 ª 2008 The Authors Journal compilation ª 2008 FEBS
was detected (< 5 pmolÆmin
)1
Ænmol
)1
P450). The cou-
pling efficiency was low. In the absence of substrate,
P450 4X1 oxidized 27 ± 5 nmol NADPHÆmin
)1
Æ
nmol
)1
P450 (22 ± 6 with the addition of cyto-
chrome b
5
). With the substrate anandamide present,
the NADPH oxidation rate was 70 ± 7 nmolÆ min
)1
Æ
nmol
)1
P450 (88 ± 10 with cytochrome b
5
added).
When arachidonic acid was added as the substrate, the
NADPH oxidation rate was 36 ± 5 nmolÆmin
)1
Æ
nmol
)1
P450 (29 ± 2 with cytochrome b
5
added).
Discussion
P450 4X1 was heterologously expressed in E. coli and
found to selectively oxidize the endocannabinoid
anandamide to 14,15-EET ethanolamide (Fig. 5). In
addition, a stable analog of both anandamide and the
cannabinoid D
9
-tetrahydrocannabinol, CB-25, was oxi-
dized to both mono- and dioxygenated products.
P450 4X1 formed two arachidonic acid epoxides but
only in the presence of cytochrome b
5
and at much
lower rates (supplementary Figs S5 and S6).
Anandamide is an arachidonic acid derivative found
in most tissues and an important signaling mediator in
neurological, immune and cardiovascular functions
[27]. It binds to the CB
1
cannabinoid receptor and has
been proposed to be an endogenous cannabinoid
receptor ligand [7,8]. Recent reports also indicate that
anandamide, at concentrations higher than those
needed to activate the CB
1
cannabinoid receptors, is a
full agonist of vanilloid receptor (VR)-1-mediated
functional response, i.e. vasodilatation of small arteries
(not dependent on the endothelium). VR1 may be
involved in the transduction of acute and inflammatory
Fig. 5. LC-MS analysis of the oxidized product formed from anandamide. The chromatogram shows selective ion monitoring of m ⁄ z 364
(MH
+
of ananamide + 16). (A) Control reaction (no protein). (B) P450 4X1, NADPH-P450 reductase and NADPH. (C) P450 4X1 (and NADPH-
P450 reductase) in the absence of NADPH. (D) Overlay of the product formation chromatograms from (B) and (C). Upper (—): P450 4X1 in
the presence of NADPH; lower (- - - - - - - -): P450 4X1 in the absence of NADPH. (E) MS ⁄ MS spectra of 14,15–EET ethanolamide formed
by P450 4X1, with the insert showing the ·10 expansion of the indicated section of the spectrum.
K. Stark et al. P450 4X1 and anandamide oxidation
FEBS Journal 275 (2008) 3706–3717 ª 2008 The Authors Journal compilation ª 2008 FEBS 3711
pain signals [28,29]. In brain and liver, anandamide is
rapidly converted to arachidonic acid and ethanol-
amine by a fatty acid amide hydrolase. P450 oxida-
tions of anandamide are also known. Studies of mouse
liver microsomes incubated with NADPH showed the
generation of ‡ 20 anandamide products determined
by HPLC-UV [6]. Human liver and kidney microsomes
produced a single monohydroxy product, 20-HETE
ethanolamide, in addition to four epoxides, 5,6-, 8,9-,
11–12, and 14,15-EET ethanolamides [11].
In this study, P450 4X1 oxidized anandamide to
14,15-EET ethanolamide as judged by comparison with
commercial standards and previously reported MS
spectra (Fig. 5E), and no other products were detected
(Fig. 5). Another member of P450 family 4, P450 4F2
(expressed in liver and kidney), has been reported to
form a single monooxygenated product from ananda-
mide (20-HETE-arachinodoyl ethanolamide), and
P450 3A4 (in the liver and small intestine) has been
reported to form all four epoxides (EETs) of ananda-
mide [11]. Administration of anandamide to rats
increased the levels of P450 in the 2C and 3A subfami-
lies in rat liver and brain [30]. The in vivo formation
and biological relevance of the P450-derived HETE
and EET ethanolamides remains to be determined, but
they may be important signaling molecules in human
brain. The high level of P450 4X1 (mRNA) in skin
(Fig. 4) may be relevant to a function there. Ananda-
mide concentrations have been measured in rat and
mouse skin [31–33] but apparently not in human skin,
to our knowledge and analysis of database searches.
We are currently working to procure skin samples for
analysis of anandamide and the 14,15-EET product.
In our initial experiments, P450 4X1 was found not
to oxidize either arachidonic acid or a number of other
long-chain fatty acids. However, when cytochrome b
5
was added, P450 4X1 formed both 14,15- and 8,9-EETs
from arachidonic acid, albeit at very low rates. A num-
ber of P450s, primarily from subfamilies 2C, 2J, 4A
and 4F, are known to oxidize arachidonic acid to EETs
and HETEs, which have been implicated as important
signaling mediators with relevance to blood pressure
regulation and other physiological processes, i.e. mito-
genesis, vasodilatation, modulation of cellular Ca
2+
,
Na
+
and K
+
fluxes, and activation of Ca
2+
-dependent
K
+
channels [2]. Most P450 family 4 members are
recognized for their fatty acid hydroxylation activity
but some drugs are also oxidized, for example,
P450 4F3 oxidizes erythromycin and imipramine [34].
A molecular model for P450 4X1 has been built on
the basis of bacterial P450 102A1 (BM3) (26%
sequence identity) and has a substrate pocket that is
L-shaped with the heme located in an angle, with sub-
strates being either short- or longer chain fatty acids,
not oxidized at the x-ends but rather within the hydro-
carbon chain [14]. The model may be consistent with
the observed selective oxidation, although it is based on
low sequence similarity and does not provide an expla-
nation for the preference for oxidation of fatty acid
amides over fatty acids [14]. We found that P450 4X1
did not catalyze the oxidation of any other fatty acids
investigated, or of the neurotransmitters. It is conceiv-
able that some function has been lost due to the N-ter-
minal modification and truncation introduced into our
P450 4X1, and we cannot unambiguously rule out the
possibility that a native P450 4X1 construct expressed
in a different system might oxidize these fatty acids.
In the mouse studies of Bornheim et al. [6], liver
microsomes produced 20 different anandamide oxidation
products at rates of 8–386 pmolÆmin
)1
Æmg
)1
protein.
Mouse brain microsomes produced only two products,
distinct from the liver products, at rates of 7 and
17 pmolÆmin
)1
Æmg
)1
protein. None of the products
were identified. In the study of Snider et al. [11], the
rates of production of anandamide oxidation products
by human kidney microsomes were 44–480 pmolÆ
min
)1
Æmg
)1
protein (V
max
). Exactly how the mouse
results relate to the human results is unclear, in that
none of the (unidentified) anandamide products
matched in brain and liver microsomes in mice [6],
however 14,15-EET ethanolamide, the only ananda-
mide product formed by the brain-selective P450 4X1
(Fig. 5), is also reported to be formed by the liver
enzyme P450 3A4 [11]. Another outstanding issue is
that the catalytic efficiency (k
cat
⁄ K
m
) of recombinant
human P450 4X1 is relatively low because of the K
m
value of 65 lm (supplementary Fig. S3), i.e.
3 · 10
3
m
)1
Æmin
)1
, compared with 1.5 · 10
6
m
)1
Æ
min
)1
for 20-hydroxylation by P450 4F2 [11]. Steady-
state kinetic parameters for P450 3A4 were not
reported but the values measured with liver micro-
somes indicated that the four epoxidations
(by P450 3A4) [11] are more efficient than the P450
4X1-catalyzed 14,15-epoxidation we characterized.
However, it is possible that the selective formation of
14,15-EET ethanolamide in brain has some particular
significance. It should also be noted that the adminis-
tration of anandamide to rats increased the levels of
subfamily 2C and 3A P450s in rat liver and brain [30].
We tried to examine the binding of potential substrates
to P450 4X1 using the heme spectral perturbation
method [35] but neither anandamide nor arachidonic
acid induced a spectral change in three separate
attempts (at concentrations up to 35 lm). However,
the lack of induction of a spectral change has been
noted before with some bona fide substrates [36].
P450 4X1 and anandamide oxidation K. Stark et al.
3712 FEBS Journal 275 (2008) 3706–3717 ª 2008 The Authors Journal compilation ª 2008 FEBS
P450 4X1 is located on chromosome 1 close to
another orphan P450, P450 4Z1, and P450s 4A11,
4A22 and 4B1 ( The subfam-
ily 4F P450s are clustered on chromosome 19p13.1.
P450 4X1 is also well-conserved across species, sharing
84, 80, 81 and 99.6% nucleotide sequence identity with
the dog, rat, mouse and chimpanzee orthologs, respec-
tively. Kidney, breast and aorta all expressed
P450 4X1 mRNA at 5- and 10-fold higher levels than
adult liver, and in prostate the expression was found
to be > 10-fold higher than in liver (Fig. 4). Whole-
brain mRNA expression was fivefold higher than liver,
whereas individual brain structures exhibited both
lower (e.g. globus pallidus) and considerably higher
(e.g. amygdala) levels. The highest mRNA expression
was found in amygdala and skin. Conventional PCR
analysis detected transcripts in kidney, skeletal muscle,
breast, ovary and uterus, and higher expression in tra-
chea and aorta [15,16]. Our real-time PCR analyses
confirm and extend these results (Fig. 4), in general,
and are consistent with the expression profiles sug-
gested by expressed sequence tag sequences reported to
the National Center for Biotechnology Information
(NCBI). A relatively large number of P450 4X1 single-
nucleotide polymorphisms have been reported (http://
www.hapmap.org) and we cannot exclude the possibil-
ity that the inter-individual mRNA levels of P450 4X1
may vary, because these results are not based on
pooled populations (except for fetal liver and aorta,
pool of five). Rat brain regions showing high
P450 4X1 mRNA expression using northern blot and
in situ hybridization were hippocampus, cerebellum
and cortex. P450 4X1 mRNA has also been detected
in rat cerebral vessels in in situ hybridization analysis
[13]. In mouse brain, the orthologous protein was esti-
mated to be present at a level of 10 ngÆmg
)1
micro-
somal protein, suggesting that this may be one of the
major P450s in mouse brain [14]. Mouse P450 4x1 pro-
tein was found not to be induced by phenobarbital,
dioxin, dexamethasone or the peroxisome proliferators
activated receptor (PPAR) a agonist ciprofibrate in
brain, liver or kidney [14]. Some of the P450 family 4
enzymes are known to be induced by PPAR a agonists
[37], and the PPARa agonist Wyeth 14,643 induced
human P450 4X1 in a human hepatoma cell line over-
expressing PPARa [15].
Although the function of this orphan P450 enzyme
must still be considered largely unknown, the expres-
sion pattern and ability to selectively convert ananda-
mide to the epoxide 14,15-EET ethanolamide suggest a
potential role in neurovascular function, and further
studies may reveal other catalytic functions and an
overall pharmacological role in physiological function.
Experimental procedures
Optimization of P450 4X1 and vector preparation
Automated codon optimization and oligonucleotide design
for PCR-based gene synthesis were performed in silico,
using dnaworks 3.1 from the National Institutes of
Health ( [17] (Fig. 1 and
supplementary Table S1). The amino acid sequence and
native cDNA sequence information for human P450 4X1
were obtained from NCBI GenBank sequences (supplemen-
tary Table S2), and codon optimization was performed in
order to match the codon preference biases of E. coli. Four
different N-terminal constructs were prepared, along with
the native codon-optimized sequence construct (with the
change E2A) (supplementary Table S1). In brief, a number
of overlapping oligomers were designed to span the cDNA
sequence and used for primary polymerase chain assembly
followed by one-step PCR (94 °C, 5 min; 94 ° C, 30 s; 58 ° C,
30 s; 72 °C, 2 min, 30 cycles; 72 °C, 10 min). The sequence
was prepared in one synthon containing an NdeI restriction
site (spanning the start codon at the 5¢-end) and an XbaI
restriction site (at the 3¢-flanking end of the sequence). The
insert of the correct size was ligated into the pCW vector, in
both the monocistronic and bicistronic versions (the latter
containing an NADPH-P450 reductase gene downstream of
the P450 4X1 cDNA insert, between the NdeI and XbaI
sites) [19]. Positive selected clones were sequenced using
an Applied Biosystems Big Dye system in the Vanderbilt
facility. In order to facilitate purification using Ni-nitrilotri-
acetic acid chromatography, a (His)
6
tag was added to the
C-terminal end of the native protein.
Four different N-terminal modifications (based on previ-
ous literature, see Table 1 and supplementary Table S2),
were introduced into the native construct (pCWmc_
P450 4X1 native) by PCR-based mutagenesis. AdvantageÔ
DNA polymerase (Stratagene, La Jolla, CA, USA) was
used for the PCR amplification, at an annealing tempera-
ture of 60 °C. All PCR products were purified using pre-
parative electrophoresis on 1.5–2% (w ⁄ v) agarose gels prior
to restriction digestion using NdeI and XbaI. The digested
insert was ligated into the monocistronic pCW vector and
transformed, and positive clones were selected. All modifi-
cations were confirmed by nucleotide sequencing analysis.
All modified and native 4X1 insert cDNAs were ligated
into a bicistronic pCW vector containing an NADPH-P450
reductase vector [19].
Heterologous expression of P450 4X1
Expression of P450 4X1 native and modified constructs was
performed in both E. coli DH5a cells and the same cells
co-expressing the chaperones pGroEL ⁄ ES12. Plasmids
pGroES ⁄ EL12 and each of the constructs were transformed
K. Stark et al. P450 4X1 and anandamide oxidation
FEBS Journal 275 (2008) 3706–3717 ª 2008 The Authors Journal compilation ª 2008 FEBS 3713
and selected on Luria–Bertani plates (containing
50 lgÆmL
)1
ampicillin or 50 lgÆmL
)1
ampicillin plus
20 lgÆmL
)1
kanamycin, respectively). Single colonies were
grown overnight in Luria–Bertani media (100 lgÆmL
)1
ampicillin alone or with 50 lgÆmL
)1
kanamycin, in the case
of pGroES ⁄ EL12) at 37 °C, with 225 r.p.m. gyrorotary
shaking, and used to inoculate 1 L cultures (1 : 100
dilution). Large-scale expression for P450 4X1 bicistronic
construct 3 was performed in 2.8 L Fernbach flasks
containing 1 L Terrific broth (TB) (with 100 lgÆmL
)1
ampi-
cillin, plus 50 lgÆmL
)1
kanamycin in the case of pGroES ⁄
EL12) containing 0.025% (v ⁄ v) of a mixture of trace
elements in an Innova 4300 shaker (New Brunswick Scien-
tific, Edison, NJ, USA) with gyrorotary shaking at
225 r.p.m. until D
600
reached 0.5 [38]. d-Isopropyl-b-galac-
toside (1.0 mm) and 5-aminolevulinic acid (0.5 mm) were
added to start induction, along with arabinose (4 mgÆmL
)1
)
to initiate pGroEL ⁄ ES12 transcription, when included.
Incubation continued at 28 °C with gyrorotary shaking at
190 r.p.m. for another 17–21 h. Expression levels were
monitored over 48 h.
Purification of recombinant P450 4X1
E. coli membranes were prepared as previously described
[39]. Membranes of P450 4X1 (from 1 L culture) were
solubilized in 400 mm potassium phosphate buffer (pH 7.4)
containing 20% glycerol (v ⁄ v), 1.0 mm EDTA, 0.5%
sodium Chaps (w ⁄ v) and 1.0 mm imidazole. The mixture
was stirred overnight at 4 °C and centrifuged at 10 000 g
for 60 min, and the supernatant was loaded on a Ni-nitrilo-
triacetic acid column (6 mL) equilibrated with 400 mm
potassium phosphate buffer (pH 7.4) containing 1.0 mm
EDTA, 1.0 m KCl, 0.5% Chaps (w ⁄ v), 10 mm b-mercapto-
methanol and 1.0 mm imidazole. The enzyme was eluted
with 100 mm potassium phosphate buffer (pH 7.4) contain-
ing 0.5% Chaps (w ⁄ v), 1.0 m KCl, 10 mm b-mercaptometh-
anol and a gradient increasing from 50 to 100 mm
imidazole. The eluted fractions were pooled and dialyzed
four times versus 100 vol. of 200 mm potassium phosphate
buffer (pH 7.4) containing 1.0 mm EDTA and 20% glyc-
erol (v ⁄ v) at 4 °C. Purified P450 4X1 was stored in small
aliquots at )70 °C until used. (Purified 4X1 appeared to be
less stable under storage conditions than P450 2W1 [18]
and several other recombinant human P450s.).
Real-time PCR analysis of P450 4X1 expression
Human poly(A
+
) RNA samples (human adult and fetal
liver, kidney, colon, skin, prostate, breast, adult heart and
fetal aorta, as well as a number of human brain regions
including whole brain, cerebellar hemisphere, basal ganglia,
globus pallidus and amygdala) were obtained from Ambion
Inc. (Austin, TX, USA) and Stratagene. Aliqouts of RNAs
(1 lg) were reverse-transcribed using a two-step Enhanced
AvianÔ RT reaction (Sigma Aldrich, St Louis, MO, USA)
containing deoxynucleoside triphosphate mix (10 mm
dNTP), random nonamers (50 lm in H
2
O), Enhanced
AMV RTÔ (20 UÆmL
)1
in 200 mm potassium phosphate
buffer pH 7.2 containing 2 mm dithiothreitol, 0.2% Tri-
ton X-100 v ⁄ v and 50% glycerol v ⁄ v), 10· buffer for
AMV RT (500 mm Tris ⁄ HCl buffer pH 8.3 containing
400 mm KCl, 80 mm MgCl
2
and 10 mm dithiothreitol) and
RNase inhibitor (20 UÆlL
)1
)in20lL volume and used for
first strand synthesis (25 °C, 25 min; 42 °C, 50 min) accord-
ing to the manufacturer’s protocol, and 1 lL cDNA was
used as template for each PCR. Primers for real-time PCR
of human P450 4X1 mRNA were (forward) 5 ¢-CAC
CGCTTGTACAGTTTGTTGT and (reverse) 5¢-AGAT
ACAATAATCCAGGAAAGAAAGAA, adapted from
Savas et al. [15], specifically amplifying a 127 bp fragment
of the cDNA. GAPDH and 18S RNA qPCR primer
assay sets were purchased from SuperArray Bioscience
(Frederick, MD, USA).
Quantitative real-time PCR was performed using
iQÔ SYBR Green PCR Master MixÔ according to the
manufacturer’s instructions (Bio-Rad, Hercules, CA, USA).
Each cDNA sample was analyzed in triplicate. Real-time
RT-PCR (15 lL) were performed with 0.4 lm forward and
reverse primers and 1 lL first-strand cDNA template
(corresponding to 30–50 ng cDNA). The program was set
at 95 °C (15 min), followed by 95 °C (30 s) for 40 cycles,
55 °C (30 s) and 72 °C (30 s). Real-time PCR was per-
formed on a MyIQ Single-Color Real-Time PCR Detection
SystemÔ (Bio-Rad) in MicroAmp OpticalÔ 96-well reac-
tion plates (Bio-Rad). P450 4X1 mRNA levels were calcu-
lated using the comparative C
t
method and normalized to
GAPDH expression levels.
LC-MS ⁄ MS analysis
LC-MS ⁄ MS analysis was performed on a Waters Acquity
UPLC system (Waters, Milford, MA, USA) connected to a
ThermoFinnigan LTQ mass spectrometer (ThermoFisher,
Watham, MA, USA). Analysis was performed in the ESI
positive or negative ion mode using an Acquity UPLC BEH
octadecylsilane (C
18
) column (1.7 lm; 1.0 · 100 mm). All
analysis was performed using a gradient from Buffer A
(10 mm NH
4
CH
3
CO
2
in 5% CH
3
CN, v ⁄ v) to Buffer B
(10 mm NH
4
CH
3
CO
2
plus 95% CH
3
CN, v ⁄ v). The following
gradient program was used with a flow rate of 100 lLÆmin
)1
.
Sample (15 lL of a total of 90 lL) was injected on the col-
umn using an autosampler system using solvent mixture
A:B⁄ 95 : 5 (v ⁄ v) for 0–3 min; A : B ⁄ 80 : 20 (v ⁄ v) for
3–6 min; A : B ⁄ 60 : 40 (v ⁄ v) for 6–9 min; A : B ⁄ 0 : 100
(v ⁄ v) for 9–10 min. The temperature of the column was
maintained at 55–60 ° C. ESI conditions were as follows:
source voltage, 4 kV; source current, 100 lA; auxiliary gas
flow rate setting, 20; sweep gas flow rate setting, 5; sheath
gas flow setting, 34; capillary voltage, )49 V; capillary
P450 4X1 and anandamide oxidation K. Stark et al.
3714 FEBS Journal 275 (2008) 3706–3717 ª 2008 The Authors Journal compilation ª 2008 FEBS
temperature, 350 °C; tube lens voltage, )90 V. MS ⁄ MS
conditions were as follow: normalized collision energy, 35%;
activation Q, 0.250; activation time, 30 ms.
Data were acquired in positive and negative ion modes
using the xcalibur software package (ThermoElectron)
with one full scan from m ⁄ z 100 to 500 followed by data-
dependent MS ⁄ MS scans of putative mono- and dioxygen-
ated products (supplementary Table S3). Anandamide,
2–arachidonoyl glycerol, arachidonic acid, docosahexaenoic
acid, eicosapentaenoic acid, eicosatrienoic acid, prostaglan-
din E
2
and two stable analogs of anandamide and D
9
-tetra-
hydrocannabinol, CB-25 and CB-52, were purchased from
Cayman Chemicals (Ann Arbor, MI, USA). Dopamine-
HCl, tyramine-HCl, loratadine, clotrimazole and terfena-
dine were purchased from Sigma Aldrich.
Search for putative substrates using bicistronic
P450 4X1 protein
A number of potential substrates (100 lm) (supplementary
Table S3 and supplementary Figs S3–S6) were incubated
in 100 mm potassium phosphate buffer (pH 7.4) with
bicistronic membranes containing P450 4X1 protein and
human NADPH-P450 reductase (0.3 lm) in a total volume
of 0.5 mL. All samples had two controls, one without the
addition of the NADPH-generating system and one without
protein. The reactions were carried out at 37 °C (30 min)
and initiated by the addition of an NADPH-regenerating
system [40]. The reactions were terminated by the addition
of 1.0 mL of ethyl acetate and extracted (three times, with
separation each time by centrifugation at 3 · 10
3
g for
10 min); the combined extracts were dried under an N
2
stream and the residue was dissolved in a 50 : 50 mixture
of CH
3
CN ⁄ H
2
O(v⁄ v). Similar incubation procedures were
carried out with all test substrates.
For steady-state analysis of the anandamide oxidation
reaction, bicistronic P450 4X1 protein (with NADPH-P450
reductase) was used at a final concentration of 0.38 lm with
incubation (37 °C) for 1, 5, 10, 15, 30, 45, 60 and 120 min.
Different concentrations of bicistronic P450 4X1 protein
were used (0.075, 0.38, 0.75, 1.13 and 1.50 lm) with incuba-
tion for 30 min at 37 °C. In the same studies, the enzyme
was preincubated with the mechanism-based inhibitor
1–aminobenzotriazole (20 lm ). 1-Aminobenzotriazole was
incubated in the presence and absence of the NAPDH-
generating system for 10 min prior to the addition of
anandamide.
In assays using purified P450 enzymes, P450 4X1
(0.1 lm) was mixed with purified recombinant (E. coli) rat
NADPH-P450 reductase [41] (0.5 lm), 30 lml-a-dilaurolyl-
sn-glycero-3-phosphocholine and substrate in 100 mm
potassium phosphate buffer (pH 7.4) and incubated for
5 min at room temperature (total volume of 0.5 mL). Reac-
tions were started after 5 min of pre-incubation at 37 °C
with the addition of an NADPH-generating system [35].
The reactions were terminated by addition of two volumes
of ethyl acetate and analyzed as described above.
Assay of cholesterol oxidation
Assays of cholesterol oxidation were performed using a
general procedure described elsewhere [17].
Other assays and methods
Concentrations of P450s were estimated using the CO-dif-
ference spectra assay [42] with an OLIS ⁄ Aminco DW2a
spectrophotometer (On-Line Instrument Systems, Bogart,
GA, USA). SDS ⁄ PAGE was performed according to
Laemmli [43] and staining was done using an ammoniacal
silver method [44].
Data analysis
All kinetic data were analyzed by analysis of variance
(one-way ANOVA) followed by multiple comparisons using
Kolmogorov–Smirnov’s test for normality, Dunnet’s test
for comparison of groups against control groups, and
Student–Newman–Keul’s test for comparison of all groups
pair-wise. A Kruskal–Wallis test was used for non-para-
metric data. spss v. 13 for Windows (SPSS, Chicago, IL,
USA) was used. Results are expressed as means ± SEM.
The computer program graphpad prism for Windows 5.0
(GraphPad Prism Software, San Diego, CA, USA) was
used to create graphs. Values of P < 0.05 were considered
to be significant.
Acknowledgements
This work was supported in part by the Henning and
Johan Trone Holst stiftelse (to KS), Svenska
La
¨
karesa
¨
llskapet och Apotekarsocietete
´
n (to KS), and
US Public Health Service grants R37 CA090426 and
P30 ES000267 (to FPG). We thank MV Martin for
technical assistance and DL Hachey and MW Calcutt
of the Vanderbilt Mass Spectrometry Facility Core for
technical assistance and discussions.
References
1 Palmer G & Reedijk J (1992) Nomenclature of electron-
transfer proteins. Recommendations 1989. J Biol Chem
267, 665–677.
2 Capdevila J, Holla VR & Falck JR (2005) Cytochrome
P450 and the metabolism and bioactivation of arachi-
donic acid and eicosanoids. In Cytochrome P450:
Structure, Mechanism, and Biochemistry (Ortiz de
Montellano PR, ed), pp. 531–551. Kluwer Aca-
demic ⁄ Plenum, New York, NY.
K. Stark et al. P450 4X1 and anandamide oxidation
FEBS Journal 275 (2008) 3706–3717 ª 2008 The Authors Journal compilation ª 2008 FEBS 3715
3 Guengerich FP (2005) Human cytochrome P450
enzymes.InCytochrome P450: Structure, Mechanism,
and Biochemistry (Ortiz de Montellano PR, ed), pp. 377–
530. Kluwer Academic ⁄ Plenum, New York, NY.
4 Kalsotra A & Strobel HW (2006) Cytochrome P450 4F
subfamily: at the crossroads of eicosanoid and drug
metabolism. Pharmacol Ther 112, 589–611.
5 Qu W, Bradbury JA, Tsao CC, Maronpot R, Harry
GJ, Parker CE, Davis LS, Breyer MD, Waalkes MP,
Falck JR et al. (2001) Cytochrome P450 CYP2J9, a
new mouse arachidonic acid omega-1 hydroxylase pre-
dominantly expressed in brain. J Biol Chem 276, 25467–
25479.
6 Bornheim LM, Kim KY, Chen B & Correia MA (1995)
Microsomal cytochrome P450-mediated liver and brain
anandamide metabolism. Biochem Pharmacol 50, 677–
686.
7 Kozak KR & Marnett LJ (2002) Oxidative metabolism
of endocannabinoids. Prostaglandins Leukot Essent
Fatty Acids 66, 211–220.
8 Palmer SL, Khanolkar AD & Makriyannis A (2000)
Natural and synthetic endocannabinoids and their
structure–activity relationships. Curr Pharm Design 6,
1381–1397.
9 Hanus L, Abu-Lafi S, Fride E, Breuer A, Vogel Z,
Shalev DE, Kustanovich I & Mechoulam R (2001)
2-Arachidonyl glyceryl ether, an endogenous agonist of
the cannabinoid CB1 receptor. Proc Natl Acad Sci USA
98, 3662–3665.
10 Devane WA, Hanus L, Breuer A, Pertwee RG, Steven-
son LA, Griffin G, Gibson D, Mandelbaum A, Etinger
A & Mechoulam R (1992) Isolation and structure of a
brain constituent that binds to the cannabinoid recep-
tor. Science 258, 1946–1949.
11 Snider NT, Kornilov AM, Kent UM & Hollenberg PF
(2007) Anandamide metabolism by human liver and
kidney microsomal cytochrome P450 enzymes to form
hydroxyeicosatetraenoic and epoxyeicosatrienoic acid
ethanolamides. J Pharmacol Exp Ther 321, 590–597.
12 Stark K & Guengerich FP (2007) The orphan human
cytochromes P450: what is left to learn? Drug Metab
Rev 39, 627–637.
13 Bylund J, Zhang C & Harder DR (2002) Identification
of a novel cytochrome P450, CYP4X1, with unique
localization specific to the brain. Biochem Biophys Res
Commun 296, 677–684.
14 Al-Anizy M, Horley NJ, Kuo CW, Gillett LC,
Laughton CA, Kendall D, Barrett DA, Parker T &
Bell DR (2006) Cytochrome P450 Cyp4x1 is a
major P450 protein in mouse brain. FEBS J 273,
936–947.
15 Savas U, Hsu MH, Griffin KJ, Bell DR & Johnson EF
(2005) Conditional regulation of the human CYP4X1
and CYP4Z1 genes. Arch Biochem Biophys 436, 377–
385.
16 Choudhary D, Jansson I, Stoilov I, Sarfarazi M &
Schenkman JB (2005) Expression patterns of mouse
and human CYP orthologs (families 1-4) during devel-
opment and in different adult tissues. Arch Biochem
Biophys 436, 50–61.
17 Wu Z-L, Bartleson CJ, Ham A-JL & Guengerich FP
(2006) Heterologous expression, purification, and prop-
erties of human cytochrome P450 27C1. Arch Biochem
Biophys 445, 138–146.
18 Wu Z-L, Sohl CD, Shimada T & Guengerich FP (2006)
Recombinant enzymes over-expressed in bacteria show
broad catalytic specificity of human cytochrome P450
2W1 and limited activity of human cytochrome P450
2S1. Mol Pharmacol
69, 2007–2014.
19 Parikh A, Gillam EMJ & Guengerich FP (1997) Drug
metabolism by Escherichia coli expressing human cyto-
chromes P450. Nat Biotechnol 15, 784–788.
20 Cheesman MJ, Baer BR, Zheng YM, Gillam EM &
Rettie AE (2003) Rabbit CYP4B1 engineered for high-
level expression in Escherichia coli: ligand stabilization
and processing of the N-terminus and heme prosthetic
group. Arch Biochem Biophys 416, 17–24.
21 Barnes HJ, Arlotto MP & Waterman MR (1991)
Expression and enzymatic activity of recombinant
cytochrome P450 17a-hydroxylase in Escherichia coli.
Proc Natl Acad Sci USA 88, 5597–5601.
22 Richardson TH, Hsu MH, Kronbach T, Barnes HJ,
Chan G, Waterman MR, Kemper B & Johnson EF
(1993) Purification and characterization of recombinant-
expressed cytochrome P450 2C3 from Escherichia coli:
2C3 encodes the 6b-hydroxylase deficient form of P450
3b. Arch Biochem Biophys 300, 510–516.
23 Licad-Coles E, He K, Yin H & Correia MA (1997)
Cytochrome P450 2C11: Escherichia coli expression,
purification, functional characterization, and mecha-
nism-based inactivation of the enzyme. Arch Biochem
Biophys 338, 35–42.
24 Rouzer CA & Marnett LJ (2008) Non-redundant func-
tions of cyclooxygenases: oxygenation of endocannabi-
noids. J Biol Chem 283, 8065–8069.
25 Emoto C, Murase S, Sawada Y & Iwasaki K (2005)
In vitro inhibitory effect of 1-aminobenzotriazole on
drug oxidations in human liver microsomes: a compari-
son with SKF-525A. Drug Metab Pharmacokinet 20,
351–357.
26 Brizzi A, Brizzi V, Cascio MG, Bisogno T, Sirianni R
& Di Marzo V (2005) Design, synthesis, and binding
studies of new potent ligands of cannabinoid receptors.
J Med Chem 48, 7343–7350.
27 Fowler CJ (2007) The pharmacology of the cannabinoid
system – a question of efficacy and selectivity. Mol Neu-
robiol 36, 15–25.
28 De Petrocellis L, Bisogno T, Maccarrone M, Davis JB,
Finazzi-Agro A & Di Marzo V (2001) The activity of
anandamide at vanilloid VR1 receptors requires facili-
P450 4X1 and anandamide oxidation K. Stark et al.
3716 FEBS Journal 275 (2008) 3706–3717 ª 2008 The Authors Journal compilation ª 2008 FEBS
tated transport across the cell membrane and is limited
by intracellular metabolism. J Biol Chem 276, 12856–
12863.
29 Herradon E, Martin MI & Lopez-Miranda V (2007)
Characterization of the vasorelaxant mechanisms of the
endocannabinoid anandamide in rat aorta. Br J Phar-
macol 152, 699–708.
30 Costa B, Parolaro D & Colleoni M (2002) Chronic
treatment with the endocannabinoid anandamide
increases cytochrome P450 metabolizing system in the
rat. Eur J Pharmacol 449, 61–69.
31 Felder CC, Nielsen A, Briley EM, Palkovits M, Priller
J, Axelrod J, Nguyen DN, Richardson JM, Riggin RM,
Koppel GA et al. (1996) Isolation and measurement of
the endogenous receptor agonist, anandamide, in brain
and peripheral tissues of human and rat. FEBS Lett
393, 231–235.
32 Zygmunt PM, Julius I, Di Marzo I & Ho
¨
gesta
¨
tt ED
(2000) Anandamide – the other side of the coin. Trends
Pharmacol Sci 21, 43–44.
33 Darmani NA, Izzo AA, Degenhardt B, Valenti M,
Scaglione G, Capasso R, Sorrentini I & Di Marzo Y
(2005) Involvement of the cannabimimetic compound,
N-palmitoyl-ethanolamine, in inflammatory and neuro-
pathic conditions: review of the available pre-clinical
data, and first human studies. Neuropharmacology 48,
1154–1163.
34 Kalsotra A, Turman CM, Kikuta Y & Strobel HW
(2004) Expression and characterization of human cyto-
chrome P450 4F11: putative role in the metabolism of
therapeutic drugs and eicosanoids. Toxicol Appl Phar-
macol 199, 295–304.
35 Schenkman JB, Remmer H & Estabrook RW (1967)
Spectral studies of drug interaction with hepatic micro-
somal cytochrome P-450. Mol Pharmacol 3, 113–123.
36 Guengerich FP (1983) Oxidation–reduction properties
of rat liver cytochrome P-450 and NADPH-cytochrome
P–450 reductase related to catalysis in reconstituted
systems. Biochemistry 22, 2811–2820.
37 Cui X, Kawashima H, Barclay TB, Peters JM, Gonz-
alez FJ, Morgan ET & Strobel HW (2001) Molecular
cloning and regulation of expression of two novel
mouse CYP4F genes: expression in peroxisome prolifer-
ator-activated receptor a-deficient mice upon lipopoly-
saccharide and clofibrate challenges. J Pharmacol Exp
Ther 296, 547–555.
38 Sandhu P, Baba T & Guengerich FP (1993) Expression
of modified cytochrome P450 2C10 (2C9) in Escherichia
coli, purification, and reconstitution of catalytic activity.
Arch Biochem Biophys 306, 443–450.
39 Gillam EMJ, Baba T, Kim B-R, Ohmori S & Guenge-
rich FP (1993) Expression of modified human cyto-
chrome P450 3A4 in Escherichia coli and purification
and reconstitution of the enzyme. Arch Biochem Biophys
305, 123–131.
40 Guengerich FP & Bartleson CJ (2007) Analysis and
characterization of enzymes and nucleic acids. In Princi-
ples and Methods of Toxicology (Hayes AW, ed), pp.
1981–2048. CRC Press, Boca Raton, FL.
41 Hanna IH, Teiber JF, Kokones KL & Hollenberg PF
(1998) Role of the alanine at position 363 of cyto-
chrome P450 2B2 in influencing the NADPH- and
hydroperoxide-supported activities. Arch Biochem
Biophys 350, 324–332.
42 Omura T & Sato R (1964) The carbon monoxide-bind-
ing pigment of liver microsomes. I. Evidence for its
hemoprotein nature. J Biol Chem 239, 2370–2378.
43 Laemmli UK (1970) Cleavage of structural proteins
during the assembly of the head of bacteriophage T
4
.
Nature 227, 680–685.
44 Wray W, Boulikas T, Wray VP & Hancock R (1981)
Silver staining of proteins in polyacrylamide gels. Anal
Biochem 118, 197–203.
Supplementary material
The following supplementary material is available
online:
Fig. S1. (A) N-Terminal modifications used for expres-
sion trials of codon-optimized human P450 4X1 and
primers used for PCR to introduce new N-terminal
modifications. (B) Agarose gel electrophoresis of the
gene synthesis product of codon-optimized polymerase
chain assembly.
Fig. S2. Comparison of rat P450 4X1 and mouse
P450 4x1 microsomal sequences with human
P450 4X1.
Fig. S3. Steady-state kinetics of anandamide epoxida-
tion.
Fig. S4. Plot of 14,15-EET ethanolamide formation
versus P450 4X1 concentration.
Fig. S5. LC-MS analysis of CD-25 products.
Fig. S6. LC-MS spectra of products formed from ara-
chidonic acid.
Table S1. Oligonucleotides used for synthesis of
P450 4X1.
Table S2. P450 4X1 N-terminal modifications and
expression levels in E. coli DH5a.
Table S3. Assays for potential reactions catalyzed by
P450 4X1.
This material is available as part of the online article
from
Please note: Blackwell Publishing are not responsible
for the content or functionality of any supplementary
materials supplied by the authors. Any queries (other
than missing material) should be directed to the corre-
sponding author for this article.
K. Stark et al. P450 4X1 and anandamide oxidation
FEBS Journal 275 (2008) 3706–3717 ª 2008 The Authors Journal compilation ª 2008 FEBS 3717