Báo cáo khoa học: The domains carrying the opposing activities in adenylyltransferase are separated by a central regulatory domain ppt
Bạn đang xem bản rút gọn của tài liệu. Xem và tải ngay bản đầy đủ của tài liệu tại đây (1.04 MB, 13 trang )
The domains carrying the opposing activities in
adenylyltransferase are separated by a central regulatory
domain
Paula Clancy
1
, Yibin Xu
1,2
, Wally C. van Heeswijk
1,3
, Subhash G. Vasudevan
1,4
and David L. Ollis
5
1 Department of Biochemistry and Molecular Biology, James Cook University, Townsville, Australia
2 Structural Biology Division, The Walter and Eliza Hall Institute of Medical Research, Parkville, Australia
3 Department of Molecular Cell Physiology, Faculty of Earth and Life Sciences, Vrije Universiteit, Amsterdam, the Netherlands
4 Dengue Unit, Novartis Institute for Tropical Diseases, Singapore
5 Research School of Chemistry, Australian National University, Canberra, Australia
In Escherichia coli, adenylyltransferase (AT) catalyzes
the adenylylation (Scheme 1) and deadenylylation
(Scheme 2) of glutamine synthetase (GS) according to
the reactions:
GS þ ATP ! GS-AMP þ PP
i
Scheme 1.
GS-AMP þ P
i
! GS þ ADP
Scheme 2.
In its unmodified form, GS catalyzes ATP-depen-
dent ammonia incorporation into glutamate, forming
glutamine (Gln), and in so doing drives the uptake of
ammonia by enteric bacteria [1–4]. The adenylylated
form of GS has little activity. The two activities of AT
are mechanistically distinct, but are functionally the
reverse of each other, and must be carefully controlled
by the organism in order to prevent futile cycling of
ATP. Growth will occur in a low-ammonia environ-
ment if GS is active, with the deadenylylation activity
Keywords
adenyltransferase; intramolecular signaling;
monoclonal antibody; regulatory domain
Correspondence
Y. Xu, Structural Biology Division, The
Walter and Eliza Hall Institute of Medical
Research, Parkville, Victoria, 3050, Australia
Fax: +61 3 9347 0852
Tel: +61 3 9345 2305
E-mail:
(Received 6 February 2007, revised 1 April
2007, accepted 4 April 2007)
doi:10.1111/j.1742-4658.2007.05820.x
Adenylyltransferase is a bifunctional enzyme that controls the enzymatic
activity of dodecameric glutamine synthetase in Escherichia coli by rever-
sible adenylylation and deadenylylation. Previous studies showed that the
two similar but chemically distinct reactions are carried out by separate
domains within adenylyltransferase. The N-terminal domain carries the
deadenylylation activity, and the C-terminal domain carries the adenylyla-
tion activity [Jaggi R, van Heeswijk WC, Westerhoff HV, Ollis DL &
Vasudevan SG (1997) EMBO J 16, 5562–5571]. In this study, we further
map the domain junctions of adenylyltransferase on the basis of solubility
and enzymatic analysis of truncation constructs, and show for the first time
that adenylyltransferase has three domains: the two activity domains and
a central, probably regulatory (R), domain connected by interdomain
Q-linkers (N-Q1-R-Q2-C). The various constructs, which have the oppo-
sing domain and or central domain removed, all retain their activity in the
absence of their respective nitrogen status indicator, i.e. PII or PII-UMP.
A panel of mAbs to adenylyltransferase was used to demonstrate that the
cellular nitrogen status indicators, PII and PII-UMP, probably bind in the
central regulatory domain to stimulate the adenylylation and deadenylyla-
tion reactions, respectively. In the light of these results, intramolecular sign-
aling within adenylyltransferase is discussed.
Abbreviations
AT, adenylyltransferase; BPM, b-polymerase motif; GS, glutamine synthetase; Gln, glutamine; a-KG, a-ketoglutarate; R domain, regulatory
domain; UT, uridylyltransferase.
FEBS Journal 274 (2007) 2865–2877 ª 2007 The Authors Journal compilation ª 2007 FEBS 2865
of AT being switched on and the adenylylation activity
switched off. Conversely, in a high-ammonia environ-
ment, unnecessary ATP consumption can be reduced
by turning down GS activity, with progressive adenyly-
lation. It is completely switched off when all 12 sub-
units are converted to the inactive GS-AMP form. In
this situation, the adenylylation activity of AT is
switched on, and the deadenylylation activity must be
switched off. The two antagonistic activities of AT are
profoundly influenced by the signal transduction
protein PII, and also by the small molecule effectors
a-ketoglutarate (a-KG) and Gln. PII is the nitrogen
status indicator of the cell: PII-UMP implies low nitro-
gen, and unmodified PII implies nitrogen excess. The
modulation and demodulation of PII is carried out by
uridylyltransferase (UT). In a low-nitrogen environ-
ment, the uridylylation activity of UT is stimulated
and PII is converted to PII-UMP [5,6]. PII-UMP binds
to AT as a complex with ATP and a-KG and inhibits
its adenylylation activity, at the same time stimulating
deadenylylation activity [7,8]. In a high-nitrogen envi-
ronment, the supply of a-KG is depleted and the Gln
concentration increases. In this case, the uridylyl-
removing activity of UT causes PII-UMP to be con-
verted to PII [5]. The unmodified PII and Gln bind to
AT, with a consequent reduction in deadenylylation
activity and activation of the adenylylation activity
[7,8]. In addition to the regulation of GS activity by
PII, the latter also regulates coordinately the transcrip-
tion of the gene encoding GS by a two-component sys-
tem [8,9], which is not discussed here. It has been
shown that the two activities of AT reside on separate
domains [10]. In the previous study, two constructs of
AT were made: AT-N consisted of residues 1–423
(AT-N:1–423) and was found to have the deadenylyla-
tion activity. AT-C consisted of residues 425–946
(AT-C:425–946) and contained the adenylylation activ-
ity. Both constructs contained the signature sequence
that is also found in the active site of rat DNA poly-
merase b [11]. Construct numbering is based on whe-
ther it is C-terminal (AT-C) or N-terminal (AT-N),
and where the starting and finishing residues fall in the
polypeptide chain (Fig. 1).
The present extended study on AT domains [10] was
based on three observations which suggested that the
domain boundaries of AT-N and AT-C were not
defined by the earlier truncations. First, AT-N:1–423
was poorly soluble, and only a limited amount of pro-
tein could be isolated for enzymatic characterization.
Extension of this construct by just 17 amino acids to
AT-N:1–440 produced a completely soluble domain
with deadenylylation activity [12]. The structure of this
domain was determined by X-ray crystallography [13].
Second, the completely soluble AT-C:425–946 trunca-
tion construct was highly susceptible to proteolysis in
the N-terminal region, such that about seven amino
acids were readily cleaved off during purification.
Third, another putative Q-linker sequence (Q2) [14]
was noted between residues 607 and 627 in addition
to the previously noted Q-linker 1 from residues 441
to 462 [10]. Q-linkers are linker sequences ( 15–25
residues long) that tether structurally distinct but inter-
acting domains in a wide range of prokaryotic two-
component regulatory and sensory proteins such as
NTRB ⁄ NTRC and NIFA ⁄ NIFL. Individual Q-linker
sequences are not strongly conserved, and they have a
low probability of having an a or b secondary struc-
ture. They are rich in Gln (and hence Q-linkers), Arg,
Glu, Ser and Pro residues, with a hydrophobic residue
such as Leu, Ala, Ile or Val every four or five residues.
Q-linkers flank highly conserved and system-specific
N-terminal and C-terminal domains in these types of
proteins [10]. Together, these observations suggested
that the opposing activities of the two domains may be
separated by a third central domain, and that complete
AT can be represented as N-Q1-R-Q2-C. The solu-
bility of truncated domains is widely regarded as an
indicator that domain boundaries have been correctly
chosen [15]. Overhanging amino acid stretches that are
not part of the domain or missing stabilizing end resi-
dues (when the truncation construct is not the full
length of the domain) hamper correct protein folding
during overexpression, leading to aggregation and
reduced solubility [16]. Accordingly, a series of N-ter-
minal and C-terminal truncations of AT have been
produced (Fig. 1), guided by secondary structure pre-
diction (predictprotein) [17,18], to define the domain
boundaries of AT and gain a better insight into the
intramolecular signal transduction mechanism of the
protein.
In order to understand the structure, function and
regulation of AT, mouse mAbs were also produced
and used to analyze the actions of AT [19]. Using the
truncated AT constructs, the mAb-binding sites are
defined, and the presence of a central regulatory
domain is demonstrated.
Results
AT has a central regulatory domain
On the basis of studies that showed solubility of a
truncation construct of a water-soluble multidomain
protein is a good indicator of correct folding and
domain boundaries [15,16], AT-RQ2:463–627 (central
R domain + Q2), AT-C:607–946 (Q2 + C-terminal
Domain structure of adenylyltransferase P. Clancy et al.
2866 FEBS Journal 274 (2007) 2865–2877 ª 2007 The Authors Journal compilation ª 2007 FEBS
domain) and AT-DR:1-440- - -628-946 (N-terminal
domain+ C-terminal domain) truncations (Fig. 1)
were expressed from plasmids bearing the correspond-
ing section of the gene and subjected to a rapid solu-
bility test. In addition to the previously noted
Q-linker from residues 441 to 462, the presence of the
second Q-linker from residues 607 to 627 provided
the positions for the three truncations.
The three truncation constructs had bands of similar
intensity for both whole cell extract and the cell-free
lysate in western blot, demonstrating that the
expressed constructs were soluble (data not shown).
This result implies that the N-terminal domain
(AT-N:1–440) [12,13], R domain (AT-RQ2:463–627),
C-terminal domain (AT-C:607–946) and a construct
that was formed from the N-terminal and C-terminal
domains (AT-DR:1-440- - -628-946) consisted of stable
domains.
The deadenylylation activity of the N-terminal
domain (AT-N:1–440) has already been reported [12].
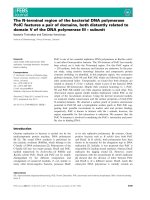
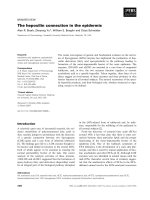
Fig. 1. Schematic representation of the truncation constructs of AT. Truncations of the AT protein (946 residues long) were designated AT-N
or AT-C, depending on their location in the linear polypeptide chain, and their starting and finishing residues (e.g. AT-N:1–440 refers to the
N-terminal 440 residues of AT). Also indicated on the diagram are the positions of the two predicted b-polymerase motifs (BPM1 and BPM2)
[11], the two Q-linkers (Q1 and Q2) [14], and the amino acid sequence and predicted secondary structure of the truncation region of the pro-
tein between residues 421 and 600 [17,18]. H (helix) and L (loop). The solubility of the constructs is shown in parentheses: Soluble (S), partly
soluble (PS), insoluble (IS), thermal induction at 37 °C (– T), and isopropyl thio-b-
D-galactoside induction at low temperature, i.e. 18 °C (– I).
P. Clancy et al. Domain structure of adenylyltransferase
FEBS Journal 274 (2007) 2865–2877 ª 2007 The Authors Journal compilation ª 2007 FEBS 2867
This construct had deadenylylation activity that was
independent of both the small effector molecule a-KG
and the effector protein PII-UMP, even when they
were present in molar excess. In comparison with the
entire protein, the construct was 1000 times less act-
ive (data not shown).
The AT-N:1–423 construct was previously reported
to be as active as wild-type AT and regulated in the
same way [10]. This discrepancy in the activities of
these two N-terminal constructs probably arose from
the degree of purity of the two protein preparations.
The AT-N:1–423 construct was not very soluble, and
the protein preparation was only partly purified [10],
whereas the AT-N:1–440 construct was fully soluble,
and the protein preparation was extremely pure, allow-
ing structural determination from protein crystals [13].
It is quite possible that endogenous AT and other fac-
tors not removed from the protein preparation contri-
buted to the activity reported for AT-N:1–423.
It was previously demonstrated that the adenylyla-
tion activity of the AT-C:425–946 truncation construct
was independent of PII [10] even when PII was present
in molar excess. The various adenylylation activity lev-
els of AT, AT-C:432–946, AT-C:551–946, AT-C:607–
946 and AT-DR:1-440- - -628-946 are shown in Table 1.
The AT-C:642–946 truncation construct had no ade-
nylylation activity (data not shown). All the C-terminal
truncation constructs were used in the assay at 0.6 lm
rather than 0.025 lm (entire AT) to give similar activ-
ity levels as those of entire AT. The AT-DR:1–440- - -
628–946 truncation construct expressed poorly and
was not purified. To avoid interference from the poten-
tially more active endogenous AT (the expression
strain was not glnE
–
), this construct was used at
0.2 lm in the assay.
Intact AT needs both PII and Gln to stimulate full
adenylylation activity. Removal of either effector cau-
ses a drop in activity. If PII is omitted from the ade-
nylylation assay, there is a 70% drop in activity, and
if Gln is omitted from the assay, there is a 60%
drop in activity. Omission of both PII and Gln virtu-
ally abolishes activity. By contrast, the adenylylation
activity for each of the C-terminal truncation con-
structs and AT:DR:1-440- - -628-946 is independent of
PII, as their activity level is the same whether the PII
effector protein is present or not (Table 1).
The previously reported adenylylation domain,
AT-C:425–946 ( 60 kDa), has now been redefined by
the truncation construct AT-C:607–946 ( 39 kDa).
All the C-terminal truncation constructs were
dependent on Gln for full activity, because the removal
of Gln from the assay resulted in a drop in adenylyla-
tion activity ranging from 50% to 85%. When Gln
was omitted from the assay, further removal of PII
still had no effect on the activity of the truncated
C-terminal proteins (Table 1).
These results suggest that the opposing and central
domains inhibit activity by some form of stearic hind-
rance, and that binding by either effector protein alle-
viates this inhibition and encourages their respective
activity. A schematic presentation of these results is
shown in Fig. 2.
Table 1. Role of the R domain in regulation of adenylylation activity. Adenylylation assays using AT and C domain truncation constructs.
These assays show the changes in activity of AT
wt
(purified), AT-C:432–946 (purified), AT-C:551–946 (purified), AT-C:607–946 (cell lysate)
and AT-DR:1–440- - -628–946 (cell lysate) under various conditions. Activity was assessed by determining the adenylylation state of GS by
measuring the production of c-glutamyl hydroxamate with various combinations of effector molecules present in the assay. Standard assay
conditions were used (50 n
M GS, 25 nM AT ⁄ 0.6 lM construct, 25 nM PII, 1 mM Gln). All the C-terminal truncation constructs were used in
the assay at 0.6 l
M rather than 0.025 lM (AT
wt
), to give similar activity levels to that of the whole AT protein. The AT-C:607–946 and
AT-DR:1–440- - -628–946 construct preparations were partly purified, so their concentrations were being determined approximately from
bands in western blots. The first 5 min were fitted with a linear regression using Microsoft Excel. The R
2
coefficients for these curves are
usually > 0.9. The initial rates for all the proteins are expressed as a proportion of their standard activity, and the number following in paren-
theses is the relative activities expressed as the rate per l
M. All the truncation constructs have a similar molar activity, which is approxi-
mately 10-fold less than that of wild-type AT.
Condition
Protein
AT
wt
(N-Q1-R-Q2-C)
(0.025 l
M)
AT-C:432–946
[N(10)-Q1-R-Q2-C]
(0.6 lM)
AT-C:551–946
[R(55)-Q2-C]
(0.6 lM)
AT-C:607–946
(Q2-C)
(0.6 lM)
AT-DR:1–440- - -628–946
(N-C)
(0.2 lM)
+ PII + Gln 1.00 (67.2) 1.00 (5.5) 1.00 (6.3) 1.00 (4.6) 1.00 (7.7)
– PII + Gln 0.28 0.99 0.98 1.05 0.91
+ PII-Gln 0.39 0.35 0.49 0.30 0.15
– PII-Gln 0.06 0.34 0.49 0.28 0.17
Domain structure of adenylyltransferase P. Clancy et al.
2868 FEBS Journal 274 (2007) 2865–2877 ª 2007 The Authors Journal compilation ª 2007 FEBS
Epitope mapping of AT mAbs using truncation
constructs
mAbs to full-length AT were produced during the
course of this study using established protocols [20].
Initially, a panel of 10 mAbs was screened in ELISA
using the overlapping constructs AT-N:1–548 and
AT-C:425–946 (data not shown). Five mAbs were
chosen for further characterization. The AT mAb
6B5 was chosen because it only bound to AT-N:1–
548 and was therefore denoted the N domain mAb.
The two mAbs 5A7 and 39G11 bound in the overlap-
ping region of AT-N:1–548 and AT-C:425–946, and
were therefore denoted the R domain mAbs. The two
mAbs 6A3 and 27D7 only bound to AT-C:425–946,
and were therefore denoted the C domain mAbs. Cell
lysates from all of the AT truncation constructs,
and complete AT, were separated by 12% SDS ⁄
PAGE and immunoblotted with purified N + C
polyclonal mix, 6B5, 5A7, 6A3, 27D7 or crude 39G11
(Fig. 3).
The N domain mAb 6B5 binds somewhere in the
first 423 residues of the protein, as the mAb can detect
all the N-terminal truncation constructs tested and
intact AT, but not the C-terminal constructs starting
at AT-C:432–946 (Fig. 3). A further truncation con-
struct, AT-N:1–311, was also detectable using mAb
6B5 (data not shown). Therefore, this mAb binds
somewhere in the first 311 residues of AT.
On the other hand, the two C domain mAbs, 6A3
and 27D7, showed the opposite pattern, where all of
the C-terminal constructs were detected and none of
the N-terminal truncations starting with AT-N:1–548
were detected (Fig. 3). Therefore, these mAbs bind in
the last 305 residues of the protein, i.e. the region from
residues 642 to 946. A further truncation construct,
AT-C:712–946, was not detectable by the two C
domain mAbs (data not shown). Therefore, these two
mAbs bind between residues 642 and 711, which is the
adenylylation catalytic site.
Both of the R domain mAbs detected the
AT-RQ2: 463–627 truncation construct. mAb 39G11
Adenylylation
AT+PII
“open
adenylylation
conformation”
AT
“closed conformation”
AT-C:432-946
AT-ΔR:1-440 628-946
AT-C:551-946 AT-C:607-946
N
N
C C C C C
R
C
R R
R
N
Deadenylylation
AT
“closed conformation”
C
R
N
AT+PII-UMP
“open
deadenylylation
conformation”
C
R
N
AT-N:1-440
N
UMP
UMP
UMP
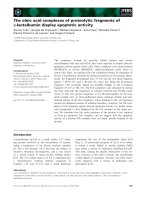
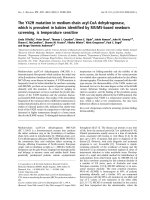
Fig. 2. Schematic representation of the different truncations of AT in adenylylation and deadenylylation. The activity results from the adenyly-
lation and deadenylylation assays are summarized in this diagram. The adenylylation active site is shown in white, and is accessible to GS in
all the conformations except the uncomplexed ‘closed’ conformation, and the deadenylylation active site, shown in gray, is accessible to
GS-AMP in all conformations except the uncomplexed ‘closed’ conformation. Uncomplexed AT has a ‘closed’ conformation and has minimal
activity in either assay. Removal of the N or R domains gives rise to polypeptides with similar adenylylation activity to that of PII-complexed
AT, and removal of the R + C domain gives rise to a polypeptide that has activity independent of PII-UMP in deadenylylation. Addition of PII
to the adenylylation assay or PII-UMP to the deadenylylation assay causes a shift in the position of the N domain relative to the C domain,
and AT adopts the ‘open’ conformation. The complexed AT is then capable of adenylylating GS or deadenylylating GS-AMP, depending on
the other effectors present in the assay.
P. Clancy et al. Domain structure of adenylyltransferase
FEBS Journal 274 (2007) 2865–2877 ª 2007 The Authors Journal compilation ª 2007 FEBS 2869
does not detect AT-N:1–423 to AT-N:1–467, on
the N-terminal side, but does detect AT-N:1–501
and AT-N:1–548 (residues 468–501). On the C-ter-
minal side, mAb 39G11 detects AT-C:466–946 and
does not detect from AT-C:508–946 onwards (resi-
dues 466–507) (Fig. 3). Therefore, this mAb binds
somewhere in the region between residues 468 and
501.
mAb 5A7 does not detect AT-N:1–423 to AT-N:
1–501, on the N-terminal side, but does detect AT-N:
1–548 (residues 502–548), and on the C-terminal
side it has the same binding profile as mAb 39G11
B
G
6B5
(N-terminal)
C
39G11
(R domain)
D
5A7
(R domain)
E
6A3
(C-terminal)
F
27D7
(C-terminal)
324-1:N-TA
TA
044-1:N-
T
A
764-1:N-TA
105-1:N-TA
845-1:N-TA
72
6
-
364:2QR-TA
105-1:N-TA
105-1:N-TA
845-1:
N-TA
84
5
-
1:N
-T
A
7
2
6
-
364:2QR-TA
72
6
-
364:2
Q
R-T
A
TA
TA
TA
TA
649-23
4
:C-TA
649-234:C-TA
649-
23
4:C-TA
64
9-
234:
C-TA
64
9-
664:C-TA
649
-66
4:C-TA
649-664:C-TA
64
9-664
:C-TA
649-1
5
5:C-TA
64
9-15
5:C-TA
649-706:C-TA
64
9-7
0
6:C-TA
649-2
4
6:C-TA
64
9-2
46:C-TA
64
9-80
5:C-TA
649-805:C-TA
A
Polyclonal N+C mix
32
4
-1
:N
-TA
04
4
-
1:
N-
T
A
10
5-
1
:N-
T
A
764-1:N
-
T
A
845-1:N-TA
726-364:2QR-TA
TA
649-234:C-TA
64
9
-66
4
:C
-
TA
6
4
9
-
8
0
5:C-TA
64
9
-15
5
:C
-
TA
649-706:C-TA
649-246:C-TA
48kD
50kD
54kD
58kD
64kD
18kD
108kD
59kD
55kD
50kD
46kD
39kD
35kD
Deadenylylation domain Adenylylation domain
Central R
domain
6B5 39G11 6A3&27D7
5A7
1
311 467 501
641
711
946
501
507
Domain structure of adenylyltransferase P. Clancy et al.
2870 FEBS Journal 274 (2007) 2865–2877 ª 2007 The Authors Journal compilation ª 2007 FEBS
(residues 466–507) (Fig. 3). Therefore, this mAb binds
somewhere in the region between residues 502 and
507.
Mapping PII and PII-UMP-binding sites using AT
mAbs
The adenylylation reaction requires the PII protein
and Gln as the allosteric effectors, whereas the
deadenylylation reaction requires the uridylylated
form of the effector protein PII-UMP and a-KG as
the allosteric effectors. In order to determine the
effects of the various mAbs on the enzymatic activit-
ies of AT, purified N domain mAb, 6B5, was added
to either the adenylylation or deadenylylation assay
at a molar ratio of 10 : 1, and was found to have no
effect on either of the activities of AT (data not
shown). This suggests that mAb 6B5 binds at a site
(within residues 1–311) that does not influence activ-
ity directly or indirectly by blocking cofactor binding
or any related conformational changes. Similarly, the
two C domain mAbs, 6A3 and 27D7, also had no
impact on deadenylylation under these conditions,
and only partially inhibited adenylylation, by 73%
and 52%, respectively. These mAbs also partially
inhibited the adenylylation activity of all the PII-
independent C-terminal truncation constructs (data
not shown), suggesting that these mAbs, which bind
in the catalytic site (residues 642–711), are affecting
the interaction with GS.
These results are biologically interesting because
they show that blocking one activity does not con-
sequently influence the opposing activity. This obser-
vation demonstrates the necessity to regulate both
opposing activities in a coordinated manner, as other-
wise the activity of GS is not regulated properly.
In addition, these results suggest that mAbs 6A3
and 27D7, whose binding site overlaps b-polymerase
motif BPM2, do not bind to BPM1. Apparently,
BPM1, which has a homologous amino acid sequence
to BPM2 [11], is not antigenically similar to BPM2.
Inhibition of PII binding in adenylylation
by R domain mAbs
Similarly, the two R domain mAbs, 39G11 and 5A7,
were used in adenylylation assays with AT and
AT-C:432–946 to investigate the impact of these mAbs
on adenylylation activity (Fig. 4). Intact AT and the
PII-independent truncated construct, AT-C:432–946
(R-Q2-C), were chosen for these assays because they
were shown to bind the two R domain mAbs (Fig. 4)
and were fully soluble.
Preincubation of the two R domain mAbs, 5A7 and
39G11, in the adenylylation assay mix with intact AT
resulted in a reduction of adenylylation activity
(Fig. 4), but neither of these mAbs had an impact on
the adenylylation activity of the AT-C:432–946 trunca-
tion construct (Fig. 4). This result implies that the ade-
nylylation activity of AT is probably inhibited by
mAbs 5A7 and 39G11 via inhibition of a signaling
event. To corroborate this finding, PII was omitted
from the adenylylation assay, and the results show that
whereas omission of PII had no impact on AT-C:432–
946, intact AT was inhibited to the same level as when
the mAbs 5A7 or 39G11 were present with PII
(Fig. 4). This result implies that the binding of mAbs
5A7 or 39G11 prevents the PII binding that is neces-
sary to fully stimulate adenylylation in intact AT.
Inhibition of PII-UMP binding in deadenylylation
by R domain mAbs
Likewise, the two R domain mAbs, 39G11 and 5A7,
were tested in the deadenylylation assay with AT, in
order to investigate the impact of these mAbs on
deadenylylation activity. Interestingly, both 5A7 and
39G11 (data not shown) completely eliminated the
deadenylylation activity of intact AT (Fig. 4).
Omission of PII-UMP from the deadenylylation
assay also completely eliminated the activity in intact
AT, but not in AT-N:1–440, which has been shown to
be PII-UMP independent [12]. In order to show that
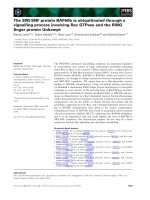
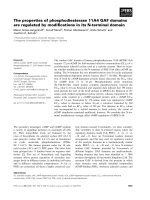
Fig. 3. Monoclonal antibody-binding regions of the AT protein. (A) Western blot analysis of 12% SDS ⁄ PAGE gel of whole cell extracts for
the various truncation constructs using a purified mix of AT-N:1–548 and AT-C:425–946 polyclonal antibody for detection. The bands indica-
ting the appropriate induced polypeptides are marked with arrows. The mAbs were screened against all the truncation constructs, but only
the truncation constructs that bound to the mAbs are presented: (B) purified 6B5; (C) crude 39G11; (D) purified 5A7; (E) purified 6A3; (F)
purified 27D7. The N domain mAb 6B5 also detected a truncation construct comprising the first 311 amino acids of the protein (data not
shown), so this mAb binds somewhere in the first 311 residues of the protein. The two R domain mAbs bind in the N-terminal region of this
domain, with mAb 39G11 binding in the region between residues 468 and 501, and mAb 5A7 binding in the region between residues 502
and 507. From this panel of constructs, the two C domain mAbs, 6A3 and 27D7, appear to bind between residues 642 and 946, i.e. the last
305 residues of the AT protein. However, they do not detect a smaller C-terminal truncation construct, AT-C:712–946 (data not shown), so
they are actually binding somewhere in the adenylylation catalytic site. (G) Monoclonal antibody binding regions within AT. Also shown in
the diagram are the b-polymerase motifs (BPM1 and BPM2) [11] and the two Q-linkers (Q1 and Q2) [14].
P. Clancy et al. Domain structure of adenylyltransferase
FEBS Journal 274 (2007) 2865–2877 ª 2007 The Authors Journal compilation ª 2007 FEBS 2871
the inhibition of deadenylylation is via the prevention
of PII-UMP binding, the assay was slightly modified
so that no a-KG was added and twice as much
GS-AMP and PII-UMP protein was added to the
assay. Under these in vitro conditions, PII-UMP was
the only effector responsible for the stimulated deade-
nylylation activity. In this modified condition, both
5A7 and 39G11 completely inhibited the deadenylyla-
tion activity of intact AT (Table 2).
Discussion
Previous work demonstrated that AT had two
domains with catalytic activity at either end of the pro-
tein [10,11]. Examination of the protein sequence sug-
gested that there were two Q-linkers flanking a central
region that separated the protein into three domains
(N-Q1-R-Q2-C), in contrast to the previous suggestion
of a two-domain protein [10].
The crystallization of AT-N:1–440 demonstrated
that the N-terminal region of AT before the first Q-lin-
ker is a biologically relevant, complete domain con-
taining the deadenylylation active site [13]. Assay data
obtained using various truncation constructs indicated
that the central domain acted as a regulatory domain
(see later).
Indirect evidence from equivalent assay results with
the entire AT protein where the R domain mAbs have
been added or the effector protein omitted suggest
that both the R domain mAbs are blocking the bind-
ing of PII or PII-UMP. This means the two effector
proteins are probably binding somewhere in or near
the R domain antibody-binding region between resi-
dues 466 and 507 in the N-terminal region of the cen-
tral R domain. Whether the two forms of PII are
binding at exactly the same site or not cannot be
Shift in AT activity with
addition of either R domain
mAb or removal of PII
[ytivitcaSG γ ]HG-
)nim/llew/lomn(
A
No shift in activity of AT-
C:432-946 with addition of
either R domain mAb or
removal of PII
[ytivitcaSG γ ]HG-
)nim/llew/lomn(
B
Shift in AT activity with
addition of either R domain
mAb or removal of PII-UMP
[
yt
i
v
itcaSG γ ]
H
G
-
)n
i
m/llew/lomn(
C
-1
14
0
90
Time (min)
-1
14
0
90
Time (min)
0
27
0
90
Time (min)
Fig. 4. Inhibition of activity in AT and truncation constructs by
R domain mAbs. These assays show the changes in activity of (A)
AT and (B) the C-terminal truncation construct AT-C:432–946 in
adenylylation with R domain mAbs 5A7 and 39G11 present [no
AT ⁄ AT-C:432–946 + PII + Gln (dark blue), AT ⁄ AT-C:432–946 +
PII + Gln (pink), AT ⁄ AT-C:432–946 - PII + Gln (red), AT ⁄ AT-C:432–
946 + PII + Gln + 5A7 (green), AT ⁄ AT-C:432–946 + PII + Gln +
39G11 (blue)] and (C) AT in deadenylylation with R domain
mAb 5A7 present [no AT + PII-UMP + a-KG (dark blue),
AT + PII-UMP + a-KG (pink), AT + PII-UMP + a-KG (red), AT + PII-
UMP + a-KG + 5A7 (green)]. Standard assay conditions (50 n
M GS ⁄
GS-AMP, 25 n
M AT ⁄ 0.6 lM construct, 25 nM PII ⁄ PII-UMP, 1 mM
Gln ⁄ 20 mM a-KG) were used, and the mAbs were preincubated
with AT ⁄ AT-C:432–946 (1 : 1) for 30 min at room temperature. All
assays were performed in duplicate and with AT
wt
as a reference.
Error bars have not been shown on the curves, as they hinder
visual inspection. The standard error range for all the curves is
generally < 0.4.
Table 2. Inhibition of PII-UMP binding by R domain mAbs 5A7 and
39G11. This table shows the initial deadenylylation activity of AT
stimulated only by PII-UMP, in the presence and absence of the
R domain mAbs 5A7 and 39G11. The activity was determined
using initial rate assays, which measured the production of c-gluta-
myl hydroxamate (c-GH) by GS-AMP. The curves were fitted with a
linear regression using Microsoft Excel, and the resulting rates are
shown here. The R
2
coefficient for each curve is shown in paren-
theses.
Condition
Deadenylylation rate
(nmol of c-GH
produced per well
per min per min)
GS-AMP + AT + PII-UMP + a-KG 3.12 (1.00)
2 · GS-AMP + AT + 2· PII-UMP-a-KG 0.54 (1.00)
2 · GS-AMP + AT + 2 · PII-UMP-a-KG
+ 5A7
0.00
2 · GS-AMP + AT + 2 · PII-UMP-a-KG
+ 39G11
0.00
Domain structure of adenylyltransferase P. Clancy et al.
2872 FEBS Journal 274 (2007) 2865–2877 ª 2007 The Authors Journal compilation ª 2007 FEBS
ascertained from these data. The fact that the two
effector proteins are probably binding in the R do-
main further supports the notion that it has a regula-
tory role. The GlnK paralog and its uridylylated form
were also used in assays with and without R domain
mAbs in the same way as PII and PII-UMP, and
showed the same activity inhibition patterns (data not
shown), suggesting they also bind somewhere in this
region.
When the deadenylylation domain and ⁄ or R domain
are removed from AT, the resulting polypeptides
become independent of PII in adenylylation. These
results suggest that the R domain regulates adenylyla-
tion activity by interacting with the N domain, so that
its position relative to the C domain blocks the ade-
nylylation capacity of AT (‘closed conformation’ in
Fig. 2).
Although all of these truncation constructs had
activity independent of PII binding, they were reliant
on Gln for full adenylylation activity, which suggests
that the binding site for Gln is within the C domain,
rather than the R domain. Although direct binding of
Gln was not demonstrated, the fact that its removal
from the assay reduced adenylylation activity for all
the C-terminal constructs shows it definitely binds to
the C-terminal domain of AT.
Similarly, deadenylylation activity is also indepen-
dent of PII-UMP when the R and C domains are
removed. Therefore, in the ‘closed conformation’
(Fig. 2), deadenylylation activity is also blocked. A
similar phenomenon is seen in the enzyme activities
present in the N-terminal domain of aspartokinase-
homoserine dehydrogenase I [21]. Removal of either of
the activity domains resulted in a decrease in the regu-
lation of the activity of the remaining domain.
The binding of PII or PII-UMP somewhere within
the N-terminal region of the R domain may alter the
resting state conformation that exists between the two
opposing domains, resulting in an ‘open conformation’
(Fig. 2), which allows adenylylation or deadenylylation
to proceed, depending on the effector molecules pre-
sent. This model does not provide any insights into
how uridylylation of the PII effector protein causes
deadenylylation activity to be favored over adenyly-
lation activity when the AT protein is in its ‘open
conformation’.
AT is approximately 1000 times more active in
deadenylylation than the PII-UMP-independent N
domain polypeptide and 10 times more active in ade-
nylylation than the PII-independent C domain poly-
peptides. This suggests that when either effector
protein binds to entire AT, the respective active site ⁄
domain adopts a more suitable conformation for the
appropriate reaction, allowing it to proceed more effi-
ciently than in the truncation constructs.
The signal of PII or PII-UMP binding is transmitted
to the activity domains of AT, presumably by con-
formational changes in the domains and ⁄ or Q-linkers.
In Fig. 5A, a speculative mechanism based on secon-
dary structure prediction is suggested for the allevi-
ation of stearic hindrance by the opposing domain in
the ‘open conformation’ model (Fig. 2). On the basis
of sequence and truncation analysis, it appears that
the Q1-linker contains an amphipathic helix (residues
448–461) with a hydrophobic face, and the potential
PII ⁄ PII-UMP binding region contains three helices,
the third of which is also amphipathic with a hydro-
phobic face (residues 498–516) (Fig. 5B). This fits with
the observation that AT-C:466–946 (R-Q2-C) is far
less soluble than AT-C:432–946 [N(10)-Q1-R-Q2-C]
(data not shown).
It is possible that the hydrophobic face of the amphi-
pathic helix in the Q1-linker interacts with the hydro-
phobic face of the third helix in the N-terminal region
of the R domain (Fig. 5C) and the binding of either
effector protein disrupts the interaction, so the N and
R domains are separated, allowing AT to adopt the
‘open conformation’. The further changes that occur in
the protein so that adenylylation is favored over deade-
nylylation and vice versa, depending on the effec-
tor protein present, can only be determined by
crystallization of AT complexed to the PII and PII-
UMP proteins.
To conclude, in this work we have refined the
domain structure of the bifunctional AT enzyme by
providing compelling evidence for the presence of a
central regulatory domain flanked by the two activity
domains. Specific mAbs that bind AT in the R domain
probably block the binding of the effector proteins PII,
GlnK, PII-UMP and GlnK-UMP, supporting the con-
cept that the central domain plays a regulatory role.
Experimental procedures
Bacterial strains, media and growth conditions
All the E. coli strains (primer sequences are available on
request) were grown in LB medium supplemented, when
appropriate, with ampicillin (100 lgÆL
)1
), chloramphenicol
(25 lgÆL
)1
) [BL21(DE3)RecA] or ammonium chloride
(0.5% w ⁄ v for expression of adenylylated GS in DH5a).
Bacterial strains containing pND707-derived vectors
(thermoinducible k promoter) [22] were cultured at 37 °C,
and induction was carried out by rapid shift to 42 °Cat
A
595
0.5–0.6 with further culture for 2 h. Bacterial strains
containing the T7-based expression plasmid pETDW2
P. Clancy et al. Domain structure of adenylyltransferase
FEBS Journal 274 (2007) 2865–2877 ª 2007 The Authors Journal compilation ª 2007 FEBS 2873
(derived from pETMCS1)-derived vectors were cultured
continuously at 37 °C, and protein overexpression was
induced with isopropyl thio-b-d-galactoside (0.4 mm at A
595
0.5–0.6) at 18 °C, with further culture for 2 h. This vector
was used for expression of truncation constructs, which had
poor solubility when expressed at 37 °C in the thermoin-
ducible pND707 vector.
DNA manipulations
Standard DNA manipulations were carried out essentially
as described previously [23]. Oligonucleotides (sequences
are available on request) used for PCR amplification and
nucleotide sequence determination were from AusPep Pty
Ltd (Parkville, Australia). DNA sequencing was carried out
Fig. 5. Analysis of the Q1-linker and PII ⁄ PII-UMP-binding region. (A) Structural prediction for the Q1-linker and PII ⁄ PII-UMP-binding region
covering residues 441–520. H, helix; C, coil; E, sheet (
EXPASY: APSSP). (B) Top view representation of the predicted helical region in Q1 and
the third helix of the R domain (
EXPASY: HELIXWHEEL). The respective amino acids and their relative positions in the helix are indicated on the
helical wheel. The hydrophobic residues [32] are italicized and highlighted in red, and the hydrophilic ⁄ polar residues are in normal text. (C)
Schematic representation of the Q1-linker and PII ⁄ PII-UMP-binding region of the R domain. The hydrophobic side of the a-helix in Q1 (shown
in red) is possibly associated with the hydrophobic face in the third helix in the N-terminal region of the R domain (shown in red). Binding of
PII or PII-UMP in this region (shown in blue) may disrupt the interaction between the two hydrophobic faces, causing them to separate, and
consequently relieving the stearic hindrance between the two opposing domains.
Domain structure of adenylyltransferase P. Clancy et al.
2874 FEBS Journal 274 (2007) 2865–2877 ª 2007 The Authors Journal compilation ª 2007 FEBS
using the ABI Prism Big-Dye terminator kit (Perkin Elmer,
Waltham, MA, USA), using primer 9 or M13 universal pri-
mer for pND707 and its derivatives, and primers PETT7FP
or PETRP for pETMCSI-derived plasmids. The plasmids
used in this work were produced in the E. coli strains
DH5a, TG1 and JM109, and detailed descriptions of their
production can be obtained from the authors.
Protein solubility analysis
The solubility of proteins was analyzed essentially as des-
cribed previously [24]. Cells of a 50 mL culture were harves-
ted by centrifugation (8000 g, Avanti J-20, Beckman Coulter,
JLA16.250), and the resulting pellet was resuspended in lysis
buffer (25% sucrose, 50 mm Tris, pH 8.0, 1 mm EDTA, pro-
tease inhibitor cocktail), at 1 mL of buffer per 1 g of wet
cells. Lysozyme was added to a final concentration of
0.1 mgÆL
)1
, and after incubation of the solution on ice for
10 min, the cells were lysed by three freeze–thaw cycles in
liquid nitrogen and water (37 °C), respectively, to provide
whole cell extracts. The supernatant was obtained after cen-
trifugation of the remaining cell extract at 100 000 g for
20 min at 4 °C (Avanti J-20, JA-25.50). Equal volumes
(10 lL) of cell-free extract and supernatant for each con-
struct were separated by SDS ⁄ PAGE (10% w ⁄ v), transferred
to nitrocellulose membrane, and detected with mouse poly-
clonal antibodies against AT. Protein concentration was
measured using the Coomassie Blue G-250 protein assay dye
(Bio-Rad, Hercules, CA, USA).
Gel electrophoresis and western blot analysis
The proteins were routinely analyzed under denaturing con-
ditions on a 10% SDS polyacrylamide gel [25]. For quanti-
fication, the AT domains were blotted onto nitrocellulose
and probed with AT polyclonal antibodies or mAbs. The
bands recognized by the primary antibodies were visualized
with alkaline phosphatase-conjugated secondary antibodies
following incubation in an alkaline phosphatase buffer
containing nitroblue tetrazolium and 5-bromo-4-chloro-3-
indolyl phosphate. Protein bands on PAGE gels or on west-
ern blots were scanned in a Foto Analyst Archiver
(Fotodyne, Hartland, WI, USA). The scanning data were
analyzed with imagequant V 1.1 software (Molecular
Dynamics, Sunnyvale, CA, USA).
Production of polyclonal antibodies
Mice were inoculated weekly with purified protein. The first
priming inoculation was administered intraperitoneally
using Freund’s complete adjuvant in a double emulsion
(protein 50 lgÆL
)1
, 200 lL per mouse). The boosting inocu-
lations used Freund’s incomplete adjuvant at the same
protein concentration. The final prefusion boost also invol-
ved an intravenous injection of 10–20 lL (50 lgÆL
)1
in
NaCl ⁄ P
i
) into the tail vein. Antibody titers were measured
using ELISA. When the antibody response had maximized
in the ELISA (typically around 5 weeks from the initial pri-
ming inoculation), 400 lL of mouse sarcoma 180 cells [26]
were inoculated intraperitoneally with the second last boost.
The ascitic fluid was harvested 4 days after the final boost.
Production and characterization of hybridomas
Groups of 10 BALB ⁄ c mice (same sex), 8–10 weeks old,
were inoculated intraperitoneally at 4, 6 and 9 weeks with
50 lg of purified AT protein, and monitored by ELISA
for antibody responses. A double emulsion in Freund’s
complete adjuvant was given as the primary inoculation
[20], and Freund’s incomplete adjuvant was used for the
ensuing boosts. To maximize the immune response at the
time of splenic harvest, an extra 10 lL inoculation of pro-
tein diluted to 200 lgÆL
)1
in NaCl ⁄ P
i
was inoculated intra-
venously (30 gauge needle) into the tail vein. This extra
boost was given 4 days before harvest. Splenocytes from the
primed mouse and myeloma cells (Sp2 ⁄ 0) [27] were fused
using 50% poly(ethylene glycol) [28] to form hybridomas.
Hybrid cells formed from the correct partners were selec-
ted using hypoxanthine (0.00136% w ⁄ v), aminopterin
(0.00018% w ⁄ v) and thymidine (0.00038% w ⁄ v) (Sigma,
St Louis, MO, USA ) in the culture medium. Hybridoma
cells secreting antibodies were selected using ELISA. The
AT mAbs were cloned by limiting dilution, and ascitic fluid
was produced [20]. The isotypes of all the mAbs were deter-
mined using a kit produced by Sigma as per the manufac-
turer’s instructions.
Purification of mAbs
The clarified mAb solution was purified using protein A
agarose chromatography and the MAPS II purification
system (Bio-Rad) in the low-pressure chromatography
EconoSystem (Bio-Rad), following the manufacturer’s
protocol.
Protein elution was detected with a UV monitor at k
280 nm. There was only one elution peak. The fractions
were pooled, and a small aliquot was removed for analysis
by SDS ⁄ PAGE and ELISA. The purified mAb was concen-
trated, and the buffer exchanged back to the MAPS II bind-
ing buffer (Bio-Rad) using an Ultrafree 15 mL concentrator
(Millipore, Billerica, MA, USA). The concentration of the
purified protein (mAb) was determined as described above.
Purification of N-terminal and C-terminal
truncations of AT
The truncated AT proteins AT-N:1–548, AT-N:1–501,
AT-N:1–440, AT-C:432–946, AT-C:466–946 and AT-C:
P. Clancy et al. Domain structure of adenylyltransferase
FEBS Journal 274 (2007) 2865–2877 ª 2007 The Authors Journal compilation ª 2007 FEBS 2875
551–946 were purified for further characterization using
methods described previously [10]. The remaining trunca-
tion constructs were used as cell-free extracts, or crude
lysates where solubility was an issue.
The proteins used in the assays were also purified follow-
ing methods described previously: AT from pRJ009 in
JM109 [10], UT from pNV101 in AN1459 [10] and GS
from pJRV001 in RB9017 [29]. The adenylylation state of
GS was determined by methods described previously
[30,31].
GS adenylylation and deadenylylation assay
The adenylylation ⁄ deadenylylation of GS was monitored as
the rate of formation of c-glutamylhydroxamate, utilizing
the c-glutamyl transferase activity of GS, as described pre-
viously [30]. The c-glutamyl transferase activity was meas-
ured in microtiter plates at 30 °C as described previously
[10,31].
Acknowledgements
The authors would like to thank various workers for
the production of truncation constructs: Dr Rene Jaggi
for most of the N domain constructs, Daying Wen for
many of the C domain constructs, Ryan O’Donnell for
the construct with the R domain removed, and Jason
Vaughn for the GS construct.
References
1 Woolfolk CA & Stadtman ER (1964) Cumulative feed-
back inhibition in the multiple end-product regulation
of glutamine synthetase activity in Escherichia coli. Bio-
chem Biophys Res Commun 17, 313–319.
2 Woolfolk CA & Stadtman ER (1967) Regulation of glu-
tamine synthetase. 3. Cumulative feedback inhibition of
glutamine synthetase from Escherichia coli. Arch Bio-
chem Biophys 118, 736–755.
3 Magasanik B, Hanley KA, Lee JJ, Blaney JE Jr,
Murphy BR & Whitehead SS (1993) The regulation of
nitrogen utilization in enteric bacteria. J Cell Biochem
51, 34–40.
4 Stadtman ER (2001) The story of glutamine synthetase
regulation. J Biol Chem 276, 44357–44364.
5 Jiang P, Peliska JA & Ninfa AJ (1998) Enzymological
characterisation of the signal-transducing
uridylyltransferase ⁄ uridylyl-removing enzyme (EC
2.7.7.59) of Escherichia coli and its interaction with the
PII protein. Biochemistry 37, 12782–12794.
6 Kamberov ES, Atkinson MR, Feng J, Chandran P &
Ninfa AJ (1994) Sensory components controlling
bacterial nitrogen assimilation. Cell Mol Biol Res 40,
175–191.
7 Jiang P, Peliska JA & Ninfa AJ (1998) The regulation
of Escherichia coli glutamine synthetase revisited: role
of 2-ketoglutarate in the regulation of glutamine synthe-
tase adenylylation state. Biochemistry 37, 12802–12810.
8 Ninfa AJ & Atkinson MR (2000) PII signal transduc-
tion proteins. Trends Microbiol 8, 172–179.
9 Arcondeguy T, Jack R & Merrick M (2001) P
II
signal
transduction proteins, pivotal players in microbial nitro-
gen control. Microbiol Mol Biol Rev 65, 80–105.
10 Jaggi R, van Heeswijk WC, Westerhoff HV, Ollis DL &
Vasudevan SG (1997) The two opposing activities of
adenylyltransferase reside in distinct homologous
domains, with intramolecular signal transduction.
EMBO J 16, 5562–5571.
11 Holm L & Sander C (1995) DNA polymerase b belongs
to an ancient nucleotidyl transferase superfamily. Trends
Biochem Sci 20, 345–347.
12 Xu Y, Wen D, Clancy P, Carr PD, Ollis DL &
Vasudevan SG (2004) Expression, purification, crystalli-
zation and preliminary X-ray analysis of the N-terminal
domain of Escherichia coli ATase. Protein Expr Purif
34, 142–146.
13 Xu Y, Zhang R, Joachimiak A, Carr PD, Huber T,
Vasudevan SG & Ollis DL (2004) Structure of the
N-terminal domain of Escherichia coli glutamine
synthetase adenylyltransferase. Structure 12, 861–869.
14 Wootton JC & Drummond MH (1989) The Q-linker: a
class of interdomain sequences found in bacterial
multidomain regulatory proteins. Protein Eng 2,
535–543.
15 Severinova E, Severinova K, Fenyo D, Marr M, Brody
EN, Roberts JW, Chait BT & Darst SA (1996) Domain
organisation of the Escherichia coli RNA polymerase
sigma 70 subunit. J Mol Biol 263, 637–647.
16 Scheich C, Leitner D, Sievert V, Leidert M, Schlegel B,
Simon B, Letunic I, Bussow K & Diehl A (2004) Fast
identification of folded human protein domains
expressed in E. coli suitable for structural analyses.
BMC Struct Biol 4, doi:10.1186 ⁄ 1472-6807-4-4.
17 Rost B & Sander C (1993) Prediction of protein second-
ary structure at better than 70% accuracy. J Mol Biol
232, 584–599.
18 Rost B & Sander C (1994) Combining evolutionary
information and neural networks to predict protein
structure. Proteins 19, 55–72.
19 Yi J, Cheng H, Andrake MD, Dunbrack RL, Roder H
& Skalka AM (2002) Mapping the epitope of an inhibi-
tory monoclonal antibody to the C-terminal DNA-bind-
ing domain of HIV-1 integrase. J Biol Chem 277,
12164–12174.
20 Goding JW (1983) Monoclonal Antibodies: Principles
and Practice. Academic Press, London.
21 James CL & Viola RE (2002) Production and character-
isation of bifunctional enzymes. Domain swapping to
Domain structure of adenylyltransferase P. Clancy et al.
2876 FEBS Journal 274 (2007) 2865–2877 ª 2007 The Authors Journal compilation ª 2007 FEBS
produce new bifunctional enzymes in the aspartate path-
way. Biochemistry 41, 3720–3725.
22 Love CA, Lilley PE & Dixon NE (1996) Stable high-
copy-number-bacteriophage lambda promoter vectors
for overproduction of proteins in Escherichia coli. Gene
176, 49–53.
23 Vasudevan S, Reilander H, Maul G & Michel H (1991)
Expression and cell membrane localization of rat M3
muscarinic acetylcholine receptor produced in Sf9 insect
cells using the baculovirus system. FEBS Lett 283,
52–56.
24 Grisshammer R & Nagai K (1995) DNA Cloning 2: a
Practical Approach: Expression. IRL Press, Oxford.
25 Laemmli UK (1970) Cleavage of structural proteins dur-
ing the assembly of the head of the bacteriophage T4.
Nature 227, 680–685.
26 Tikasingh ES, Spence L & Downs WG (1966) The use
of adjuvant and sarcoma 180 cells in the production of
mouse hyperimmune ascitic fluids to arboviruses. Am
J Trop Med Hyg 15, 219–226.
27 Schulman M, Wilde CD & Kohler G (1978) A better
cell line for making and secreting specific antibodies.
Nature 276, 269–270.
28 Harlow E & Lane D (1988) Antibodies, a Laboratory
Manual. Cold Spring Harbor Laboratory Press, Cold
Spring Harbor, NY.
29 Shapiro BM & Stadtman ER (1970) Glutamine synthe-
tase (Escherichia coli). Methods Enzymol 17A, 910–922.
30 Stadtman ER, Smyrniotis PZ, Davis JN & Wittenberger
ME (1979) Enzymatic procedures for determining the
average state of adenylylation of Escherichia coli gluta-
mine synthetase. Anal Biochem 95, 275–285.
31 van Heeswijk WC, Hoving S, Molenaar D, Stegeman B,
Kahn D & Westerhoff HV (1996) An alternative PII
protein in the regulation of glutamine synthetase in
Escherichia coli. Mol Microbiol 21, 133–146.
32 Engelman DM, Steitz TA & Goldman A (1986) Identi-
fying non-polar transbilayer helices in amino acid
sequences of membrane proteins. Annu Rev Biophys Bio-
phys Chem 15, 321–353.
P. Clancy et al. Domain structure of adenylyltransferase
FEBS Journal 274 (2007) 2865–2877 ª 2007 The Authors Journal compilation ª 2007 FEBS 2877