Báo cáo khoa học: Gene expression waves Cell cycle independent collective dynamics in cultured cells doc
Bạn đang xem bản rút gọn của tài liệu. Xem và tải ngay bản đầy đủ của tài liệu tại đây (656.28 KB, 9 trang )
Gene expression waves
Cell cycle independent collective dynamics in cultured cells
Masa Tsuchyia
1
, Sum T. Wong
2
, Zhen X. Yeo
3
, Alfredo Colosimo
4
, Maria C. Palumbo
4
,
Lorenzo Farina
5
, Marco Crescenzi
6
, Alessia Mazzola
6
, Rodolfo Negri
7
, Michele M. Bianchi
7
,
Kumar Selvarajoo
1
, Masaru Tomita
1
and Alessandro Giuliani
6
1 Institute for Advanced Biosciences, Keio University, Yamagata, Japan
2 Bioinformatics Institute, Singapore
3 Genome Institute of Singapore, Singapore
4 Physiology and Pharmacology Department, University of Rome ‘La Sapienza’, Italy
5 Department of Computer and Systems Science, University of Rome ‘La Sapienza’, Italy
6 Istituto Superiore di Sanita’, Environment and Health Department, Rome, Italy
7 Department of Cell and Developmental Biology University of Rome ‘La Sapienza’, Italy
Much of the success in molecular genetics has been
accomplished by setting aside the concerns about the
possible existence of a collective organized behaviour
of cultured cells. Cell cultures were considered as ergo-
dic ensembles of independent units (cells) randomly
scattered in different phases of their biological cycle.
This allowed us to refer any result to a sort of ‘average
cell’ and then base the interpretation of the data com-
ing from millions of cells present in a culture on
molecular level considerations [1,2]. The presence of a
coordinated behaviour of cells in the plate requires
complementing these average cell explanations with
another level of analysis, relative to the ‘culture-as-a-
whole’. The observation of synchronization of cultured
yeast cells in terms of transcriptional activity led to the
notation that collective modes of whole population of
cells indeed influence transcriptional machinery. This
synchronization, having a characteristic frequency
much faster than (and recognized as a multiple of) the
cell cycle, was ascribed in yeast to metabolic cycles in
which the entire culture alternates between reductive
and oxidative phases [2,3]. Klevecz et al. [2] made the
prediction of the widespread presence of these collec-
tive modes not only in yeast, but also in mammalian
cultured cells. The same prediction is at the basis of
two other recent studies [4,5] describing a sort of ‘tem-
poral architecture of eukaryotic growth’ consisting of
genome wide oscillations in transcription acting as a
Keywords
cell–cell communication; metabolic cycle;
microarray; ribogenesis cycle; systems
biology
Correspondence
A. Giuliani, Istituto Superiore di Sanita’,
Environment and Health Department, Viale
Regina Elena 299, 00161, Rome, Italy
Fax: +39 0649 902999
Tel: +39 0649 902579
E-mail:
(Received 1 March 2007, revised 28 March
2007, accepted 3 April 2007)
doi:10.1111/j.1742-4658.2007.05822.x
The ergodic hypothesis, which assumes the independence of each cell of the
ensemble from all the others, is a necessary prerequisite to attach single cell
based explanations to the grand averages taken from population data. This
was the prevailing view about the interpretation of cellular biology experi-
ments that typically are performed on colonies of billions of cells. By ana-
lysing gene expression data of different cells going from yeast to
mammalian cell cultures, we demonstrate that cell cultures display a sort of
‘ecology-in-a-plate’ giving rise to a rich dynamics of gene expression that
are independent from reproductive cycles, hence contradicting simple ergo-
dic assumptions The aspecific character of the observed coordinated gene
expression activity inhibits any simple mechanistic hypothesis and high-
lights the need to consider population effects in the interpretation of data
coming from cell cultures.
Abbreviation
PCA, principal component analysis.
2878 FEBS Journal 274 (2007) 2878–2886 ª 2007 The Authors Journal compilation ª 2007 FEBS
sort of metronome; this interpretation was further clar-
ified by Tu and McKnight [6].
Beside the mechanistic bases of such oscillatory
behavior, a still neglected point in our opinion is that
such oscillations imply some sort of coordination
among cells, and an exploration of the origins of such
coordinated behaviour could be of importance.
Bacteria are able to communicate with each other
through the accumulation of specific signalling mole-
cules that enable each bacterium to sense the number
of surrounding bacteria (cell density): this mechan-
ism, called quorum sensing, is responsible for huge
structures called biofilms, which often cover the sur-
face of ponds and lakes and can be considered as
rudimental forms of multicellular organization [7,8].
Recent evidence suggests that yeast too exhibits
quorum sensing and that this type of regulation is
based on signals carried by aromatic alcohols [9]. As
in bacteria, quorum sensing in yeast seems to be
linked to the onset of spatial organization of colon-
ies that, in the presence of a shortage of nutrients,
optimize the use of resources. The quorum sensing
phenomenon demonstrates the ability of populations
of unicellular organisms to behave as a coordinated
whole, thus, at least in principle, giving a biological
plausibility to a between-cells coordinated genome
expression activity.
When we consider mammalian cells, at the level of
tissues and organs, cell ensembles need to be coordi-
nated, thus escaping from the ergodic assumption cor-
respondent to the complete independence among the
individuals inside a population and the consequent
equivalence between temporal and population statis-
tics so that a behaviour observed at the colony level
can be immediately referred to a single cell. The non-
ergodicity at tissue level (e.g. the synchronization of
nodal cells in heart) is necessary for a coherent beha-
viour corresponding to the physiological activity of
the tissue to be put into operation. This coordination
can be achieved in a number of ways (e.g. hormonal,
nervous and neuroendocrine signalling). However, no
similar observation was made in the case of cultured
cells other than the observation of crossed nutrition
linked to the need for a critical mass of cells to start
a viable colony [10].
We investigate, in plate conditions, whether organ-
ized behaviour can be considered as a universal cellular
property, in terms of synchronized gene expression.
Using temporal microarray data, we demonstrate: (a)
asynchronous (in terms of reproductive cycle) cultures
display the same gene expression modes as synchron-
ous yeast cultures; (b) the presence of cell cycle inde-
pendent transcription modes in mammalian cultured
cells; and (c) the involvement of the entire transcrip-
tome in the observed dynamics without any preference
for specific classes of genes (e.g. those involved in
metabolic cycles).
Our result points to the presence of a highly
ordered, coordinated, genome wide mRNA abundance
dynamics of cultured cells, indicating the fallacy of the
ergodic hypothesis for cell populations in culture and
the need to consider population level phenomena when
interpreting gene expression studies.
Results
Synchronous and asynchronous ribogenesis
related gene expression data of yeast possess
ordered dynamics
The SMALL data set was analysed for the mutual
correlation of the 17 genes’ (14 ribogenesis + 3 trans-
cription factors) expression values between the syn-
chronous (synchronization method: pheromone alpha)
and asynchronous series made of 18 time points in the
range 0–120 min at 7 min intervals. All the expression
time series were strongly correlated between the asyn-
chronous and synchronous modes with a Pearson r in
the range 0.88 (FHL1 gene) to 0.99 (RPP2A gene) and
an average correlation of 0.93.
The almost total consistency between the synchron-
ous and asynchronous time course of gene expression
implies that the oscillations of the above genes are not
pure noise but follow a still unknown ordered dyna-
mics. Thus, we analysed the matrix with the different
time points relative to the asynchronous condition as
statistical units and the different gene expressions as
variables by means of principal component analysis
(PCA) in order to find the signature of a nonrandom
temporal structure. We discovered the presence of the
by far most important first mode (PC1) explaining
59% of total gene variability. The existence of a ‘ribo-
genesis cycle’ had been proposed previously [3–5] so
we initially concentrated on the ribogenesis gene set.
To give more strength to our result, we shift our focus
from a set of 14 genes (SMALL) to the entire ribogene-
sis-related set of genes consisting of 275 ORFs
(WHOLE) and repeated the above analysis. As in the
SMALL set, we found a striking correlation between
asynchronous ⁄ synchronous time courses for the 275
WHOLE gene set (average Pearson correlation 0.90;
SD ¼ 0.07).
This points to a basically cell cycle independent
correlation structure of the entire ribogenesis gene
set. This set (WHOLE), when submitted to PCA as
for the asynchronous condition, generated a first
M. Tsuchyia et al. Collective behaviour of cultured cells
FEBS Journal 274 (2007) 2878–2886 ª 2007 The Authors Journal compilation ª 2007 FEBS 2879
mode explaining the 54% of total variability, showing
an effective dimensionality of the system very similar
to the set of 14 genes despite the different number
of genes.
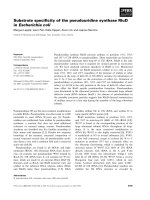
The time courses of the first mode of the whole set
of 275 ribogenesis genes (pc1whole) and of the subset
of 14 genes (pc1small) are compared in Fig. 1(A),
which shows the scores of the first principal compo-
nents for both data sets.
As is evident from the figure, not only pc1whole
and pc1small have the same relative importance in
the organization of the variability of the two sets
(54% and 59%, respectively), but also they have an
almost coincident time course, pointing to the same
dynamical process.
Synchronous and asynchronous randomly
selected gene expression data of yeast possess
ordered dynamics
To answer the question of whether the process is ribo-
some-specific, we performed the same analysis on 275
randomly selected genes from the entire yeast genome
repository. The results obtained were absolutely coin-
cident with the results obtained in the two previous
analyses, with a synchronous ⁄ asynchronous average
Pearson correlation of 0.89 (SD ¼ 013) obtained for
the the random extracted genes set that is not signifi-
cantly different from ribosome set whereas the first
mode of the random set (pc1rand) explained the 52%
of total gene variability. Spearman correlation gave
identical results.
It is worth considering the list of the few genes that
did not display a significant correlation between the
asynchronous and synchronous modes (Table 1).
It is also worth noting how the majority of the genes
that escape from the strict synchronous ⁄ asynchronous
correlation out of the set of 275 genes are strictly cor-
related with the pheromone alpha specific mechanism
of action (Table 1, indicated by an asterisk). More-
over, MFA1 is both the gene less correlated between
synchronous and asynchronous modes and the one
most directly involved in the pharmacological effect of
pheromone alpha. This provides indirect but very
strong proof for both the ‘pharmacological synchroni-
zation’ independence of the observed genome wide
oscillations and the fact that specific pharmacological
effects are superimp superimposed on genome wide
oscillations interrupting the spontaneous oscillation of
the affected transcripts.
The time course of the random gene selection first
mode (pc1rand) is completely coincident (Pearson r ¼
0.95) with that of the ribogenesis mode (Fig. 1B).
Random gene selection first mode is more similar to
the whole ribogenesis selection than the small ribo-
genesis set, and a partial correlation exploiting the
mutual interrelation among pc1whole, pc1small and
pc1rand excluded the ribogenesis cycle as the driving
force of the observed pattern, showing that the
pc1small–pc1whole correlation is driven by their
mutual correlation with pc1rand, thus indicating an
aspecific (from the point of view of the biological role
of the involved genes) character of the extracted mode.
In order to obtain an idea of the amount of vari-
ation at the single gene level explained by the above
described mode, we calculated a scale independent
index of the range of variation of each of the 7160
ORFs in the yeast data set for the asynchronous
condition. For the ith ORF, this index, which we
Fig. 1. (A) First mode dynamics of the SMALL and WHOLE data
sets. The two data sets refer to 14 and 275 ribogenesis related
genes, respectively. (B) First mode dynamics of 275 randomly
extracted (RAND) and 275 ribogenesis related (WHOLE) genes.
Collective behaviour of cultured cells M. Tsuchyia et al.
2880 FEBS Journal 274 (2007) 2878–2886 ª 2007 The Authors Journal compilation ª 2007 FEBS
denominated as normrange (normalized range), was
equal to:
NormrangeðiÞ¼ðMAX À minÞÁmin
À1
ð1Þ
where MAX and min are the maximal and minimal
transcription values scored in the 18 time points,
respectively. Normrange scored a median value of 5.41
(i.e. an almost five-fold variation in transcription, which
is well above the threshold usually set for identifying the
genes whose activity is modified by a given treatment)
and a very positively skewed distribution (skewness ¼
12.51), resulting in a mean value of 96. This mean value
(and the extremely high standard deviation of 585) is
reminiscent of many genes having an on ⁄ off regulation
during the time course studied. Globally, these statistics
reveal a very coherent oscillation that is not simply
interpretable in terms of random noise.
When considering the dual space (GENOME data
set) having the 7160 ORFs as statistical units and the
18 time points as variables, we obtain a complement-
ary view of the same phenomenon. In this case, we
shift from the actual transcription values (used in the
previous analyses) to their normalized counterparts
(each ORF subtracted of the mean and divided by its
standard deviation), so as to avoid the presence of a
trivial size component capturing the quasi-totality of
the variance. The dual character of this space with
respect to the previous analyses implies the projection
of the time points on the loading space instead of the
score space [13,14].
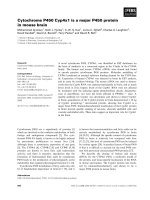
Figure 2 illustrates the first mode of the whole ribo-
genesis set (scores) and of the entire genome (loa-
dings), respectively.
Notwithstanding the relevant differences (change of
reference space from genes to samples, 7160 ORFs
versus 275 ribogenesis genes, normalized versus abso-
lute data) between the two analyses, the first mode
(pc1genome) of GENOME space is very strictly corre-
lated (r ¼ –0.75, note that the sign of the component
is arbitrary) with the first mode of the WHOLE set as
depicted in Fig. 2(C) reporting the correlation between
the scores (WHOLE) and the loadings (GENOME
data set) of the time points in the two analyses.
Genome wide oscillatory behaviour observed
with no specific link to a physiological role
in yeast
In order to confirm the above results with an inde-
pendent experiment, we applied PCA to the data
(asynchronous data set) relative to the elutriation
experiment. The analysed data set had the 14 time
samples as rows, each separated by 30 min, and the
275 ribogenesis related genes (RIBO) and 275 random
extracted genes (RAND) as columns. For both data
sets, we extracted the first three components (pcribo1–
pcribo3 and pcrand1–pcrand3), respectively. The first
component explained 54.5% and 55.4% of the total
variance in RIBO and RAND sets, respectively, con-
firming the alpha-factor results with respect to the
relative importance of the first mode in the explanation
of genome wide expression variability. The second
and third components too had the same eigenvalue
distribution in both RIBO and RAND data sets
(pcribo2 ¼ 12.8, pcribo3 ¼ 9.3; pcrand2 ¼ 12.08,
pcrand3 ¼ 8.7%). Moreover, the between-component
Table 1. Genes with the lowest synchronous ⁄ asynchronous correlation. The table reports all genes from the 275 random set which escape
from strict sync ⁄ async correlation. The majority are directly linked with the pheromone alpha specific mechanism of action (as indicated by
an asterisk).
Gene ontology
Synchronous ⁄ asynchronous
correlation Biological role
MFA1 0.083 Mating pherormonepheromone alpha factor*
CIS3 0.106 Cell wall construction of buds*
SWE1 0.315 G
2
⁄ M transition, cyclin dependent*
CHS1 0.353 Cytokinesis, activated by pherormonepheromone alpha*
TSL1 0.395 Bud emergence, sporulation*
HXT2 0.46 Glucose transporter, regulated by starvation
PHD1 0.491 Pseudohyphal growth*
IME4 0.492 Sporulation, starvation dependent*
CIT2 0.545 Tricarboxylic acid cycle
AQY1 0.548 Spore maturation*
PNC1 0.56 Replicative life span regulator*
AFR1 0.571 Alpha factor pherormonepheromone regulator*
PCL1 0.571 Cyclin dependent kinase
M. Tsuchyia et al. Collective behaviour of cultured cells
FEBS Journal 274 (2007) 2878–2886 ª 2007 The Authors Journal compilation ª 2007 FEBS 2881
scores Pearson correlation scored a near to unity value
(pcrand1–pcribo1 ¼ 0.98, pcrand2–pcribo2 ¼ 0.96,
pcrand3–pcribo3 ¼ 0.91), indicating a strict concor-
dance in the temporal modes coming from the two
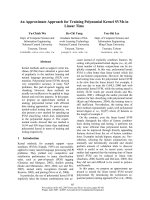
sets. Figure 3 reports the first three modes of the
RAND data set. It is worth noting the pcrand1 scales
with an elutriation cell cycle that is considerably slower
(due to the ethanol with respect to the glucose carbon
source) than the alpha-factor experiment. Conse-
quently, instead of the approximately 20 min periodic-
ity observed for alpha-factor experiment, we have a
2-h periodicity for the first component of the elutria-
tion set. This finding is in accordance with the hypo-
thesis of a coupling between the duration of the
metabolic and reproductive cycles [1–6], even if in this
case we demonstrated the general character of the
genome wide oscillation with no specific link to any
physiological role of the interested genes.
Human fibroblasts cell cycle independent ordered
dynamics
Having demonstrated the presence of relevant collec-
tive modes of gene expression in yeast, we looked for
evidence of the same phenomenon in other cellular
systems.
We analysed the data by Cho et al. [11] relative to
the cell cycle of human fibroblasts (SALK data set). In
this case, we have no asynchronous experiment and
the cells were synchronized by means of double thymi-
dine block. Nevertheless, we know in advance the cells
display an 18 h cycle; thus, any mode displaying a sen-
sible different characteristic frequency can be safely
interpreted as demonstrating cell cycle independent
collective dynamics. In this case too, we adopted a
completely unsupervised approach by calculating the
PCA over the matrix having the expression values rel-
ative to 7077 ORF (base 2 logarithm of the ratio
Fig. 3. The first three modes (pc1rand1–pc1rand3) of the gene
expression dynamics for the elutriation data set.
Fig. 2. (A) First mode of WHOLE data set (the same as in Fig. 1B).
(B) First mode dynamics of the GENOME data set; due to the
change of reference frame, here the loadings are reported. (C) The
correlation between the WHOLE and GENOME data sets.
Collective behaviour of cultured cells M. Tsuchyia et al.
2882 FEBS Journal 274 (2007) 2878–2886 ª 2007 The Authors Journal compilation ª 2007 FEBS
between the actual expression value at each time point
and the average value over the entire time span) as
rows (statistical units) and 13 time points sampled at
2 h intervals from t
0
to t
24
as columns (variables). We
performed three separate PCAs for the entire data set
(whole) and for two independent random extractions
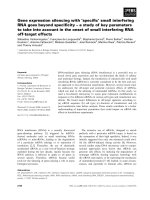
of 275 ORFs (small1, small2). Figure 4 reports the first
mode of the three analyses, showing a remarkable
homogeneity across different data sets and an approxi-
mate period of 8 h, which is completely distinct from
the cell cycle periodicity.
The between modes Pearson correlation coefficients
near to unity indicates the non-noisy character of the
extracted modes, pointing to the highly coordinated
gene expression behaviour of these cells.
HeLa cells display whole genome cell cycle
independent ordered dynamics
The last data set we analysed was taken from the
study by Whitfield et al. [12] dealing with HeLa cell
cycle. The authors were aware of the presence of spu-
rious ‘modes’ in the data when analysed with singular
value decomposition (practically correspondent to
PCA), which they attributed to experimental artefacts.
Similarly, when we analysed the data, we discovered
that such modes and their wild nonstationarity led
us to interpret them along the same line as Whitfield
et al. [12]. However, when we studied the data
with the usual whole genome ⁄ small random selection
strategy, we discovered the presence of the same
modes in both the whole genome and small random
selection situations.
These modes had a different relative weight in terms
of the percent of variance explained but, nevertheless,
were very repetitive across the two conditions, thus
pointing to a coordinated response of the cell culture
shaping its gene expression dynamics.
Figure 5 reports the data relative to one of the
experiments by Whitfield et al. [12]. Each panel of the
figure compares a mode of the entire genome expres-
sion dynamics with a corresponding mode relative to a
small 275 genes extraction. Overall, there is a marked
invariance of the dynamics across the whole genome
and the random selection (global canonical correlation
between the whole and small sets ¼ 0.95).
Discussion
To date, the presence of massive gene expression syn-
chronization was shown to be due to presence of meta-
bolic cycles [1,3,4]. We show that the most relevant
oscillations of transcriptional activities are due to func-
tionally aspecific modes, involving the whole transcrip-
tome rather than being confined to specific classes of
genes involved in metabolic cycles. Our result suggests
the presence of robust and nonrandom modes in asyn-
chronous yeast cultures, basically independent of the
biological function of genes. We also demonstrate
aspecific mRNA abundance waves for mammalian cell
cultures. We still are unable to comment on the mecha-
nistic causes of these waves, or the way they could also
be linked to changes of mRNA degradation rates
instead of changes in transcription activity. What is
crucial in our opinion is that these results point to a
nonergodic behavior of cell cultures and to a sort of
‘ecology-in-a-plate’ that could change our perspective
with respect to interpreting microarray data.
What could be the advantage to cells of maintaining
self-sustained gene expression cycles? A possible
answer comes from the the Prisoner’s dilemma scheme
[15], a classical game theory paradigm explaining
‘altruistic’ behavior where the long-term advantage for
the colony is selected over the small-term advantage
for the individual. The mutual collaboration between
neighbouring cells ends up being a selective advantage
for the population as a whole, which may contribute
to the establishment of cyclic behaviour of alternate
Fig. 4. The first mode for the entire genome data set and two ran-
dom extractions of genes relative to the SALK data set. It is worth
noting that the main mode explains a much lower percentage of
variation with respect to yeast analyses (approximately 17–19%
compared to 50–60%), but nevertheless maintains a very strong
invariance between different choices of genes.
M. Tsuchyia et al. Collective behaviour of cultured cells
FEBS Journal 274 (2007) 2878–2886 ª 2007 The Authors Journal compilation ª 2007 FEBS 2883
‘production’ and ‘stealing’ phases relative to some
extracellular protein needed by the colony as a whole.
An intriguing candidate is the lectin-like protein
involved in flocculation, a cell wall protein that binds
to mannose chains on the surface of other cells to
provide the physical substrate for colony formation
(flocculation, a crucial step in quorum sensing). Other
explanations are based on observed gene waves in
yeast, which alternate between oxidative and reductive
phases, optimizing the protection of DNA synthesis
with respect to reactive oxygen species [4,6].
Our data, however, seem to suggest a relative inde-
pendence of the transcription waves from the repro-
ductive cycle as well as specific biological processes,
and we prefer not to go too deep into the possible
molecular mechanisms or functional consequences of
having a ‘basic rhythm’ sustaining the transcription
dynamics.
Fig. 5. The pairwise comparison of modes extracted from the whole data set (HeLa cell cycle experiment number 3) and a small random
selection from the same set. There is the possibility to recognize the same modes in the two sets even if they have a relative different
importance in the two situations (the numbering of the modes is related to their ranking in terms of explained variance).
Collective behaviour of cultured cells M. Tsuchyia et al.
2884 FEBS Journal 274 (2007) 2878–2886 ª 2007 The Authors Journal compilation ª 2007 FEBS
Some basic features of the observed dynamics
worthy of further comment
First, the metabolic origin of these oscillations is plaus-
ible, as well as their indirect link with the reproductive
cycle in so far as any reproductive activity necessarily
calls for the preliminary fulfillment of some energetic
requirements.
Second, there is a widespread presence throughout
extremely different cell types, from yeast to human
fibroblasts. Besides that, within each cell type, the
involvement of the whole genome, and not of function-
ally specialized subsets of genes, is demonstrated. Once
again, such a generalized and aspecific character of gene
expression waves could in principle be reconciled with
some very basic anabolic and ⁄ or catabolic activity.
Third, the tendency of any cell population to behave
as a whole, namely to synchronize some fundamental
functions independently from the reproductive behav-
ior, requires looking for some form of communication
between cells in the culture that probably is linked to
reaching a critical density.
The threshold population density above which such a
collective behavior starts to emerge depends on a num-
ber of largely unknown internal (cell type) and external
(environmental) conditions. In this respect, any predic-
tion based upon the artificial reproductive synchroniza-
tion usually induced by chemicals appears useless.
Fourth, the nature and role of the signals synchron-
izing the activity of cultured cells still largely remains
unknown. The literature in this field, for obvious prac-
tical reasons, mainly deals with artificially induced
rather than naturally occurring synchronization. It is
difficult, however, to overemphasize the role of the lat-
ter type of phenomena for understanding the higher
hierarchies of cellular organization, from tissue to the
organ level.
All in all, our nonergodic hypotheses challenge the
consideration of a cell culture as an ‘average cell’, as
well as the automatic assignment to the molecular ⁄
single cell level of any kind of observation made on
cultured cells. The demonstration of a rich and repeat-
able dynamics in cell cultures uncovers the existence of
a sort of ‘ecology-in-a-plate’, making another level
of explanation worthy of special attention: the level of
the colony as a whole. It seems fair to predict that
many findings will accumulate along this avenue of
research.
Although coordinated cellular activity is obvious in
tissues and organs, no similar finding exists in the case
of cultured cells other than the observation of crossed
nutrition linked to the need for a critical mass of cells
to start a viable colony [10].
We investigate, in plate conditions, whether organ-
ized behaviour can be considered as a universal cellular
property, in terms of synchronized gene expression,
Using temporal microarray data, we demonstrate: (a)
asynchronous (in terms of reproductive cycle) cultures
display the same gene expression modes as synchronous
yeast cultures; (b) the presence of cell cycle independent
transcription modes in mammalian cultured cells; and
(c) the involvement of the entire transcriptome in
the observed dynamics without any preference for spe-
cific classes of genes (e.g. those involved in metabolic
cycles).
Our result points to the presence of a highly
ordered, coordinated, genome wide mRNA abundance
dynamics of cultured cells, indicating the fallacy of the
ergodic hypothesis for cell populations in culture and
the need to consider population level phenomena when
interpreting gene expression studies.
Experimental procedures
The data sets
The first data set we analysed was the yeast cell cycle data
set from the pheromone alpha synchronization factor
experiment [16], relative to both synchronous and asynchro-
nous cell cultures. The analysed time series consisted of 18
time points sampled at 7 min intervals. This data set was
studied under different forms: (a) statistical units ¼ 18 sub-
sequent times, variables ¼ 14 ribogenesis related genes + 3
transcription factors known to be responsible of the regula-
tion of the ribosome genes (SMALL); (b) statistical
units ¼ 18 subsequent times, variables ¼ 275 ORFs consti-
tuting the entire set of ribogenesis genes (WHOLE); (c)
statistical units ¼ 18 subsequent times, variables ¼ 275
ORFs sampled at random (RAND) and (d) statistical
units ¼ 6378 genes for which we have the full data,
variables ¼ 18 time subsequent time points (GENOME).
Analysis relative to (b) and (c) structures were repeated
with data from elutriation experiment using the asynchro-
nous cultures data and considering both a random collec-
tion of genes and the 275 ribogenesis genes.
The existence of relevant and stable collective modes sha-
ping the dynamics of yeast gene expression in asynchronous
cultures prompted us to look for gene expression waves in
other biological systems. Due to the lack of such data in an
asynchronous situation comparable to the yeast data, we
analysed data sets from two different reproductive cycle
synchronized systems, namely human fibroblasts [12] and
HeLa cells [13].
The emergence of collective modes endowed with charac-
teristic times that were completely different from the cell
cycle in both these two systems was demonstrated in the
space having time points as variables and both the entire
M. Tsuchyia et al. Collective behaviour of cultured cells
FEBS Journal 274 (2007) 2878–2886 ª 2007 The Authors Journal compilation ª 2007 FEBS 2885
set of genes and small random extractions from the whole
set as rows.
Statistical methods
The discovery of collective modes in transcriptome data sets
was performed by means of PCA [17,18]. The analysed data
sets were studied on both row and column spaces by alter-
nating analyses having the expression entities of different
ORFs as variables (and consequently different time points
as statistical units) and analyses having time points as vari-
ables (and consequently different ORFs as statistical units).
The use of PCA allowed us to detect highly anharmonic
and nonstationary modes without being limited to station-
ary oscillations.
In the case of time samples as variables, different normal-
ization methods were applied in order to eliminate the pres-
ence of overwhelming ‘size’ components linked to the trivial
existence of huge differences in the level of transcription of
different ORFs. We used the classical z-score (zero mean,
unit standard deviation) normalization for yeast data
whereas human fibroblast and HeLa data were expressed in
terms of the reported logarithm ratio. The gene-by-gene
correlation between synchronous and asynchronous data
was assessed by means of both Pearson and Spearman cor-
relation coefficients.
Acknowledgements
The authors acknowledge the continuous exchange of
ideas with their colleagues on these themes, especially
Dr Margherita Bignami and Dr Romualdo Benigni.
This work is supported by ‘Differing Fields Collabor-
ation Grant’, JST CREST and the Ministry of Educa-
tion, Culture, Sports, Science and Technology of
Japan (MEXT).
References
1 Klevecz RR & Murray DB (2001) Genome-wide oscilla-
tions in expression ) wavelet analysis of time series data
from yeast expression. Mol Biol Reports 28, 73–82.
2 Klevecz RR, Bolen J, Forrest G & Murray DB (2004)
A genome wide oscillation in transcription gates DNA
replication and cell cycle. Proc Natl Acad Sci USA 101,
1200–1206.
3 Tu BP, Kudlicki A, Rowicka M & McKnight SL (2005)
Logic of the yeast metabolic cycle: temporal compart-
mentalization cellular processes. Science 310, 1152–1158.
4 Reinke H & Gatfield G (2006) Genome wide oscillations
in transcription in yeast. Trends Biochem Sci 31,
189–193.
5 Lloyd D & Murray DB (2006) The temporal architec-
ture of eukaryotic growth. FEBS Lett 580, 2830–2834.
6 Tu BP & McKnight SL (2006) Metabolic cycles as an
underlying basis of biological oscillations. Nat Rev Mol
Cell Biol 7, 696–701.
7 Horswil AR, Stoodley P, Stewart PS & Parsek R (2007)
The effect of the chemical, biological, and physical
environment on quorum sensing in structured microbial
communities. Anal Bioanal Chem 387, 371–380.
8 Stoodley P, Sauer K, Davies DG & Costerton JW
(2002) Biofilms as complex differentiated communities.
Annu Rev Microbiol 56, 187–209.
9 Hogan DA (2006) Quorum Sensing: alcohol a social
situation. Current Biol 16, R457–R458.
10 Todaro GJ, Lazar GK & Green H (1965) The initiation
of cell division in a contact-inhibited cell line. J Cell
Physiol 66, 325–333.
11 Cho RJ, Huang MX, Campbell MJ, Dong H, Steinmetz
L, Sapinoso L, Hampton G, Elledge S, Davis RW &
Lockhart DJ (2001) Transcriptional regulation and
function during the human cell cycle. Nat Genet 27,
48–54.
12 Whitfield ML, Sherlock G, Saldanha AJ, Murray JI,
Ball CA, Alexander KE, Matese CJ, Perou CM, Hurt
MM, O’Brown P et al. (2002) Mol Biol Cell 13,
1977–2000.
13 Roden JC, King BW, Trout D, Mortazavi A, Wold BJ
& Hart CE (2006) Mining gene expression data by inter-
preting principal components. BMC Bioinformatics 7,
194.
14 Wang A & Gehan E (2005) Gene selection for micro-
array data using principal components analysis. Stat
Med 24, 2069–2071.
15 Greig D & Travisano M (2003) The Prisoner’s dilemma
and polymorphism in yeast SUC genes. Proc R Soc
Lond B Biol Sci 271 (Suppl. 3), S25.
16 Spellman PT, Sherlock G, Zhang MQ, Iyer VR,
Anders K, Eisen MB, Brown PO, Botstein D & Futcher
B (1998) Comprehensive identification of cell cycle-
regulated genes of the yeast Saccharomyces cerevisiae by
microarray hybridization. Mol Biol Cell 9, 3273–3297.
17 Benigni R & Giuliani A (1994) Quantitative modelling
and biology: the multivariate approach.
Am J Physiol
266, R1697–R1704.
18 Holter NS, Maritan A, Cieplak M, Banavar JR &
Fedoroff NF (2000) Fundamental patterns underlying
gene expression profiles: simplicity from complexity.
Proc Natl Acad Sci USA 97, 8409–8415.
19 Yoon JW, Godsill S, Kupce E & Freeman R (2006)
Deterministic and statistical methods for reconstructing
multidimensional NMR spectra. Magn Reson Chem 44,
197–209.
Collective behaviour of cultured cells M. Tsuchyia et al.
2886 FEBS Journal 274 (2007) 2878–2886 ª 2007 The Authors Journal compilation ª 2007 FEBS