Car Ownership and Mode of Transport to Work in Ireland* potx
Bạn đang xem bản rút gọn của tài liệu. Xem và tải ngay bản đầy đủ của tài liệu tại đây (398.61 KB, 34 trang )
The Economic and Social Review, Vol. 41, No. 1, Spring, 2010, pp. 43–75
Car Ownership and Mode of Transport to
Work in Ireland*
NICOLA COMMINS and ANNE NOLAN**
The Economic and Social Research Institute, Dublin
Abstract: Rapid economic and demographic change in Ireland over the last decade, with associated
increases in car dependence and congestion, has focused policy on encouraging more sustainable
forms of travel. In this context, knowledge of current travel patterns and their determinants is
crucial. In this paper, we extend earlier Irish research to examine the joint decision of car
ownership and mode of transport to work. We employ cross-section micro-data from the 2006
Census of Population to estimate discrete choice models of car ownership and commuting mode
choice for four sub-samples of the Irish population, based on residential location. Empirical results
suggest that travel and supply-side characteristics such as travel time, costs, work location and
public transport availability, as well as demographic and socio-economic characteristics such as
age and household composition have significant effects on these decisions.
I INTRODUCTION
A
s a result of rapid economic and demographic change over the last decade,
and the resulting increase in car ownership, Ireland has experienced
many of the problems associated with increasing car dependence. Over the
period 1996-2006,
1
the population of Ireland grew by 16.9 per cent while the
43
* The authors would like to thank ESRI seminar participants and particpants at the Irish
Economic Association Annual Conference 2009 and 4th Kuhmo-Nectar Conference on Transport
Economics 2009 in Copenhagen for helpful comments on an earlier draft.
** Corresponding author: Tel: 8632022; Fax: 8632100; Email:
Paper delivered at the Twenty-Third Annual Conference of the Irish Economic Association,
Blarney, Co. Cork, April 24-26, 2009.
1
Economic activity has contracted sharply since late 2007. Unemployment reached 12.0 per cent
in the second quarter of 2009 (Central Statistics Office, 2009a), a return to net emigration is
forecast for 2009 and 2010 (Barrett et al., 2009) and new car registrations fell by 63.6 per cent
between March 2008 and March 2009 (Central Statistics Office, 2009b).
03 Commins-Nolan article_ESRI Vol 41 25/02/2010 14:31 Page 43
numbers in employment increased by 47.6 per cent, largely due to increases in
the rate of female participation in the labour force and inward migration. In
terms of the implications for transport, the most striking is the increase in
new vehicle registrations, which increased by over 60 per cent over the period
(Central Statistics Office, 2007). Data for journeys to work, school and college
confirm this shift towards the private car; the proportions driving to work
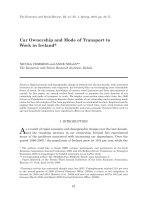
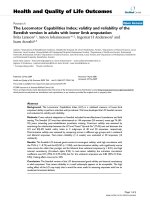
increased from 46.3 per cent in 1996 to 57.1 per cent in 2006 (see Figure 1),
while the proportion of primary school students travelling as car passengers
increased from 35.8 per cent in 1996 to 55.0 per cent in 2006, overtaking the
proportions walking (24.3 per cent), which has traditionally been the primary
means of transport to school for this age-group (Central Statistics Office,
2004)
.
The resulting levels of congestion impact on all those using the road and
public transport network; in the Dublin area, average journey speeds in the
morning peak for car and bus
2
decreased by 12.4 per cent and 6.2 per cent
respectively between 2003 and 2004 (Dublin Transportation Office, 2005).
44 THE ECONOMIC AND SOCIAL REVIEW
Figure 1: Mode of Transport to Work, 1986, 1996 and 2006
(Percentage of all Commuters
2
Bus speeds on Quality Bus corridor routes (that is, routes with dedicated road space for buses)
only.
Source: CSO Census Interactive Tables (www.cso.ie).
03 Commins-Nolan article_ESRI Vol 41 25/02/2010 14:31 Page 44
There are also wider economic impacts, with carbon dioxide emissions from
transport increasing by 88.7 per cent between 1996 and 2006 (Lyons et al.,
2008).
Environmental considerations imply a need to reverse or at the very least
to halt this shift in favour of the private car. Current policy focuses on a
variety of measures that seek to limit or redirect travel demand in the short
to medium term and encourage alternative more sustainable land-use
strategies in the longer term (see Department of Transport, 2008a, 2008b;
Dublin Transportation Office, 2001, 2006a, 2006b; European Commission,
2007; Fitz Gerald et al., 2008; Morgenroth and Fitz Gerald, 2006). Investment
in public transport and measures which seek to use existing infrastructure
more efficiently such as improved cycle and bus lanes, parking restrictions,
road pricing, carpooling etc. are all considered necessary if a shift away from
the private car towards more sustainable methods of transport such as
walking, cycling and public transport is to be achieved. Current initiatives
include the provision of tax relief for the purchase of public transport tickets
and bicycles for commuting trips with more severe measures such as urban
road pricing or the introduction of a carbon tax proposed but yet to be
implemented.
In this context, knowledge of the factors influencing the demand for
passenger transport is crucial. In this paper we concentrate on transport
demand for a specific journey purpose, namely the journey to work, and
examine the influence of demographic, socio-economic and supply-side factors
on choice of mode of transport for the journey to work in Ireland in 2006 using
discrete choice econometric methodologies. We extend previous Irish research
to incorporate the endogeneity of the car ownership decision by estimating a
joint model of car ownership and mode of transport to work. The 2006 Census
of Population also contains detailed information on home and work location for
the full population of working individuals, allowing us to consider the
influence of proximity to rail connections for the first time. Section II discusses
previous literature in the area, both international and Irish. Section III
describes the data and provides some descriptive statistics, while Section IV
describes the econometric methodology employed. Section V presents
empirical results and Section VI concludes.
II PREVIOUS RESEARCH
Internationally, there is an extensive research literature on the
determinants of various aspects of travel behaviour, and in particular
commuting behaviour. Due to the nature of such decisions, and the data
CAR OWNERSHIP AND MODE OF TRANSPORT TO WORK IN IRELAND 45
03 Commins-Nolan article_ESRI Vol 41 25/02/2010 14:31 Page 45
available, discrete or qualitative choice methods such as multinomial or
conditional logit
3
are typically employed. The models are grounded in
consumer utility theory whereby the individual chooses among alternatives
with the aim of maximising personal utility. Ben-Akiva and Lerman (1975)
apply the multinomial logit methodology to the choice between a number of
different alternatives for the journey to work in Washington, and find
particularly significant effects for lifecycle and public transport availability.
Aside from modal choice, the multinomial logit methodology has been
extensively applied to other transport decisions such as the number of cars to
own (Alperovich et al., 1999; Bhat and Pulugurtha, 1998 and Cragg and Uhler,
1970); choice of car type (Lave and Train, 1979 and McCarthy, 1996); tourist
destination (Eymann and Ronning, 1997) and choice of departure time
(McCafferty and Hall, 1982). A number of studies have analysed mode choice
for other journey purposes, using a variety of methods (see Cohen and Harris,
1998) for trips to visit friends and relatives, Domencich and McFadden (1975)
for shopping trips, Ewing et al. (2004) for mode choice for the journey to
school and McGillivray (1972) for other journey purposes including personal
business, visiting friends and relations, shopping and other recreation).
Asensio (2002); De Palma and Rochat (2000); Dissanayake and Morikawa
(2005); Thobani (1984) and Train (1980) all use the nested multinomial logit
methodology to estimate modal choice for the journeys to work in Barcelona,
Geneva, Bangkok, Karachi and San Francisco respectively. The nested
multinomial logit model overcomes the restrictive requirement of the
multinomial logit methodology to have distinct and independent alternatives.
More recent versions of the nested multinomial logit model (such as the
generalised or cross-nested logit) have been developed to incorporate
situations in which correlations exist between alternatives across nests as well
as alternatives within nests, thus allowing for the incorporation of related
decisions such as car ownership or residential/employment location (see for
example, Vega and Reynolds-Feighan, 2008 and Salon, 2009).
4
Much of the early research on Irish travel patterns was carried out in the
context of research on the sustainability of residential and commercial
development (see for example, MacLaran and Killen, 2002; McCarthy, 2004
46 THE ECONOMIC AND SOCIAL REVIEW
3
The multinomial logit and conditional logit models differ in the type of explanatory variables
that can be included; the conditional model can support individual-specific as well as alternative-
specific variables while the multinomial logit can support only the former (Stata, 2007).
4
De Donnea (1971); Lave (1970) and Madan and Groenhout (1987) all use the binary logit
methodology but the ability of the conditional, multinomial and nested logit methods to
incorporate more than two categories of the dependent variable means that they are favoured in
applied work relating to modal choice. Bhat and Pulugurtha (1998) and Hausman and Wise (1978)
estimate multinomial probit models, but the computational complexity of this model means that
it is rarely applied.
03 Commins-Nolan article_ESRI Vol 41 25/02/2010 14:31 Page 46
and Williams and Shiels, 2000). The interactions between commuting and the
housing and labour markets have been analysed by Morgenroth (2002) who
used gravity models to analyse the determinants of inter-county commuting
flows and Keane (2001) who similarly related commuting to issues of job
search and the development of local labour market areas. Horner (1999) and
Walsh et al. (2005) described patterns of travel to work using earlier versions
of the Census of Population (CoP) data employed in this paper. Both papers
highlighted a substantial phenomenon of long-distance commuting.
Research on the travel behaviour of individuals using disaggregated data
has been increasing in recent years in Ireland, in part due to the increased
availability of detailed micro-data on commuting behaviour from the Census
of Population. Nolan (2003) examined the income and socio-economic
determinants of household car ownership, car use and public transport use in
the Dublin area, using micro-data from the 1987, 1994 and 1999 Irish
Household Budget Surveys. McDonnell et al. (2006) focused on the determin -
ants of bus use in a particular QBC (quality bus corridor) catchment area in
Dublin. They found that the key to attracting commuters to bus was shorter
journey times at peak times, even in high income areas. Vega and Reynolds-
Feighan (2006) estimated a simultaneous model of residential location and
mode of transport to work in the Dublin area using data from the 2002 Census
of Population, and found significant effects for alternative-specific character -
istics such as travel time, as well as individual socio-economic characteristics.
In a later paper, using the same data, Vega and Reynolds-Feighan (2008)
concentrated on four employment sub-centres in the Dublin area, and found
that the spatial distribution of employment exerted a large and significant
influence on modal choice for the journey to work. Commins and Nolan (2008),
using the same data employed in this paper (i.e. the 2006 Census of
Population), examined choice of mode of transport for the journey to work in
the Greater Dublin Area, but assumed that residential location and household
car ownership status were exogenous.
III DATA
The data employed in this paper are micro-data from the Place of Work
Census of Anonymised Records (POWCAR) from the 2006 Census of
Population (CoP). The CoP is carried out every five years by the Central
Statistics Office and includes all individuals present in the country on the last
Sunday in April. For the first time, the micro-data for 2006 constitute the
entire population of working individuals aged 15+ years surveyed at home in
private households. In total 1,834,472 individuals are included in the micro-
CAR OWNERSHIP AND MODE OF TRANSPORT TO WORK IN IRELAND 47
03 Commins-Nolan article_ESRI Vol 41 25/02/2010 14:31 Page 47
data file. After excluding individuals working from home, those with a mobile
place of employment and where “other means”
5
and lorry/van were recorded,
the final sample for estimation is 1,564,330 individuals. Due to the substantial
difference in population density and public transport provision across different
areas of Ireland, we further divide the sample into four sub-samples; Dublin
city and county (494,370 individuals), Dublin commuter belt (i.e. the
surrounding counties of Kildare, Meath and Wicklow; 187,779 individuals),
other urban areas (377,649 individuals) and rural areas (504,532
individuals).
6
Table 1 defines the four sub-samples, and provides some details
on public transport availability and transport characteristics in each area.
Each individual observation contains information on demographic and
socio-economic characteristics such as age; gender; household type; housing
tenure; marital status; education level; socio-economic group and industrial
group; as well as variables relating to county and electoral division (ED
7
) of
residence, county, ED and geo-code of place of work, distance travelled, time of
departure and mode of transport for the journey to work. Mode of transport
refers to the usual mode of transport for the outward journey to work. Where
more than one mode of transport is used, the mode of transport used for the
greater part of the journey (by distance) is recorded. Household car ownership
refers to the number of cars or vans available for use by the household. All
variables are self-reported. The CoP does not contain information on income or
prices.
Our joint model of household car ownership and mode choice for the
journey to work consists of six alternatives; two car ownership levels (no car
or at least one car) and three modes of transport to work (walk/cycle, bus/train
and motorcycle/car driver/car passenger). See Section IV for further details on
methodology. Table 2 presents car ownership and modal shares for 2006, and
indicates that the majority of workers travelled by car in each of the four
areas, followed by walking/cycling and public transport. However, it is clear
that the range of options available to those in the Greater Dublin Area (i.e.
Dublin city and county and commuter belt) is wider, with public transport
really only attracting a significant number of commuters here. The proportion
of households with at least one car is considerably higher in rural areas than
in Dublin city and county. Consequently, the distribution of individuals across
all six alternatives is more dispersed for Dublin city and county than for the
other areas, in particular, rural areas.
48 THE ECONOMIC AND SOCIAL REVIEW
5
These observations are excluded as the modelling approach requires that alternatives be distinct
and independent.
6
To ease the computational burden, we take a 10 per cent random sample in each case.
7
The electoral division (ED) is the smallest administrative area for which population statistics
are published. There are 3,440 EDs in the state.
03 Commins-Nolan article_ESRI Vol 41 25/02/2010 14:31 Page 48
CAR OWNERSHIP AND MODE OF TRANSPORT TO WORK IN IRELAND 49
Table 1: Sub-Sample Definitions and Selected Characteristics
Dublin City and Commuter Other Urban Rural
County
Definition Dublin County Kildare, Cork, Galway, EDs with
Borough, Fingal, Meath and Limerick and residential
South Dublin, Wicklow Waterford cities density
Dun Laoghaire- and EDs with of fewer than
Rathdown residential 150 persons
density of 150 per km
2
persons per km
2
or greater
Resident 494,370 187,779 377,649 504,532
working
population
Population 4,097* 598 1,610 46
density
Average kilometres 10 21 11 18
to work
Median kilometres 7 16 5 12
to work
Public Extensive bus Inter-urban City bus Inter-urban
transport service; bus and rail services in bus and rail
options suburban coastal services; cities with services
light rail line four radial inter-urban bus
(DART); four suburban and rail services;
radial suburban heavy rail one suburban
heavy rail lines lines rail line
(Commuter); two (Commuter) in Cork
radial tram lines
(LUAS)
Note: The samples exclude those who stated that they work at home, travelled by
“other” means (including lorry or van), or did not answer the question (see also
Section III).
Source: 2006 POWCAR.
*Despite having the highest population density in the country, Dublin is a low density
city by European standards (see European Environment Agency, 2006).
03 Commins-Nolan article_ESRI Vol 41 25/02/2010 14:31 Page 49
Independent variables are individual as well as alternative-specific. While
(self-reported) travel times for the individual’s chosen mode are available in
POWCAR, travel times for alternative modes are not. To estimate travel times
for the non-chosen modes, we apply the method employed by De Palma and
Rochat (2000). For alternatives not chosen, average travel times by mode are
inserted. Alternative formulations of the travel time variable (using simple
average travel times by mode) give similar results.
8
Cost information is not
available in POWCAR. We construct a simple alternative-specific (monetary)
cost per kilometre variable using information on public transport fares and car
operating costs (including fuel). We assume zero costs for the walking and
cycling modes (in common with others in the literature (see also Hole and
FitzRoy, 2005).
9
Individual-specific independent variables include the age of the individual
(classified using a nine-category variable representing five-yearly age groups)
and gender (with males regarded as the reference category). We also include a
50
THE ECONOMIC AND SOCIAL REVIEW
Table 2: Household Car Ownership and Mode of Transport to Work, 2006 (Full
Population of Working Individuals 15+ Years; Percentage)
Dublin City Dublin Other Rural
and County Commuter Urban
Belt
No household car 14.5 4.7 12.0 2.8
On foot or bicycle 6.9 2.7 8.1 1.7
Bus, train or LUAS 6.8 1.2 2.0 0.3
Motorcycle, scooter, car driver 0.8 0.8 1.9 0.8
or passenger
At least one household car 85.5 95.3 88.0 97.2
On foot or bicycle 11.8 7.2 14.0 4.9
Bus, train or LUAS 17.0 9.2 3.2 1.3
Motorcycle, scooter, car 56.7 78.9 70.8 91.0
driver or passenger
Total 100.0 100.0 100.0 100.0
Note: The samples exclude those who stated that they work at home, travelled by
“other” means (including lorry or van), or did not answer the question (see also
Section III).
Source: 2006 POWCAR.
8
See the Appendix for discussion of alternative formulations of the travel time variable.
9
Further details on the construction of the time and cost variables are available from the authors.
03 Commins-Nolan article_ESRI Vol 41 25/02/2010 14:31 Page 50
seven-category household composition variable to identify households
with children, single parent households, other households etc. This is
important as POWCAR does not include household identifiers, meaning that
we cannot link household members. Individuals that are married
10
are
indicated by a binary variable for marital status, as are individuals with
third level education as their highest level of education completed. The socio-
economic group of the individual is represented by a nine-category variable
that identifies individuals in each socio-economic group, with those in the
highest socio-economic group (employers and managers) regarded as the
reference category. We include an eight-category indicator for industrial
group, in an attempt to proxy job characteristics such as flexibility in working
hours, provision of company vehicles etc. Individuals working in the
commercial sector, the largest industrial group, are regarded as the reference
category.
We also include dummy variables for those living and working in densely
populated EDs (i.e. with 150 persons or more per square kilometre). This
provides a crude proxy for public transport availability and parking provision
with the expectation that those living and working in densely populated areas
will have better public transport options and/or poorer parking availability
than those living and working in less densely populated areas. We also
construct a rail availability index based on ED-level data. This is a binary
variable, which identifies individuals who live and work in EDs with 75 per
cent of addresses within two kilometres of a rail station (for the Dublin city
and county and commuter samples, the cut-off is 100 per cent due to the
smaller size of the EDs). Using ArcGIS software, data from the An Post
Geodirectory, matched with a dataset of rail station geo-locations, is employed
for this estimation. The An Post Geodirectory is a complete database of the
geographical locations of all addresses in Ireland, which we use to calculate
the distance from each address to its nearest rail station. We then calculate
the proportion of addresses in each ED which are within two kilometres of a
station, in order to construct our index.
11
Potentially important omitted
variables include cycle lane facilities,
12
bus service availability and more
general indicators of public transport quality and frequency. Variable
definitions and summary statistics are presented in Table 3.
CAR OWNERSHIP AND MODE OF TRANSPORT TO WORK IN IRELAND 51
10
Co-habitation is not recorded in the Census.
11
See Mayor et al., 2008 for further details.
12
See Ewing et al., 2004 for a discussion of the effect of footpaths and cycle lanes on choice of mode
of transport to school in Florida.
03 Commins-Nolan article_ESRI Vol 41 25/02/2010 14:31 Page 51
52 THE ECONOMIC AND SOCIAL REVIEW
Table 3: Variable Definitions and Summary Statistics, 2006 (Independent Variables)
Definition Dublin City Commuter Other Rural
and County Urban
Age 25-29 years =1 if aged 25-29 years 19.2 15.3 17.9 12.8
Age 30-34 years =1 if aged 30-34 years 16.1 16.5 15.5 14.9
Age 35-39 years =1 if aged 35-39 years 12.1 14.8 12.6 14.6
Age 40-44 years =1 if aged 40-44 years 10.8 12.7 11.6 13.8
Age 45-49 years =1 if aged 45-49 years 9.9 11.0 10.3 12.3
Age 50-54 years =1 if aged 50-54 years 8.7 8.8 8.1 10.1
Age 55-59 years =1 if aged 55-59 years 6.1 5.8 6.0 6.8
Age 60+ years =1 if aged 60+ years 4.4 3.6 3.9 3.8
(Reference category = aged 15-24 years) 12.7 11.5 14.1 10.9
Female =1 if female 48.9 49.4 49.5 53.9
(Reference category = male) 51.1 50.6 50.5 46.1
Lone parent with at least one =1 if lone parent with children under 19 years 4.0 3.7 5.0 3.8
resident child under 19 years
Lone parent with resident =1 if lone parent with children over 19 years 3.9 3.1 3.5 4.1
children but none under 19 years
Couple with at least one =1 if couple with children under 19 years 32.7 44.4 35.4 48.7
resident children under 19 years
Couple with resident children =1 if couple with children over 19 years 12.1 11.8 10.5 13.4
but none under 19 years
Couple with no resident children =1 if couple with no resident children 18.1 19.7 17.5 17.2
Other households =1 if other household types
(Reference category = single households) 19.8 10.8 18.5 6.7
9.4 6.5 9.6 6.1
Ever married =1 if married, separated/divorced, widowed 50.5 62.3 53.5 66.6
(Reference category = single) 49.5 37.7 46.5 33.4
Third level =1 if highest level of education completed
is third level
(Reference category = less than third level) 55.0 47.0 46.3 41.9
45.0 53.0 53.7 58.1
Higher professional =1 if higher professional 12.4 7.9 9.2 6.5
Lower professional =1 if lower professional 17.0 16.6 15.9 17.9
Non-manual =1 if non-manual 31.3 30.5 31.0 29.9
Manual skilled =1 if manual skilled 7.2 9.4 10.0 11.5
03 Commins-Nolan article_ESRI Vol 41 25/02/2010 14:31 Page 52
CAR OWNERSHIP AND MODE OF TRANSPORT TO WORK IN IRELAND 53
Table 3: Variable Definitions and Summary Statistics, 2006 (Independent Variables) (contd.)
Definition Dublin City Commuter Other Rural
and County Urban
Semi-skilled =1 if semi-skilled 7.7 10.1 13.9 13.5
Unskilled =1 if unskilled 2.6 2.6 3.4 2.9
Own account, farmers etc. =1 if own account workers, farmers, 1.3 2.4 1.8 3.4
agricultural workers
Other =1 if all other gainfully occupied and unknown 0.2 0.2 0.2 0.2
(Reference category = employers and managers) 20.3 20.3 14.6 14.2
Agriculture, forestry etc. =1 if agriculture, forestry or fishing 0.3 1.3 0.6 2.2
Manufacturing =1 if manufacturing, mining, quarrying, turf
production, electricity, gas or water 10.5 17.7 19.9 20.1
Construction =1 if construction 3.7 5.6 5.0 5.8
Transport =1 if transport, storage or communications 7.4 5.0 4.9 3.9
Public administration =1 if works in public administration or defence 8.0 7.7 6.4 6.8
Health, education, social =1 if works in health, education or social work 19.5 19.5 21.8 25.5
Other =1 if other 9.9 9.6 11.6 9.2
(Reference category = commerce) 40.7 33.6 29.8 26.5
Population density (home) =1 if population density of home ED is
>=150 per km
2
98.4 63.0 * *
Population density (work) =1 if population density of work ED is
>=150 per km
2
97.5 80.4 83.6 53.9
Rail available =1 if lives and works in an ED where 100 per cent of 35.0 3.8
addresses are within 2 kilometres of a rail station
(Reference category = does not live and work in such 65.0 96.2
an ED)
Rail available =1 if lives and works in an ED where 75 per cent of 19.4 2.0
addresses are within 2 kilometres of a rail station
(Reference category = does not live and work in such 80.6 98.0
an ED)
Note: The samples exclude those who stated that they work at home, travelled by “other” means (including lorry or van), or did
not answer the question (see also Section III).
*As the urban and rural samples are defined on the basis of population density above and below 150 persons per km
2
(see
Section III), the population density (home) variable drops out of the analysis in these two sub-samples.
03 Commins-Nolan article_ESRI Vol 41 25/02/2010 14:32 Page 53
IV METHODOLOGY
In this application, an individual chooses among six discrete alternatives
(representing two car ownership alternatives and three mode of transport
alternatives). We specify a conditional logit model, a particular type of discrete
choice econometric method. The conditional logit model extends the
multinomial logit model to include variables that describe the attributes of the
choices (such as travel time), as well as variables that describe the attributes
of the individuals (such as age or gender). Assume each individual i faces a
choice between a set of J alternatives (J = 1, 2, … , J), with the attributes of
the choices described by z
ij
and the characteristics of the individual described
by x
i
. The model is based on McFadden’s random utility framework (see
McFadden, 1974), in which each individual i aims to maximise their utility.
The (unobserved) utility of each alternative is assumed to be a linear function
of various independent variables and an error term as follows:
(1)
where U
ij
*
is the unobserved utility individual i derives from alternative j, x
i
is
the vector of individual-specific independent variables,
α
j
is the vector of
estimated parameters for the individual-specific variables, z
ij
is the vector of
alternative-specific variables,
β
is the vector of alternative-specific parameters
and
ε
ij
is the error term. An individual i chooses alternative j if it gives the
highest utility among all possible alternatives. The distributional assumptions
concerning the random error component
ε
ij
determine the form of the model.
The most common assumption is that the error terms are independently
and identically distributed with a Type 1 Extreme Value (or Weibull)
distribution, which results in the following probability of individual i choosing
alternative j:
(2)
Conditional logit regression methods (using the asclogit command in
STATA 10) are used to obtain estimates of the parameters
α
j
and
β
. The
conditional logit model reduces to the multinomial logit model when all
independent variables are individual-specific. As with the multinomial logit, a
restrictive feature of the conditional logit model is the assumption of
‘Independence from Irrelevant Alternatives’ (IIA). The property implies that
54 THE ECONOMIC AND SOCIAL REVIEW
U
ij
*
=x
i
'
α
j
+z
ij
β
+
ε
ij
P
ry
i
=j
()
=
exp x
i
α
j
+z
ij
()
exp x
i
α
k
+z
ik
β
β
()
k=1
K
∑
03 Commins-Nolan article_ESRI Vol 41 25/02/2010 14:32 Page 54
the relative probabilities between a pair of alternatives are specified without
reference to the nature of the other alternatives in the choice set. Hausman
and Small-Hsiao tests of the IIA property have been developed for the
multinomial logit and conditional logit models, but are prone to errors (see for
example, Scott Long and Freese, 2006).
13
To test the appropriateness of the
conditional logit methodology, we follow Salon (2009) and also estimate a
nested logit model.
In order to estimate the conditional logit models, the data must be
constructed in such a way that there are J observations for each individual i.
As there are 35,528, 13,896, 26,899 and 35,292 individuals in our sample with
complete information on all variables of interest respectively, this results in
respective sample sizes of 213,168, 83,376, 161,394 and 211,752. Estimation
results are presented in terms of odds ratios, with values greater than unity
indicating an increased probability of observing the alternative in question,
and values smaller than unity a reduced probability of observing the
alternative in question (in comparison with the base alternative).
It is possible that each individual does not have access to the full range of
alternatives, particularly in rural areas where public transport options may
just not be available. We therefore estimate a second specification of the model
with a restricted choice set. We consider walking and cycling to be unavailable
for those travelling over ten kilometres to work and public transport to be
unavailable for those living in EDs with fewer than 100 per cent of addresses
within two kilometres of a rail station (see also Ewing et al., 2004 and Hole
and FitzRoy, 2005).
14
As very few individuals who travel by motorised means
to work (motorcycle or car) live in households without a car, we also consider
the case when this alternative is dropped from the model.
15
Reference to these
results is made in Section V.
CAR OWNERSHIP AND MODE OF TRANSPORT TO WORK IN IRELAND 55
13
To test the appropriateness of the conditional logit methodology, we follow Salon (2009) and also
estimate a nested logit model. Results from the nested logit models are available on request from
the authors. The assumption of independent alternatives is rejected for all samples. However, the
majority of the inclusive values are greater than one, indicating that the estimated models are
inconsistent with random utility maximisation. In addition, the nested logit models that are
estimated here are also subject to restrictive assumptions in that they do not allow for
alternatives to belong to more than one nest. Cross nested logit models would be more appropriate
in this application; this is the subject of further research. For these reasons, we present results,
and base our discussion, on results from the conditional logit models, while recognising their
limitations.
14
In the absence of more detailed information on public transport availability, access to rail
services at the ED level is used here to proxy, albeit imperfectly, public transport availability.
15
Results from these various robustness checks are available from the authors.
03 Commins-Nolan article_ESRI Vol 41 25/02/2010 14:32 Page 55
V EMPIRICAL RESULTS
Tables 4, 5, 6 and 7 present estimation results for the conditional logit
models of car ownership and mode choice for each of the four sub-samples. Our
travel cost variable is necessarily a crude approximation of the monetary costs
associated with the various transport modes, but nonetheless, our results
indicate that travel cost exerts a negative and significant effect for residents
of the commuter counties, other urban areas and rural areas (as expected).
The effect of travel cost is insignificant for residents of Dublin city and county.
The cross elasticties
16
of travel time are highest for the car-motorised means
alternatives, suggesting that an increase in travel time for this alternative is
associated with proportionately large increases in the probability of other
alternatives being chosen (e.g. in the commuter belt around Dublin, an
increase of 1 per cent in travel time for those owning cars and choosing
motorised means to work leads to a decline of 0.3 per cent in the probability of
choosing that alternative, and a 1.3 per cent increase in the probability of the
other alternatives).
The results for the individual-specific variables for Dublin city and county
(Table 4), suggest that age has a significant influence on individuals’ car
ownership and mode choice decisions, with older age groups being
significantly less likely to choose all car ownership-mode alternatives in
comparison with the base alternative of owning a car and travelling by
motorised means (motorcycle, car passenger or car driver) to work. Compared
with the base alternative, females are significantly less likely to choose the no
car-walk or cycle, no car-public transport and car-walk or cycle options.
However, females in Dublin city and county are significantly more likely to
choose the car-public transport option than males, perhaps reflecting
competing demands on the household car which favour males and the
significantly lower probability of females cycling to work which has been
observed in other studies (see Commins and Nolan, 2008 and Pooley and
Turnbull, 2000). Household composition also proves to be a significant
determinant of car ownership and transport mode choice for the journey to
work. Households with children are less likely to choose any of the no-car-
owning alternatives, compared with single adult households. However,
contrary to prior expectations, all other households are more likely to own a
car but to walk, cycle or take public transport, than own a car and take
motorised means to work, compared with single person households. This may
suggest that car ownership is of more importance for non-work trips,
particularly when there are children in the household. It may also reflect the
56 THE ECONOMIC AND SOCIAL REVIEW
16
Time and cost elasticities are available on request from the authors.
03 Commins-Nolan article_ESRI Vol 41 25/02/2010 14:32 Page 56
fact that our measure of car ownership refers to the number of cars or vans
available for use by the entire household, rather than the individual
commuter; as such, individuals in larger households face competition for the
household car for the journey to work. Married individuals are significantly
less likely to choose all other alternatives over the base alternative.
While higher education levels are negatively associated with the no-car-
owning alternatives, those with a third level education in Dublin also have an
increased probability of opting for public transport, despite owning a car.
These divergent effects may suggest that the income effects associated with
higher education, which are observed through the greater probability of car
ownership, are counteracted by a greater awareness of the detrimental
environmental effects of car driving among the higher educated, who choose
more environmentally friendly modes of transport for commuting purposes.
Socio-economic group, used as a proxy for household resources, is similarly
significant. Those in lower socio-economic groups are more likely to choose any
of the non-car owning alternatives, and more likely to walk, cycle or take
public transport if they own a car, as expected. This may be picking up the
effects of income, with the highest socio-economic group, employers and
managers, more likely to own a car and drive to work than all other socio-
economic groups. Compared to the commercial sector, all other industrial
groups are less likely to choose the no-car alternatives. Most industries are
also less likely to walk, cycle or take public transport in combination with car
ownership. This may reflect the nature and locations of work in other
industries, such as agriculture and construction, which may have a greater
need for car ownership and use. Those in the commercial sector would be
expected to have more regular working hours and greater access to public
transport, thus making them more likely to walk, cycle or travel by public
transport than other industrial groups. An exception is public sector workers,
who are more likely to own a car but take public transport to work. Despite a
recent survey which highlighted the high degree of free car parking available
to public servants (i.e. those working in public administration) in the Dublin
area,
17
other characteristics of these occupations such as the availability of
subsidised public transport fares and/or their more regular working hours
may make them more amenable to public transport.
Public transport availability is evidently an important consideration, as
shown by the highly significant rail proximity variable. Those living and
working in parts of Dublin city and county which are well serviced by rail are
significantly more likely to choose all car ownership-mode combinations other
CAR OWNERSHIP AND MODE OF TRANSPORT TO WORK IN IRELAND 57
17
The survey by the Dublin City Business Association suggested that up to 60 per cent of car
parking spaces in Dublin city centre were used by public servants, the majority of whom have free
parking (The Irish Times, June 16, 2008).
03 Commins-Nolan article_ESRI Vol 41 25/02/2010 14:32 Page 57
58 THE ECONOMIC AND SOCIAL REVIEW
Table 4: Dublin City and County (Odds Ratios – Reference Choice is Car Owner and Motorcycle, Car Driver or Car
Passenger)
No Car One or More Cars
On Foot Bus or Motorcycle, On Foot Bus or
or Bicycle Train Car Driver, or Bicycle Train
Car Passenger
Individual-specific variables
Age 15-24 years ref ref ref ref ref
Age 25-29 years 0.77*** 0.68*** 0.62** 0.66*** 0.61***
Age 30-34 years 0.46*** 0.44*** 0.66* 0.61*** 0.48***
Age 35-39 years 0.40*** 0.40*** 0.55** 0.51*** 0.38***
Age 40-44 years 0.30*** 0.31*** 0.40*** 0.50*** 0.38***
Age 45-49 years 0.32*** 0.36*** 0.28*** 0.55*** 0.35***
Age 50-54 years 0.23*** 0.29*** 0.26*** 0.46*** 0.33***
Age 55-59 years 0.18*** 0.27*** 0.40*** 0.43*** 0.31***
Age 60+ years 0.15*** 0.21*** 0.21*** 0.32*** 0.33***
Male ref ref ref ref ref
Female 0.67*** 0.74*** 0.57*** 0.84*** 1.14***
Single Person ref ref ref ref ref
Lone parent with at least one resident child under 19 years 0.38*** 0.33*** 0.37*** 0.82 1.06
Lone parent with resident children but none under 19 years 0.32*** 0.49*** 0.59* 1.06 1.91***
Couple with at least one resident child under 19 years 0.09*** 0.11*** 0.12*** 1.07 1.40***
Couple with resident children but none under 19 years 0.11*** 0.12*** 0.15*** 1.23** 2.16***
Couple with no resident children 0.49*** 0.45*** 0.27*** 1.40*** 1.82***
Other households 0.88 0.91 0.56*** 2.42*** 2.20***
Single ref ref ref ref ref
Ever married 0.81*** 0.74*** 0.67** 0.79*** 0.74***
Less than third level ref ref ref ref ref
Third level 0.90 0.75*** 0.57*** 1.05 1.16***
Employers and managers ref ref ref ref ref
Higher professional 1.70*** 1.05 1.36 1.77*** 1.23***
Lower professional 1.98*** 1.65*** 1.98** 1.64*** 1.48***
Non-manual 3.67*** 2.76*** 3.06*** 1.85*** 1.67***
03 Commins-Nolan article_ESRI Vol 41 25/02/2010 14:32 Page 58
CAR OWNERSHIP AND MODE OF TRANSPORT TO WORK IN IRELAND 59
Table 4: Dublin City and County (Odds Ratios – Reference Choice is Car Owner and Motorcycle, Car Driver or Car
Passenger) (contd.)
No Car One or More Cars
On Foot Bus or Motorcycle, On Foot Bus or
or Bicycle Train Car Driver, or Bicycle Train
Car Passenger
Manual skilled 2.80*** 1.90*** 7.10*** 1.58*** 1.23**
Semi-skilled 6.08*** 4.05*** 6.69*** 2.40*** 1.41***
Unskilled manual 15.18*** 11.20*** 10.73*** 3.99*** 2.37***
Own account, farmers, agricultural workers etc. 0.84 0.68 1.65 0.77 0.65**
Other gainfully occupied and unknown 0.38 1.23 3.65 1.21 0.85
Agriculture, forestry and fishing 1.76 1.49 2.92 0.97 0.74
Manufacturing 0.67*** 0.74*** 0.96 0.62*** 0.45***
Construction 0.62*** 0.68*** 0.60 0.35*** 0.43***
Commerce ref ref ref ref ref
Transport, storage and communications 0.68*** 0.92 0.68 0.65*** 0.82***
Public administration and defence 1.02 1.06 0.59 1.10 1.21***
Education, health and social work 0.79*** 0.64*** 0.76 0.71*** 0.41***
Other industries 1.54*** 1.43*** 1.64** 0.98 0.79***
Population density (home) 2.76* 2.75** 1.13 1.23 1.57***
Population density (work) 1.14 0.97 0.49** 1.32 2.39***
Living and working in an ED with less than 100 per cent ref ref ref ref ref
of addresses within 2 kilometres of a rail station
Living and working in an ED with 100 per cent of
addresses within 2kilometres of a rail station 3.72*** 2.12*** 1.50*** 2.47*** 1.66***
Alternative-specific variables
Travel time 0.95***
Travel cost 1.00
Number of Observations 213,168
Number of Individuals 35,528
Log-Likelihood –32,862.54
*** Significant at 1 per cent level; ** significant at 5 per cent level; * significant at 10 per cent level.
03 Commins-Nolan article_ESRI Vol 41 25/02/2010 14:32 Page 59
than owning a car and travelling by motorised means, with the results for
those choosing the no car-walking, cycling and public transport alternatives
particularly significant. For instance, in comparison with living in a car-
owning household and choosing a motorised means of transport to work, those
living and working in areas with all addresses within 2 kilometres of a railway
station are over two times as likely to choose the no car-public transport
option, and over 3.7 times more likely to choose the no car-walking or cycle
option. Population density at home and work displays effects that are
generally consistent with expectations; for example, those living and working
in densely populated areas are significantly more likely to choose the car-
public transport option.
Results for the sample of those living in the commuter belt counties of
Kildare, Meath and Wicklow (see Table 5) are broadly in line with those
observed for Dublin city and county, with age, household composition, living
and working in densely populated areas, and access to rail having the highest
significance. These variables all have the same signs as previously outlined,
with younger people, those working in densely populated areas and those
living and working near a railway station significantly more likely to choose
all car ownership-mode combinations over owning a car and travelling by
motorised means to work. Individuals in lower socio-economic groups are also
still more likely than those in the highest socio-economic group to choose any
of the no-car alternatives or the car-walk or cycle alternative. Due to the
smaller number of observations in this sample, the significance levels of some
variables such as gender, marital status and industrial group fall. Once again,
those working in public administration and defence are significantly more
likely to choose the car-public transport option.
The results for other urban and rural areas (Tables 6 and 7 respectively)
differ in some respects to the samples outlined above, partly due to smaller
sample sizes and reduced significance levels. However, the main drivers of car
ownership levels and transport mode choice are still clearly evident, in the
significance of age, gender, household composition and socio-economic group.
The results for the rail availability and work population density variables
indicate some differences in comparison with the results for Dublin city and
county and the commuter counties. For example, rail availability is less
significant for the other urban and rural samples, reflecting the relatively
poor availability of rail connections suitable for commuting outside the
Greater Dublin Area.
18
While those working in densely populated areas
60 THE ECONOMIC AND SOCIAL REVIEW
18
Rail availability exerts a negative effect on the probability of choosing the public transport
alternatives in the urban sample; why this is the case is unclear. It could reflect the fact that rail
services in urban areas are generally only attractive for those undertaking inter-urban trips, and
as such, are less attractive for the majority of commuters.
03 Commins-Nolan article_ESRI Vol 41 25/02/2010 14:32 Page 60
are significantly more likely to choose the car-public transport option in
both urban and rural areas, those working in densely populated areas are
significantly less likely to choose the walking or cycling alternatives in
the rural sub-sample. Why this is the case is not entirely clear, although
it is possible that conditions for walking and cycling in rural areas are so poor
(no cycle lanes, poor lighting, lack of a continuous footpath etc.) as to
make these alternatives unpopular even for those working in densely
populated areas.
Comparing the results across the four sub-samples indicates differences in
the effects of some variables, most notably for education, industrial group and
work location population density. While in all cases the probability of choosing
a no car alternative is lower among those with a third level education, the
possible preference for more environmentally friendly modes of transport
among higher educated car owners in Dublin city and county and the
commuter counties is not reflected in other parts of the country (where the car-
public transport alternative is significantly less likely to be chosen).
Explaining these divergent effects is difficult although it is possible that
education in the Dublin city and county or commuter samples may be
correlated with other factors such as work or home location, which may not
have been picked up by the aggregated nature of the dummy variables. The
effect of workplace population density also differs across the four areas. In
general, those resident in rural areas behave differently to those resident in
the other three areas of the country; for example, while those working in areas
with high population density are significantly more likely to choose the car-
walk or cycle option in Dublin city and county, the commuter counties and
other urban areas, rural residents who work in densely populated areas are
significantly less likely to choose this option. The relative quality of walking
and cycling facilities in rural areas may explain this counterintuitive result.
Some of our models are fitting better than others, in part due to amount
of variation across alternatives and the quality of independent variables
available to us. For example, the Dublin city and county sample has the
highest significance levels for all variables, followed by the commuter
counties. These areas are better serviced by public transport, and have lower
car ownership levels, meaning that individuals are more likely to choose from
a wider variety of alternatives than the other urban and rural areas. Finally,
the small proportion of individuals choosing the no car-motorised means
option leads to less significant results, although consistent with expectations
(e.g. non-single households are significantly less likely to choose the no car-
motorised option, perhaps reflecting competing household demands such as
the presence of school-age children which would make car-sharing more
attractive).
CAR OWNERSHIP AND MODE OF TRANSPORT TO WORK IN IRELAND 61
03 Commins-Nolan article_ESRI Vol 41 25/02/2010 14:32 Page 61
62 THE ECONOMIC AND SOCIAL REVIEW
Table 5: Commuter Counties – Kildare, Meath, Wicklow (Odds Ratios – Reference Choice is Car Owner and
Motorcycle, Car Driver or Car Passenger)
No Car One or More Cars
On Foot Bus or Motorcycle, On Foot Bus or
or Bicycle Train Car Driver, or Bicycle Train
Car Passenger
Individual-specific variables
Age 15-24 years ref ref ref ref ref
Age 25-29 years 0.96 0.77 1.14 0.65*** 0.63***
Age 30-34 years 0.74 0.56* 0.75 0.39*** 0.51***
Age 35-39 years 0.54** 0.27*** 0.63 0.45*** 0.43***
Age 40-44 years 0.92 0.35** 0.71 0.55*** 0.37***
Age 45-49 years 0.66 0.69 0.29* 0.47*** 0.40***
Age 50-54 years 0.39** 0.42* 0.45 0.44*** 0.38***
Age 55-59 years 0.76 0.67 0.37 0.50*** 0.32***
Age 60+ years 0.56 0.17** 0.19 0.62** 0.30***
Male ref ref ref ref ref
Female 0.82 0.68** 0.43*** 1.04 0.98
Single Person ref ref ref ref ref
Lone parent with at least one resident child under 19 years 0.31*** 0.49** 3.36** 0.88 0.88
Lone parent with resident children but none under 19 years 0.48** 0.60 0.82 2.34** 2.07***
Couple with at least one resident children under 19 years 0.06*** 0.06*** 0.17*** 1.96** 1.31
Couple with resident child but none under 19 years 0.08*** 0.07*** 0.17*** 2.15*** 1.76***
Couple with no resident children 0.19*** 0.24*** 0.24*** 2.08*** 1.48***
Other households 0.97 0.68 1.74 5.10*** 1.86***
Single ref ref ref ref ref
Ever married 0.92 0.75 0.49** 1.06 0.79**
Less than third level ref ref ref ref ref
Third level 0.58*** 0.81 0.34*** 0.85* 1.52***
Employers and managers ref ref ref ref ref
Higher professional 0.77 1.79 3.31 1.63** 1.13
Lower professional 0.69 1.88* 2.31 0.99 0.99
Non-manual 2.29*** 3.03*** 3.57** 1.87*** 1.10
03 Commins-Nolan article_ESRI Vol 41 25/02/2010 14:32 Page 62
CAR OWNERSHIP AND MODE OF TRANSPORT TO WORK IN IRELAND 63
Table 5: Commuter Counties – Kildare, Meath, Wicklow (Odds Ratios – Reference Choice is Car Owner and
Motorcycle, Car Driver or Car Passenger)
No Car One or More Cars
On Foot Bus or Motorcycle, On Foot Bus or
or Bicycle Train Car Driver, or Bicycle Train
Car Passenger
Manual skilled 1.66 1.73 4.48** 1.22 0.49***
Semi-skilled 4.11*** 3.28*** 8.05*** 2.03*** 0.87
Unskilled manual 3.91*** 6.67*** 9.88*** 3.93*** 1.09
Own account, farmers, agricultural workers etc. 1.64 1.00 8.92*** 1.66** 0.55
Other gainfully occupied and unknown 12.23*** 1.00 24.57*** 2.49** 0.97
Agriculture, forestry and fishing 0.94 1.00 1.91 2.06** 0.38
Manufacturing 0.77 0.66 1.63 0.64*** 0.31***
Construction 0.36** 0.23** 1.17 0.43*** 0.41***
Commerce ref ref ref ref ref
Transport, storage and communications 0.62 0.80 0.47 0.52** 1.30*
Public administration and defence 0.75 0.58 0.76 0.64** 1.62***
Education, health and social work 0.82 0.49** 0.75 0.78* 0.51***
Other industries 1.35 1.26 1.47 1.09 0.67***
Population density (home) 1.28 5.09*** 1.70** 1.62*** 1.62****
Population density (work) 1.62** 1.32 0.46*** 1.11 4.10***
Living and working in an ED with less than 100 per cent of
addresses within 2kilometres of a rail station ref ref ref ref ref
Living and working in an ED with 100 per cent of addresses
within 2kilometres of a rail station 4.85*** 1.72 1.94 2.60*** 2.78***
Alternative-specific variables
Travel time 0.95***
Travel cost 0.89***
Number of Observations 83,376
Number of Individuals 13,896
Log-Likelihood –6,928.3
*** Significant at 1 per cent level; ** significant at 5 per cent level; * significant at 10 per cent level.
03 Commins-Nolan article_ESRI Vol 41 25/02/2010 14:32 Page 63
64 THE ECONOMIC AND SOCIAL REVIEW
Table 6: Other Urban Areas (Odds Ratios – Reference Choice is Car Owner and Motorcycle, Car Driver or Car
Passenger)
No Car One or More Cars
On Foot Bus or Motorcycle, On Foot Bus or
or Bicycle Train Car Driver, or Bicycle Train
Car Passenger
Individual-specific variables
Age 15-24 years ref ref ref ref ref
Age 25-29 years 0.72*** 0.73** 0.81 0.68*** 0.60***
Age 30-34 years 0.47*** 0.61*** 0.78 0.54*** 0.53***
Age 35-39 years 0.39*** 0.39*** 0.80 0.54*** 0.56***
Age 40-44 years 0.40*** 0.42*** 0.76 0.65*** 0.53***
Age 45-49 years 0.43*** 0.45*** 0.43*** 0.64*** 0.49***
Age 50-54 years 0.53*** 0.24*** 0.73 0.64*** 0.36***
Age 55-59 years 0.34*** 0.65* 0.56* 0.60*** 0.42***
Age 60+ years 0.21*** 0.36*** 0.52* 0.46*** 0.38***
Male ref ref ref ref ref
Female 0.64*** 0.80** 1.00 0.98 1.15
Single Person ref ref ref ref ref
Lone parent with at least one resident child under 19 years 0.45*** 0.39*** 0.65* 0.72** 1.16
Lone parent with resident children but none under 19 years 0.49*** 0.47*** 0.54** 1.66*** 2.12***
Couple with at least one resident children under 19 years 0.09*** 0.08*** 0.19*** 1.05 1.18
Couple with resident child but none under 19 years 0.07*** 0.11*** 0.09*** 1.35*** 2.16***
Couple with no resident children 0.27*** 0.29*** 0.28*** 1.31*** 1.85***
Other households 0.88 1.05 0.90 2.95*** 3.09***
Single ref ref ref ref ref
Ever married 1.03 0.91 0.69*** 0.92 0.68***
Less than third level ref ref ref ref ref
Third level 0.69*** 0.86 0.63*** 0.84*** 1.01
Employers and managers ref ref ref ref ref
Higher professional 0.71* 0.73 0.70 1.16 1.66**
Lower professional 1.18 1.44 1.57 1.03 1.61**
Non-manual 3.17*** 3.33*** 2.32*** 1.91*** 2.33***
03 Commins-Nolan article_ESRI Vol 41 25/02/2010 14:32 Page 64
CAR OWNERSHIP AND MODE OF TRANSPORT TO WORK IN IRELAND 65
Table 6: Other Urban Areas (Odds Ratios – Reference Choice is Car Owner and Motorcycle, Car Driver or Car
Passenger) (contd.)
No Car One or More Cars
On Foot Bus or Motorcycle, On Foot Bus or
or Bicycle Train Car Driver, or Bicycle Train
Car Passenger
Manual skilled 3.51*** 2.41*** 4.83*** 1.68*** 2.15***
Semi-skilled 4.51*** 4.19*** 6.96*** 2.09*** 3.08***
Unskilled manual 10.43*** 7.87*** 14.10*** 3.13*** 3.01***
Own account, farmers, agricultural workers etc. 0.66 0.88 0.56 0.99 1.03
Other gainfully occupied and unknown 3.96** 12.94*** 8.35*** 2.54* 4.39*
Agriculture, forestry and fishing 2.53** 2.42 4.00*** 0.99 0.88
Manufacturing 0.86* 1.36** 1.02 0.66*** 0.60***
Construction 0.53*** 0.58* 1.16 0.52*** 0.51***
Commerce ref ref ref ref ref
Transport, storage and communications 0.30*** 1.18 0.50** 0.76** 0.81
Public administration and defence 0.42*** 0.55** 0.56** 0.54*** 0.56***
Education, health and social work 0.93 0.58*** 0.46*** 0.84*** 0.50***
Other industries 1.83*** 1.78*** 1.21 1.46*** 1.05
Population density (work) 1.12 1.14 0.55*** 1.81*** 1.30**
Living and working in an ED with less than 75 per cent
of addresses within 2 kilometres of a rail station ref ref ref ref ref
Living and working in an ED with greater than 75 per cent
of addresses within 2 kilometres of a rail station 2.41*** 0.47*** 1.04 1.86*** 0.56***
Alternative-specific variables
Travel time 0.94***
Travel cost 0.95***
Number of Observations 161,394
Number of Individuals 26,899
Log-Likelihood –17,329.8
*** Significant at 1 per cent level; ** significant at 5 per cent level; * significant at 10 per cent level.
03 Commins-Nolan article_ESRI Vol 41 25/02/2010 14:32 Page 65
66 THE ECONOMIC AND SOCIAL REVIEW
Table 7: Rural Areas (Odds Ratios – Reference Choice is Car Owner and Motorcycle, Car Driver or Car Passenger)
No Car One or More Cars
On Foot Bus or Motorcycle, On Foot Bus or
or Bicycle Train Car Driver, or Bicycle Train
Car Passenger
Individual-specific variables
Age 15-24 years ref ref ref ref ref
Age 25-29 years 1.18 1.36 0.88 0.79** 0.53***
Age 30-34 years 0.77 0.77 0.97 0.55*** 0.46***
Age 35-39 years 0.59** 0.32* 0.68 0.68*** 0.52***
Age 40-44 years 0.80 0.82 0.66 0.60*** 0.56***
Age 45-49 years 0.62* 0.79 0.86 0.73** 0.45***
Age 50-54 years 0.58** 1.12 0.95 0.67*** 0.66*
Age 55-59 years 0.51** 0.54 0.90 0.60*** 0.83
Age 60+ years 0.26*** 0.53 0.52 0.63*** 0.62
Male ref ref ref ref ref
Female 0.81* 0.57* 0.97 0.93 1.55***
Single Person ref ref ref ref ref
Lone parent with at least one resident child under 19 years 0.44*** 0.22** 0.71 0.62** 3.27***
Lone parent with resident children but none under 19 years 0.35*** 0.51 0.53*** 1.09 4.30***
Couple with at least one resident children under 19 years 0.05*** 0.02*** 0.06*** 0.82 3.60***
Couple with resident child but none under 19 years 0.07*** 0.07*** 0.06*** 0.90 3.75***
Couple with no resident children 0.21*** 0.08** 0.11*** 0.95 4.09***
Other households 1.11 25 0.76 2.23*** 5.32***
Single ref ref ref ref ref
Ever married 1.07 0.91 0.76 0.85* 0.39***
Less than third level ref ref ref ref ref
Third level 0.59*** 0.39** 0.40*** 0.93 0.70***
Employers and managers ref ref ref ref ref
Higher professional 0.78 1.00 0.70*** 0.57*** 1.27
Lower professional 1.07 0.83 3.61*** 0.55* 1.08
Non-manual 3.59*** 4.16** 3.35*** 1.19* 1.52**
03 Commins-Nolan article_ESRI Vol 41 25/02/2010 14:32 Page 66
CAR OWNERSHIP AND MODE OF TRANSPORT TO WORK IN IRELAND 67
Table 7: Rural Areas (Odds Ratios – Reference Choice is Car Owner and Motorcycle, Car Driver or Car Passenger)
(contd.)
No Car One or More Cars
On Foot Bus or Motorcycle, On Foot Bus or
or Bicycle Train Car Driver, or Bicycle Train
Car Passenger
Manual skilled 3.66*** 2.54 7.32*** 1.12 2.03***
Semi-skilled 4.53*** 5.01*** 8.18*** 1.11 1.28
Unskilled manual 6.67*** 4.19* 11.45*** 2.09*** 1.75*
Own account, farmers, agricultural workers etc. 1.47 1.90 3.48** 1.72*** 1.02
Other gainfully occupied and unknown 3.03 1.00 6.89* 0.48 1.82
Agriculture, forestry and fishing 4.64*** 4.23** 2.37** 0.89 1.35
Manufacturing 0.89 0.89 1.04 0.75*** 0.37***
Construction 0.74 0.55 1.17 0.41*** 0.36***
Commerce ref ref ref ref ref
Transport, storage and communications 0.36** 0.25 0.25** 0.94 1.67**
Public administration and defence 0.38** 0.82 0.44* 0.63** 1.34
Education, health and social work 0.92 1.16 0.77 0.86 0.76*
Other industries 2.64*** 1.28 1.53* 1.47*** 1.10
Population density (work) 0.41*** 0.98 0.45*** 0.34*** 2.29***
Living and working in an ED with less than 75 per cent
of addresses within 2 kilometres of a rail station ref ref ref ref ref
Living and working in an ED with greater than 75 per cent
of addresses within 2 kilometres of a rail station 4.21*** 3.59** 1.31 1.76*** 1.46
Alternative-specific variables
Travel time 0.95***
Travel cost 0.94***
Number of Observations 211,752
Number of Individuals 35,292
Log-Likelihood –8,775.6
*** Significant at 1 per cent level; ** significant at 5 per cent level; * significant at 10 per cent level.
03 Commins-Nolan article_ESRI Vol 41 25/02/2010 14:32 Page 67