Attitude of European car drivers towards electric vehicles: a survey ppt
Bạn đang xem bản rút gọn của tài liệu. Xem và tải ngay bản đầy đủ của tài liệu tại đây (919.79 KB, 28 trang )
Attitude of European car drivers
towards electric vehicles: a survey
Authors
C. Thiel1, A. Alemanno2, G. Scarcella2, A. Zubaryeva1, G. Pasaoglu1
1
European Commission, DG JRC, Institute for Energy and Transport, Petten, the Netherlands
2
IPSOS public Affair S.r.l., Milan, Italy
2012
Report EUR 25597 EN
European Commission
Joint Research Centre
Institute for Energy and Transport
Contact information
Christian Thiel
Address: Joint Research Centre - IET, P.O. Box 2, 1755 ZG Petten, The Netherlands
E-mail:
Tel.: +31 224 56 5143
/> />This publication is a Reference Report by the Joint Research Centre of the European Commission.
Legal Notice
Neither the European Commission nor any person acting on behalf of the Commission
is responsible for the use which might be made of this publication.
Europe Direct is a service to help you find answers to your questions about the European Union
Freephone number (*): 00 800 6 7 8 9 10 11
(*) Certain mobile telephone operators do not allow access to 00 800 numbers or these calls may be billed.
A great deal of additional information on the European Union is available on the Internet.
It can be accessed through the Europa server />JRC76867
EUR 25597 EN
ISBN 978-92-79-27389-6 (pdf)
ISBN 978-92-79-27390-2 (print)
ISSN 1831-9424 (online)
ISSN 1018-5593 (print)
doi: 10.2790/67556
Luxembourg: Publications Office of the European Union, 2012
© European Union, 2012
Reproduction is authorised provided the source is acknowledged.
Printed in The Netherlands
Table of contents
Contents
Executive Summary
4
1.
Introduction
4
2.
Description of the methodology
6
3.
The survey results
3.1. The background
3.2. The propensity towards electric cars
7
7
10
4.
Conclusions
19
5.
References
20
Annex: The section of the questionnaire related to the electric cars
21
Figures
Figure 1.1 2011 passenger car market share of the six member states in comparison with other
member states
5
Figure 3.1 Expectation about the price of fuel in the near future
7
Figure 3.2 Familiarity with the electric car
8
Figure 3.3 Expectations about the percentage of electric car sales in the next 10 years
9
Figure 3.4 Agreement with statements on electric cars
10
Figure 3.5 Importance of public incentives for electric cars
10
Figure 3.6 Probability of purchasing an electric car with its current average characteristics
11
Figure 3.7 Probability of purchasing an electric car with its current average characteristics by
socioeconomic segment
12
Figure 3.8 Most chosen improved feature as first choice
13
Figure 3.9 Most chosen improved feature as first choice in some groups
14
Figure 3.10 Most chosen improved features after three choices
15
Figure 3.11 Main “ideal” combinations of electric car after three choices – country differences
16
Figure 3.12 Probability of purchasing the “ideal” electric car
17
Figure 3.13 Probability of purchasing the “ideal” electric car – country differences
18
Figure 3.14 Reasons for not being interested in purchasing an electric car
19
Tables
Table 2.1
Key characteristics of generic electric and conventional car
6
Table 3.1
Current and improved features of electric car
12
Table 3.2
Main “ideal” combinations of electric car after three choices
15
3
Executive Summary
CO2 emissions from road transport have risen significantly in the past and projections show that
they will continue to rise in the future if no adequate policy measures are implemented. Several
European initiatives aim at reducing CO2 emissions from passenger vehicles. A potential option to
reduce passenger vehicle CO2 emissions is the deployment of electric vehicles (EV). Consumer
perception and willingness to purchase these new vehicle technologies lies at the heart of its
successful large scale diffusion. This report aims at describing and analyzing how car drivers in the
six countries France, Germany, Italy, Poland, Spain, and United Kingdom consider electric cars, how
familiar they are with the electric car concept and its main features. It investigates, which features
of EVs people consider essential in terms of propensity to consider electric cars a realistic
alternative in case they wanted to purchase a new car. 600 drivers on average per each of the six
Member States responded to the questionnaire. As a result we derive an “ideal” composition of an
electric car in terms of car purchase price, range, re-charge time and maximum speed. The
perspective of the European car drivers, as derived from this study, highlights the importance of
further R&D investments to improve some of the performance characteristics of electric vehicles. It
provides some guidance which performance aspects matter most for car drivers, notably costs and
range. The study finds that the familiarity of car drivers with the electric vehicle aspects is lower
when direct exposure or driving experience would be needed to properly assess these aspects. This
stresses the need of demonstration activities in order to increase public awareness of electromobility and also to receive first hand feedback from car drivers on their experience operating an
electric vehicle. A majority of the respondents considers that public incentives are needed to foster
a wider market deployment of electric vehicles. Furthermore the study shows that an adequate recharge network is perceived as crucial by car drivers.
It can be concluded that European car drivers see the opportunities that electric vehicles could
offer but that a number of pre-requisites need to be fulfilled in order to ensure that the car drivers
can consider electric vehicles as a credible vehicle choice.
1. Introduction
Electric vehicles are seen by many as a potential way to improve the environmental aspects of road
transport. Most notably, they could play an important role in reducing road transport related
carbon emissions. Several automotive original equipment manufacturers (OEM) have recently
launched or are about to deploy electric vehicles to the European market. Some aspects of
currently available electric vehicles still pose challenges for a larger market uptake. A number of
European policy initiatives underline the opportunities of electro-mobility and introduce measures
to overcome the challenges. In the Communication “CARS 2020: Action Plan for a competitive and
sustainable automotive industry in Europe”, the European Commission proposes actions to
promote investments in re-charging infrastructure and an EU standard for the recharging interface
for electric vehicles (European Commission, 2012a). The Transport Whitepaper “Roadmap to a
Single European Transport Area – Towards a competitive and resource efficient transport system”
states as one of the goals to halve the use of ‘conventionally-fuelled’ cars in urban transport by
2030; phase them out in cities by 2050; achieve essentially CO2-free city logistics in major urban
centres by 2030 (European Commission, 2011). Here, electric vehicles could play an important
role. Under the umbrella of the “European Clean Transport Systems Initiative”, the “Expert Group
on Future Transport Fuels” outlines recommendations for measures addressing challenges for the
deployment of electric vehicles in the broader context of an alternative fuels strategy for Europe
(European Expert Group on Future Transport Fuels, 2011a and 2011b). Electric vehicle sales in
Europe are still comparatively low and direct exposure of car drivers to electric vehicles is also low.
Selected consumer feedback can be derived from field tests, but these have typically a narrow
regional scope and the methodologies applied to gather the consumer feedback vary between the
different demonstration projects. Several surveys have been performed recently to collect selective
feedback from consumers on electric vehicles (Ernst & Young, 2010), (Bunzeck et al., 2011),
4
(EurotaxGlass, 2011). This present study adds to recent research on the topic by testing the
familiarity of car drivers with electric vehicles, investigating their interest to purchase an electric
vehicle as well as inquiring about their priorities for improving the features of current electric
vehicles. In the study we have tried to make an effort in order to ensure representativeness of the
results for the selected countries. The study results can provide input for the implementation of the
above listed policy initiatives.
This report is part of a broader study, aimed at building a database of load profiles for ElectricDrive vehicles (EDVs)1 based on car use profiles in six European countries (France, Germany, Italy,
Poland, Spain and United Kingdom). The study was performed by the JRC together with TRT and
Ipsos. During the study, car drivers in the six member states were asked to provide travel diaries
and respond to an online questionnaire. More details on the travel diaries as well as the
methodological details of the questionnaire can be found in the report on “Driving and parking
patterns of European car drivers – first European scale mobility survey” (European Commission,
2012b).
This report focuses on the results of the part of the questionnaire that investigated the attitudes of
European car drivers towards electric vehicles. The six member states that were covered in this
questionnaire represented a market share of more than 75% of the total new sales of passenger
cars in the European Union in 2011 (see Figure 1.1) (European Environment Agency, 2012).
Figure 1.1
2011 passenger car market share of the six member states in comparison with other member states
The structure of this report is as follows. Section 2 describes the methodological approach used to
investigate the attitude of European car drivers towards electric cars. Then section 3 presents the
results obtained and section 4 draws conclusions from the survey results. The annex reproduces
the full section of the questionnaire that deals with the attitude survey.
1
For this study EDVs are defined as Plug-in Hybrid Vehicles (PHEV) and Battery Electric Vehicles (BEV). A PHEV is an externally
chargeable hybrid electric vehicle with limited electric performance and electric range although the possibility to drive in electric mode
is expanded by the possibility to plug the battery on the grid. A BEV is a pure battery electric vehicle since there is no internal
combustion engine, but only an electric motor to propel the vehicle, with full performance in electric mode and enlarged - but still
limited - electric range. (JEC 2011)
5
2.
Description of the methodology
The attitudes of car drivers towards electric cars were investigated within the sample survey
carried out to collect car trip diaries in the six European countries. The general methodological
features of the sample survey – sample, full questionnaire, fieldwork – are described in the report
(European Commission, 2012b) together with the key results concerning driving behaviour.
The introductory section of the attitude survey was designed to understand how car drivers in the
six countries consider electric cars. After an initial question where respondents were asked how
familiar they were with the concept of electric cars, a second question was aimed at going into
more details about the knowledge of the electric cars. In this second question a list of statements
about the features of electric cars (e.g. about their cost, their environmental impact, etc.) was
presented and the individuals were asked to indicate their level of agreement with each statement.
A question on the relevance of public incentives to boost the diffusion of electric cars was also
asked in this introductory part.
A second part of the attitude survey was more specifically devoted to elicit how relevant some
features of electric cars were for the respondents and to measure their propensity to consider
electric cars a realistic alternative in case they wanted to purchase a new car. The procedure was as
follows.
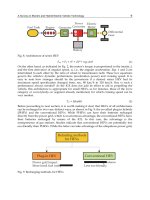
First, a comparison between a generic conventional and a generic electric car was proposed to
respondents in terms of some key variables: car purchase price, operating costs (i.e. the cost
needed to run the car for 100 km), the range of the car, the time needed to re-fuel/re-charge the
car, the maximum speed and the level of well-to-wheel emissions (see Table 2.1). Based on this
comparison, respondents were asked to provide a probability for them to purchase the electric car
rather than the conventional car.
Table 2.1
Key characteristics of generic electric and conventional car
Feature
Car Purchase price2
Distance with one recharge
Re-charge time
Euros per 100 km
Total emissions (well-towheel)
Electric cars currently
available on the market
More in the range of 30,000
Euros or above
150 km
Not less than 30 minutes
2 Euros
low
Conventional cars
More in the range of 20,000
Euros
At least 300 km
5 minutes
10 Euros
high
Subsequently, respondents were asked to assume that they were endowed with a monetary sum
and can use it to improve one of the features of the electric car as described in the initial
comparison. They were asked to indicate which feature they would improve. This exercise was
repeated two more times. Each time the respondent was allowed to choose the same feature to
improve or a different one.
Finally, the individuals were presented with a comparison between the conventional car and the
electric car with the improvements according to their previous choices. Ultimately, they were asked
to indicate the probability of purchasing the improved electric car.
The attitude survey ended with two questions related to the expected future background
concerning the fuel price and the share of electric cars that could be in the car fleet in the future.
The survey was administered to all the surveyed individuals that participated in the broader
questionnaire and fieldwork (population aged 18-74 years) in the 6 European countries during the
period March – June 2012. Completed interviews per member state are:
France: 623 interviews
2
For the non-eurozone member states the prices were given in Euro and local currency (Zloty and Pound Sterling)
6
Germany: 606 interviews
Italy: 613 interviews
Poland: 548 interviews
Spain: 617 interviews
UK: 716 interviews
As explained in detail in the companion report (European Commission, 2012a), a specific weight
has been applied to the raw data, in order to rebalance the (deliberate) dis-proportional design of
the sample and reproduce the (known) characteristics of the reference universe in terms of gender
and age, geographical area, size of city or town, education level, and occupational status. In the
following section all the shown percentages refer to the weighted data, whereas the basis refers to
the actual number of achieved interviews.
3. The survey results
The main results related to the attitude towards the electric cars elaborated from the questionnaire
are presented below. Initially, the background knowledge and the familiarity of respondents with
the electric car are analysed. Then, the preferences for the electric vehicles and the most required
features, as provided in the answers of the respondents, are shown.
3.1.
The background
Respondents have a common expectation regarding the evolution of the price of fuel in the near
future: in all countries the majority of the sample thinks that the price of fuel would increase a lot
in the next 5 years (Figure 3.1). Basically nobody expects that fuel price would decrease.
1
4
2
2
2
2
21
Don't Know
65
59
63
66
71
Increase a lot
73
43
Increase a bit
Remain stable
Decrease a bit
26
3
2
1
3
TOTAL
Base:
total
sample
Figure 3.1
FR
(3723)
(623)
25
28
22
2
3
1
5
4
1
3
1
DE
IT
PL
(606)
(613)
(548)
Decrease a lot
30
32
20
3
5
SP
(617)
1
1
4
UK
(716)
Expectation about the price of fuel in the near future
Regarding the awareness of the electric car, data shows a low level of familiarity with this
technology. The mean score is 5.5 where 1 means “no knowledge at all” and 10 means “full
knowledge” (Figure 3.2). National average scores are similar in the different countries, with Italy,
Spain and UK lying above the overall mean and France and Poland positioned below (Germany
matches the overall mean score). As far as the different age range is concerned, we noticed a
slightly higher level of familiarity for youngest people, in comparison to the other age ranges.
7
Familiarity with the electric car
EC1) Using a score of 1 to 10, how familiar would you say you are with this topic? (Single answer)
mean
5.5
5.5
6.0
4
%
5.0
1
1
2
46
58
47
29
30
14
23
TOTAL
FR
DE
(3723)
(623)
mean
38
27
20
Base: total
sample
35
(606)
25
IT
(613)
4.9
5.9
1
24
5.9
1
38
50
1-5 (not at all
familiar)
29
'6-7 (somewhat
familiar)
21
20
SP
UK
8-10 (very
familiar)
47
40
16
13
PL
(548)
(617)
(716)
5.5
4
5.4
3
40
50
48
31
28
32
20
Figure 3.2
5.4
3
30
Base:
total
sample
5.8
6
46
%
Don't know/ no
answer
23
(3723)
TOTAL
(1123)
18-34 y.o.
19
(1540)
35-54 y.o.
17
(1060)
55-74 y.o.
Familiarity with the electric car
Although the level of familiarity with electric cars among the respondents was somewhat limited,
there were quite optimistic expectations about the number of electric cars sold in the future (i.e.
the market share of electric cars in 10 years from now). 40% of the total sample expects that the
share of electric cars will increase fast, reaching a percentage higher than 20% of the total market
(Figure 3.3). Furthermore, almost one out of five interviewed expects a market share for electric
cars over 40%. Drivers in Italy and Spain (the countries where more respondents declared to be
familiar with electric cars) are more optimistic in terms of future electric car shares than the
average.
8
Expectations about the percentage of electric car sales in the next 10 years
Average%
26,3
11
24,1
10
19,7
7
35,5
25,8
24,0
11
8
32,7
10
Don't know +
no answer
30
up to 10%
24
19
28
27
15
21
11-20%
27
23
22
15
29
23
22
20
31
17
14
TOTAL
FR
DE
IT
(3723)
(623)
(606)
(613)
Figure 3.3
16
21-40%
40%
Base:
total
sample
26
26
27
23
19
37
25
9
>40%
15
13
PL
SP
UK
(548)
(617)
(716)
Expectations about the percentage of electric car sales in the next 10 years
Declared familiarity with electric cars was tested by asking respondents to give their opinion about
several statements concerning electric car features. Answers could range from 1 (= strongly
disagree) to 10 (= strongly agree). Results are shown in Figure 3.4 below where the numbers
within the bars represents the share of respondents providing a certain response and the flags on
the right side identify the countries in which the average score is above the overall mean value
(shown between the bars and the flags).
Despite the declared low level of information and familiarity with this technology, the overall
perception is generally in line with the actual features of electric cars. Overall, people think that
electric cars are quite expensive (75% of the total sample). Moreover, it is generally correctly
perceived that electric cars are not noisy and have no tailpipe emissions (69% of the total sample
agrees with these statements). Some lack of information, however, emerges on how this technology
works in practice. Actually, respondents were not able to express an opinion regarding the
charging time of the battery (one respondent out of 3 was not able to provide the answer), the cost
of the electricity to cover 100 km (in this case the relative majority was unable to provide an
answer), as well as the distance that can be covered between two charges (28% did not answer).
There is also a lack of information regarding the maintenance costs that are considered to be high
by 42% of the sample, while the 33 % gave no answer.
Some statements were in some way more arbitrary. As far as safety is concerned, electric cars were
considered safe for 41% of the sample; only 17% considered the electric car unsafe. However, the
notion of a “safe car” can differ significantly among individuals (e.g. someone thinking of braking
performance, crash safety, or battery safety and risk of thermal runaways). Also the impact of
electric cars on driving pleasure is disputable, so the strong disagreement about this statement is
not directly a matter of knowledge.
9
EC2) Using a scale from 1 to 10 please tell us how much you agree with the following statements about cars
(Single answer)
Total countries
8-10 (strongly agree)
%
'6-7
1-5 (strongly disagree)
69
Electric cars have no tailpipe emissions
Road transport is a major source of emissions which
harm the environment
Driving an electric car is like driving a conventional
car with automatic gears
Electric cars can run for a maximum of 150 km
between two charges.
Electric cars are noisy
15
15
20
6.9
43
6.5
21
25
5.3
6.2
33
77
36
6.8
28
43
22
7.3
18
17
7.6
7.3
33
19
22
5
16
22
23
23
14
17
25
32
100 km cost less than 2 euros
Electric cars have high maintenance costs
16
35
8.6
18
26
36
11
9
22
41
The charging time is never less than 30 minutes
8.7
11
55
Electric cars are safe
mean
12 4 9
75
Electric cars are currently quite expensive
Electric cars increase the pleasure of driving
Don't know/no answer
14
The flags
represent the
countries that
score over the
mean
5.3
Base: total sample (3.723)
Figure 3.4
Agreement with statements on electric cars
Incentives) Do you think government incentives to buy electric car are ... (Single answer)
2
9
5
4
26
30
43
39
38
19
Figure 3.5
16
7
1 4
18
25
84%
Base:
total
sample
6
22
(3723)
(623)
TOTAL
FR
36
No answer
19
6
2
34
DE
29
21
43
42
12
6
33
33
Bad for the
market
Unnecessary
Useful
Important
17
16
(613)
9
(548)
(617)
(716)
IT
PL
SP
UK
16
(606)
7
5
Fundamental
Importance of public incentives for electric cars
The large majority of the sample (84%) considered government incentives to support the diffusion
of electric cars useful or, for the 19% of the total sample, even fundamental (Figure 3.5). This
opinion was particularly widespread in Italy, while in Germany and UK a larger share of
respondents (although still a clear minority) believe that electric car market would be negatively
affected by governmental incentives. The perceived important role of government incentives is not
surprising since, as shown previously, the most recognised feature of current electric cars is their
high price.
3.2.
The propensity towards electric cars
After collecting their opinions, respondents were asked to express their “intention to buy” an
electric car considering the electric vehicles actually available on the market. A short description of
10
the main features of an actual generic electric car were shown in comparison to a generic state of
the art conventional car (Table 2.1); then they were asked to express their opinion about the
chances to buy an electric car, in case they would have to change their current one in the next few
months.
On average a considerable share of car drivers declared that they would prefer to purchase the
electric car rather than the conventional car: nearly 40% of the total sample would go for this
choice (Figure 3.6). While this result is interesting, the percentage value should be interpreted with
great care. It is a characteristic of this kind of surveys that the feedback on purchase considerations
can differ significantly from later purchase behaviour. It is therefore more instructive to look at the
relative differences between the countries and demographic characteristics.
EC3) Taking into account these differences between electric cars and conventional cars, how likely would
you be to buy an electric car if you had to change your current car in the next few months?
Range 0-100%
39%
50%+
10
30%
31%
11
12
54%
49%
6
18
4
43
27%
7
22
33
50%
40
18
26
18
No
answer
Zero
37
17
1-29%
9
16
16
17
20
25
30-49%
18
23
24
18
21
50-69%
29
18
TOTAL
Base:
total
sample
Figure 3.6
(3723)
10
DE
IT
(623)
(606)
(613)
26
13
FR
26
18
70% +
9
PL
(548)
SP
(617)
UK
(716)
Probability of purchasing an electric car with its current average characteristics
However the result shows a geographical differentiation. Basically two groups of countries can be
identified. On the one hand Poland, Spain and especially Italy, where the average declared
probability that the electric car is purchased is close to or even higher than 50% and for more than
one fourth of the sample the probability is 70% or more. On the other hand, France, Germany and
mainly UK, where the average declared probability is around 30% or less.
Differences exist also between different socioeconomic groups as shown in Figure 3.7. Probably the
most remarkable differences are those between groups defined by the intention of buying a car in
the future. Individuals planning to purchase a new car in the next six months declare their
preference for the electric car more than any other group (nearly 43% of probability in comparison
to the average 38%,). Also those planning to purchase a car in a couple of years are above the
average.
It is also interesting that individuals using their car everyday are more prone to purchase an
electric car. Not surprisingly, also respondents declaring a good familiarity with electric cars are
more ready to purchase one.
Above the average are also younger people (40.6%) and those living in metropolitan areas or large
towns. This result seems consistent with the different trip behaviour in these groups emerging
from the trip diaries. From the analysis of the driving profile, in fact, it emerges that young
11
individuals make shorter trip chains and that shorter trip chains are also made in metropolitan
areas and large cities. In both cases, driving behaviour better fits with the use of an electric car.
Likelihood of buying an electric car
EC3) Taking into account these differences between electric cars and conventional cars, how likely would you
be to buy an electric car if you had to change your current car in the next few months?
Base: total
sample
Mean value
Total countries
3 8 ,4
3 8 ,1
(1751)
M ale
(1972)
Female
(1123)
18-34
(1540)
35-54
(1060)
55-74
3 7,0
(1637)
Degree
3 7,1
(2086)
Not degree
(2538)
4 0 ,6
3 7,8
Not working
(443)
4 0 ,5
Large town
(834)
Working
status
3 9 ,4
Large city
(942)
Education
3 7,8
M etropolitan area
(724)
Age
3 8 ,8
Working
(1185)
Gender
3 8 ,7
3 9 ,6
Living area
3 9 ,8
3 7,5
Small town
(780)
Rural area
(1879)
well served
(1330)
partially served
3 7,4
(514)
not well served
3 7,4
(328)
next 6 months
(1179)
next 1-2 year
(1234)
(950)
next 3-5 years
(1673)
not at all familiar
(1108)
quite familiar
(733)
very familiar
3 6 ,1
3 9 ,4
4 2 ,8
4 1,7
4 1,4
3 4 ,0
4 4 ,0
4 0 ,5
almost every day
(445)
Figure 3.7
Familiarity with the
electric car
3 3 ,6
Every day
(1525)
Intention to buy a car in
the future
3 7,9
No
(1753)
Public transport service
3 6 ,8
Once a week
Car usage
3 5,3
Probability of purchasing an electric car with its current average characteristics by socioeconomic
segment
The further step in the analysis of the attitude towards electric car was to explore which of its
current features the individuals would like to improve. As mentioned above, respondents were
asked to choose one feature of the current electric car to improve assuming they had an amount of
money (3,000 Euros3) to spend to achieve the improvement. This choice was repeated three times.
Each time they were allowed to choose one feature only, including the one already chosen. The
starting point, i.e. the current representative features of the electric car and the available
improvements are shown in Table 3.1.
Table 3.1
Current and improved features of electric car
Feature
Starting point
Step 1
Step 2
Step 3
Car Purchase price
Distance with one
recharge
Re-charge time
Re-charge at home
without private garage
Max speed
30,000 €
150 km
27,000 €
200 km
24,000 €
250 km
21,000 €
300 km
2 hours
NO
1.5 hours
Yes
1 hours
Yes
30 minutes
Yes
120 km/h
140 km/h
160 km/h
180 km/h
In this exercise, the first choice is indicative of which feature respondents are more sensitive to.
The preferences of respondents were equally distributed between the possibility of increasing the
distance with one recharge and the possibility to decrease the price; both these alternatives got
3
For the non-eurozone member states the prices were given in Euro and local currency (Zloty and Pound Sterling)
12
32% of preferences (Figure 3.8). The possibility to re-charge the car at home even without the
availability of a private garage was chosen as first improvement by one quarter of the sample.
Recharge time is the first choice only for 9% of the respondents while increasing the maximum
speed is a priority for just a few individuals.
The hierarchy in feature selection is similar in all countries, but with some differences. Car price
wins in Italy and Spain, car range is at top in Germany and UK. In Poland re-charge at home is the
most important feature and also in France is almost as important as car price and range.
Total countries
Base: total respondents (missing not included) = N 3572
%
32
32
25
9
Distance with one
recharge
Car Purchase price
Re-charge at home
without private
garage
2
Re-charge time
Max s peed
Distance with one recharge
32
38
30
23
29
33
Car Purchase price
32
28
38
32
32
28
Re-charge at home
31
23
19
33
21
27
Re-charge time
4
8
11
10
16
10
Max speed
1
3
2
2
2
2
(623)
(606)
(613)
(397)
(617)
(716)
Base: total respondents ( missing
not included)
Figure 3.8
Most chosen improved feature as first choice4
4
In Poland, only 397 respondents participated in this section of the attitude survey. That is why from here onwards, the received answers
from respondents from Poland only add up to 397.
13
Total countries
EC4) Please choose which improvement you would prefer to obtain for 3.000 Euros
Total Respondents
%
Well disposed to buy a specific
electric car: propensity >50%
Distance with
one recharge
32
Distance with
one recharge
Car Purchase
price
32
Car Purchase
price
Re-charge at
home wit hout
private garage
25
9
Re-charge time
Max speed
Figure 3.9
35
Re-charge at
home without
private garage
Re-charge time
2
Max speed
Base : total respondents (missing
not included) N=3572
28
26
10
1
Base: Responde nt willing to buy an electric car:
propensity > 50% N=1845
Very familiar with Electric
Car (8-10)
Distance with
one recharge
36
Car Purchase
price
31
Re-charge at
home without
private garage
20
Re-charge time 10
Max speed
3
Base: Respondent that are v ery familiar with EC
(note 8-10) N=733
Most chosen improved feature as first choice in some groups
As shown in Figure 3.9 respondents who declared a higher level of familiarity with the electric car
find it more important to increase the distance with one recharge than the average respondent
does. Instead, those who are more prone to purchase an electric car would prefer to reduce the car
price first.
The responses after all the three steps provided a different perspective on the relevance of the
attributes. If some attributes are largely dominant they should be chosen in the first step and then
also in the second and third step. Instead, if the respondent changes the attribute step after step
this means that despite the implicit hierarchy, more features are considered of comparable
relevance. Figure 3.10 shows that the preferences after the three steps are quite similar to those
after the first step. This means that either most of the respondents confirmed their choice in all
steps or most of the respondents changed their responses and the characteristics emerged after the
first choice were the most important but were not dominant. In order to understand which of the
two inferences is more correct, the analysis of the “ideal” electric car emerging as result of the
choices is helpful.
As “ideal” electric car we define, for each respondent, the combination of the characteristics after
the three choices have been completed. Certainly, the electric car described by the combination is
“ideal” only under the constraint of the allowed improvements. If these constraints were relaxed it
might well be that e.g. a lower price and a longer range were asked. However, an unconstrained
ideal definition would not be very informative as it would probably converge towards an
unrealistic combination of very low price and features that meet high performance expectations
such as short re-charge time (at home) , a very long range and high top speed.
14
Total countries
%
67
Base: total respondents (missing not included) = N 3572
63
54
42
9
Distance with one
recharge
Car Purchase price
Re-charge at home
without private
garage
Re-charge time
Max speed
Distance with one recharge
68
72
63
63
61
68
Car Purchase price
70
55
71
64
62
60
Re-charge at home
60
53
47
61
52
55
Re-charge time
31
34
44
53
53
45
4
15
7
10
8
6
(606)
(613)
(397)
(617)
Max speed
Base : total re spondents ( missing
not included)
(623)
(716)
Figure 3.10 Most chosen improved features after three choices
From the choices of the respondents as much as 125 different combinations of an “ideal” electric
car emerged. Already this number explains that the sample did not choose some elements
repeatedly. Instead, different attributes were mentioned with a certain hierarchy. Among this large
number of combinations, five of them explain more than half of the preferences; they are
summarised in Table 3.2.
Table 3.2
Main “ideal” combinations of electric car after three choices
Feature
Car Purchase Price
Distance with one recharge
Re-charge time
Re-charge at home
Max Speed
% of preferences
Starting point
30.000 €
150 KM
2 hours
No
120 Km/h
A
B
C
D
PD
27,000 €
200 KM
2 hours
Yes
120 Km/h
30,000 €
200 KM
1.5 hours
Yes
120 Km/h
27,000 €
200 KM
1.5 hours
No
120 Km/h
27,000 €
150 KM
1.5 hours
Yes
120 Km/h
21,000 €
150 km
2 hours
No
120 km/h
17%
12%
9%
7%
11%
Moving from the starting point, the most preferred ideal combination – selected by 17% of
respondents was the one improving purchase price (from 27 to 30 kEuro) as well as driving range
(from 150 km to 200 km) and including the possibility to re-charge at home. 12% of the individuals
would leave price unchanged and rather reduce re-charge time to 1.5 hours. 9% of individuals,
would also reduce re-charge time but would give up re-charging at home. 7% would prefer to
reduce price and re-charge time and would like to re-charge at home even if the range of the car
remain 150 km. Finally, 11% of respondents were actually focused on just one specific feature,
selected for three times: price. So the so called Price Driven (PD) combination represents the third
most chosen.
There are some differences in the preference hierarchy of these combinations across countries
(Figure 3.11). In France the combination A results largely the preferred one (24%) and the
combination “PD” (Price Driven) is the second one. Also in Italy the PD combination is the second
one and is also very close to combination A with a percentage that almost mirrors the most chosen
one. However, despite the fact that also in Spain “purchase price” was the most mentioned relevant
15
feature of electric cars, the PD combination ranked below combination D and at the same level of
combination C while combination B (where purchase price is not reduced) is the most chosen one.
Similarly in Poland the PD combination is less important than the other four. Preferences in UK and
especially in Germany are close to the average of the six countries.
Combinat ion A
Combination B
Combinat ion C
24
16
9
11
7
TOTAL
PD (Price Driven)
%
17
12
Combination D
12
11
6 5
FR
(3572)
(623)
Base: total respondents (missing
not included)
17
16
11
11
8
10
14
12
15
5
DE
7
IT
(606)
(613)
Combination A
11 10
7
PL
(397)
Combination B
16
14
12 13
9
11
9
SP
(617)
Combination C
9 8 9
UK
(716)
Combination D
Car Purchase price
27.000 €
30.000 €
27.000 €
27.000 €
Distance with one recharge
200 Km
200 Km
200 Km
150 Km
Re-charge time
2 hours
1,5 hours
1,5 hours
1,5 hours
Yes
Yes
NO
Yes
120 Km/h
120 Km/h
120 Km/h
120 Km/h
Re-charge at home
Max speed
Figure 3.11 Main “ideal” combinations of electric car after three choices – country differences
After completion of the exercise which led to the description of the respondents’ (constrained)
“ideal” electric car, they were asked again about the probability that they would purchase such an
electric car instead of a conventional vehicle. A higher probability than the one estimated at the
beginning of the exercise was expected (see Figure 3.12). However, this question was aimed also at
assessing the potential of the different combinations describing the “ideal” electric car. Even if the
relative majority of respondents ended their exercise with combination A as description of their
“ideal” electric car, this does not mean that they are keen to purchase this electric car.
Indeed, for all the five main combinations the expressed probability to purchase the electric car is
higher than the expressed probability to purchase an electric car with the current features (38.4%).
However, despite that the combination A was the most chosen, it ranks just third considering the
purchase propensity (47.5%, see numbers at bottom of Figure 3.12). On the other hand,
combination D, that was the less selected among the four main combinations, shows a very good
level of propensity. In other words those who selected combination D seem more “convinced”
about their choice (i.e. expressed a higher level of propensity to buy that particular combination) in
comparison to those selecting “Combination A”. Also the potential of the PD (Price Driven)
combination is above 50%.
16
The probability to buy the “ideal” car
Total countries
EC6) How likely would you be to buy THIS electric car instead of a conventional car if you had to change your
current car? Please indicate a percentage
(17%)
(12%)
50%+ 50%
53%
56%
61%
5
5
5
5
23
25
(9%)
25
(7%)
17
17
22
14
17
25
22
23
25
(11%)
58%
5
Zero
22
1-29%
15
30-49%
24
50-69%
25
(573)
34
30
47,5
34
70% +
(432)
(338)
Combination A Combination B
Overall
liking:
mean
36
50,0
Combination C
47,3
(264)
(377)
Combination D
Price Driven
52,5
51,1
Likelihood of
buying an electric
car mean:
38,4
Base: total respondents (missing not included) =3570
Figure 3.12 Probability of purchasing the “ideal” electric car
This hierarchy of the combinations based on the referred probability of purchasing is not the same
in the surveyed countries (Figure 3.13). Combination D is at the top only for Italy and the UK. In
Spain, France and Germany the “Price Driven” combination is associated with the highest
probability to purchase the electric car. In Poland it is combination B. It is interesting that for the
respondents in France the overall propensity to buy an electric car for combination C is lower than
for the current electric car. This could be an indication that the respondents implicitly assumed that
also the conventional cars on the market will improve over time or other alternative cars will
emerge, which will have an influence on the future value proposition of electric cars.
17
Figure 3.13 Probability of purchasing the “ideal” electric car – country differences
The questionnaire included an open question to investigate the reasons of individuals who are
weakly or not at all interested in buying an electric car (even in its “ideal” version). A number of
responses were obtained, the most relevant are summarised in Figure 3.14.
Two reasons dominate. The first one is related to the price. Among those expressing a low interest
in the purchase of their “ideal” electric car this element is in fact in pole position (56%). The price is
a key element in particular for Italian and Polish respondents. The second one is related to
perceived challenges with batteries (42%), namely problems of recharge time and life expectation
(calendar life/ cycle life) of the battery. Especially in Spain and Germany (48% and, respectively,
47%) respondents are concerned about these aspects.
Other elements referred are far less important. It is worth to mention that in Germany someone is
discouraged by the limited car performance (mainly speed) and both in Germany and UK also
potential detrimental environmental effects are considered as reasons for not purchasing an
electric car.
18
Figure 3.14 Reasons for not being interested in purchasing an electric car
4. Conclusions
The survey on the attitude of European car drivers towards electric cars provided some interesting
outcomes, which can be summarised as follows.
First, several individuals admit not to be very familiar with this topic. However, considering that
very few electric cars are currently available in the market or seen on roads the level of knowledge
is not that bad. Most of the people agree that electric cars are still quite expensive, have zero
tailpipe emissions and are emitting relatively little noise.
Second, many people seem to be keen on purchasing an electric car. The referred probability of
purchasing an electric car in the next future is probably overestimated but there is an undisputable
interest for this alternative.
Third, the clear priority to improve the value proposition of electric cars is to reduce their price and
improve their range – i.e. to give the possibility to maintain the same level of mobility cost and
autonomy that is currently offered by traditional cars. The possibility to re-charge the car at home
for those who do not have a private garage is also a key factor.
The perspective of the European car drivers, as derived from this study, highlights the importance
of further R&D investments to improve some of the performance characteristics of electric vehicles.
It provides some guidance which performance aspects matter most for car drivers, notably costs
and range. The study finds that the familiarity of car drivers with the electric vehicle aspects is
lower when direct exposure or driving experience would be needed to properly assess these
aspects. This stresses the need of demonstration activities in order to increase public awareness of
electro-mobility and also to receive first hand feedback from car drivers on their experience
operating an electric vehicle. A majority of the respondents considers that public incentives are
needed to foster a wider market deployment of electric vehicles. Furthermore the study shows that
an adequate re-charge network is perceived as crucial by car drivers.
It can be concluded that European car drivers see the opportunities that electric vehicles could
offer but that a number of pre-requisites need to be fulfilled in order to ensure that the car drivers
can consider electric vehicles as a credible vehicle choice.
19
5. References
Bunzeck, I.; Feenstra, C.F.J.; Paukovic, M., 2011. Evaluation of potential users of electric cars related
to charging – A survey in eight EU countries.
Ernst & Young, 2010. Gauging interest for plug-in hybrid and electric vehicles in selected markets.
European Commission, 2011. Communication – Whitepaper: Roadmap to a Single European
Transport Area – Towards a competitive and resource efficient transport system. COM(2011)
144.
European Commission, 2012a. Communication - CARS 2020: Action Plan for a competitive and
sustainable automotive industry in Europe. COM(2012) 636.
European Commission, 2012b. Driving and parking patterns of European car drivers –mobility
survey.
European Environment Agency, 2012. Monitoring CO2 emissions from new passenger cars in the
EU: summary of data for 2011.
European Expert Group on Future Transport Fuels, 2011a. Report – Future Transport Fuels.
European Expert Group on Future Transport Fuels, 2011b. Report – Infrastructure for Alternative
Fuels.
EurotaxGlass, 2011. Electrification of the Automotive Industry – The European Consumer’s View.
JEC, 2011. Joint Research Centre, EUCAR, Concawe - WTW GHG-Emissions of Externally Chargeable
Electric Vehicles – Appendix 2 of Well-to-wheels Analysis of Future Automotive Fuels and
Powertrains in the European Context.
20
Annex: The section of the questionnaire related to the electric cars
(ASK ALL)
Section 3: Attitude towards electric cars
SCRIPT: This section is filled in at the end of the week, after the travel diary has been
completed.
DISPLAY:
Welcome to the last section of the questionnaire! Remember that you have to fill this
section in only once.
In this section we shall be dealing with another topic, namely: the electric car. The
electric car is a vehicle that is comparable to your car but that uses exclusively an
electric motor for propulsion and batteries for storing electricity. A driving licence is
needed to drive this type of car. Neither hybrid vehicles nor minicars are considered
here.
EC1) Using a score of 1 to 10, how familiar would you say you are with this topic?
(Please enter your score in the space below)
|__|__|
SCRIPT: SHOW SCALE
1= Not at all
10= Completely
Don’t know
EC2) Using a scale of from 1 to 10 please tell us how much you agree with the following
statements about cars (Please give one answer only for each statement)
SCRIPT: SHOW SCALE
1= I totally disagree
10= I totally agree
Don’t know
SCRIPT RANDOM ITEMS
1.
2.
3.
4.
5.
6.
7.
8.
9.
10.
11.
Road transport is a major source of emissions, which harm the environment.
Driving an electric car is like driving a conventional car with automatic gears. So, in
many respects electric cars are just like conventional cars
Electric cars are currently quite expensive
Electric cars can run for a maximum of 150 km between two charges.
The charging time is never less than 30 minutes
100 km cost less than 2 Euros
Electric cars have no tailpipe emissions
Electric cars are safe
Electric cars have high maintenance costs
Electric cars increase the pleasure of driving
Electric cars are noisy
21
Incentives) Do you think government incentives to buy electric cars are … (please select
one answer only)
SCRIPT ROTATE 1-5 / 5-1
1) Fundamental: only through government incentives will it be possible to buy an electric
car
2) Important: they can speed up the introduction of electric cars into the market
3) Useful, they could be a great help when buying an electric car
4) Unnecessary: when buying an electric car technical features are more important than
price
5) Bad for the market: in that way the market will become totally dependent on government
incentives without being able to develop its own policies.
NEXT SCREEN
SCRIPT SHOW THE TABLE AND THE DISPLAY TOGETHER IN THE SAME SCREEN
DISPLAY A) We are now going to talk about electric cars that are currently available on
the market and conventional cars.
NEXT SCREEN
DISPLAY B): This table shows some features of electric cars currently available on the
market and conventional cars.
Feature
Car Purchase price
Distance with one
recharge
Re-charge time
Euros per 100 km
Total emissions (well-towheel)
Electric cars currently
available on the market
Conventional cars
More in the range of
30,000 Euros or above
150 km
More in the range of
20,000 Euros
At least 300 km
Not less than 30 minutes
2 Euros
low
5 minutes
10 Euros
high
EC3) Taking into account these differences between electric cars and conventional cars,
how likely would you be to buy an electric car if you had to change your current car in
the next few months? Please indicate a percentage
0% __________________________ _______________________________100%
I would definitely
not buy an electric
car
NEXT SCREEN
SCRIPT SHOW :
• DISPLAY B
22
I would definitely buy an
electric car
• TABLE
• EC3
ON THE SAME SCREEN
NEXT SCREEN
DISPLAY: Please now choose from different features of electric cars.
Differences between electric cars and conventional cars are likely to change in the
future, as a result of technological progress or policy measures. Assume you have 3,000
Euros. You can use this sum to improve one and only one feature of the electric car in
the table.
EC4) Please choose which improvement you would prefer to obtain for 3,000 Euros:
Feature
Starting point
Car Purchase price
Distance with one recharge
Re-charge time
Re-charge at home without
private garage
Max speed
30,000 Euros
150 km
2 hours
No
120 km/h
SCRIPT:
THE RESPONDENT IS ALLOWED TO SELECT ONE FEATURE ONLY PER QUESTION.
AFTER THE RESPONDENT HAS MADE HIS/HER CHOICE, SHOW THE IMPROVEMENT
MADE IN THE TABLE BELOW. FOR EXAMPLE, if the respondent selects “price”:
Feature
Car Purchase price
Distance with one recharge
Re-charge time
Re-charge at home without
private garage
Max speed
IMPROVED
Starting point
27.000 Euros
150 km
2 hours
No
30,000 Euros
150 km
2 hours
No
120 km/h
120 km/h
23
NEXT SCREEN
DISPLAY: Assume you have 3,000 more Euros.
Again you can use the money to improve one and only one feature of the electric car
(including the feature you have already chosen to improve)
EC5) Please choose which further improvement you would make with these extra 3,000 Euros:
SCRIPT:
THE STARTING POINT OF THE TABLE FOR EC5 CORRESPONDS TO THE
RESPONDENT’S LAST CHOICE AT EC4), ACCORDING TO THE IMPROVEMENT MADE.
I.E.
IF, AT EC4), THE RESPONDENT SELECTS THE PRICE, THE TABLE WILL BE AS
FOLLOWS:
Feature
Car Purchase price
Distance with one recharge
Re-charge time
Re-charge at home without
private garage
Max speed
Starting point
27,000 Euros
150 km
2 hours
No
120 km/h
Repeated 2 more times (3 in total).
Range of improvements (assuming 3 repetitions of the game)
SCRIPT: BELOW YOU’LL FIND THE COMPLETE MATRIX WHICH INDICATES THE
IMPROVEMENTS THAT CAN BE MADE.
Feature
Car Purchase price
Distance with one recharge
Re-charge time
Re-charge at home without
private garage
Max speed
24
Starting point
Step 2
Step 3
Step 4
30,000
Euros
150 km
2 hours
NO
27,000
Euros
200 km
1.5 hours
Yes
24,000
Euros
250 km
1 hours
Yes
21,000
Euros
300 km
30 minutes
Yes
120 km/h
140 km/h
160 km/h
180 km/h
NEXT SCREEN
DISPLAY: These are the features of the electric car you have selected.
Feature
Improved
Car Purchase price
Range
Re-charge time
Re-charge at home without private garage
Max speed
The content of the table depends on the
answers to the previous questions
EC6) How likely would you be to buy this electric car instead of a conventional car if you
had to change your current car? Please indicate a percentage
0% _______________________________ _______________________________ 100%
I would definitely
I would definitely buy
not buy this
this electric car
electric car
SCRIPT: SHOW DISPLAY TABLE AND EC6 IN THE SAME SCREEN
NEXT SCREEN
(If percentage lower than 30% at Q.EC6)
EC7) Why would you not be interested in buying this electric car? (Please enter your
reply below)
Script: open-ended question
99. Don’t Know
EC8) In the next 10 years what do you think will be the percentage of electric cars sold in
your country? (Please enter a percentage of from 0 to 100% in the box below)
SCRIPT: SHOW SCALE
0% means you think no electric cars will be sold
100% means you think all cars will be electric
|__|__|% Range = 0 – 100
Don’t Know
25