Báo cáo khoa học: Modular metabolic control analysis of large responses The general case for two modules and one linking intermediate docx
Bạn đang xem bản rút gọn của tài liệu. Xem và tải ngay bản đầy đủ của tài liệu tại đây (636.79 KB, 14 trang )
Modular metabolic control analysis of large responses
The general case for two modules and one linking intermediate
Luis Acerenza
1
and Fernando Ortega
2
1 Laboratorio de Biologı
´
a de Sistemas, Facultad de Ciencias, Universidad de la Repu
´
blica, Igua
´
, Montevideo, Uruguay
2 School of Biosciences, The University of Birmingham, UK
The quantitative study of metabolic responses in intact
cells is essential in research programs that require
understanding of the differences in physiological and
pathological cellular functioning or predicting the
phenotypic consequences of genetic manipulations. To
perform this type of studies, a systemic approach
called metabolic control analysis (MCA) was deve-
loped [1–5]. One of its central goals is to determine
how the responses of system variables, quantified by
control coefficients, depend on the properties of the
component reactions, described by elasticity coeffi-
cients.
Predicting the responses of intact cellular systems to
environmental and genetic changes has not been an
easy task. This could explain the lack of success in
many biotechnological and biomedical applications
that require changing metabolic variables in a pre-
established way [6,7]. Two of the major challenges to
understanding metabolic responses are the structural
complexity of the molecular networks sustaining cellu-
lar functioning and the nonlinearity inherent in the
interaction and kinetic laws involved. In the develop-
ment of MCA, some strategies have been devised to
deal with these difficulties.
Keywords
metabolic control analysis; metabolic control
design; metabolic responses; modular
control analysis; top-down control analysis
Correspondence
L. Acerenza, Laboratorio de Biologı
´
ade
Sistemas, Facultad de Ciencias, Universidad
de la Repu
´
blica, 4225, Montevideo 11400,
Uruguay
Fax: +598 2 525 8629
Tel: +598 2 525 8618–23, Ext. 139
E-mail:
Note
Dedicated to the memory of Reinhart
Heinrich, one of the fathers of Metabolic
Control Theory
(Received 5 October 2006, accepted
7 November 2006)
doi:10.1111/j.1742-4658.2006.05575.x
Deciphering the laws that govern metabolic responses of complex systems
is essential to understand physiological functioning, pathological conditions
and the outcome of experimental manipulations of intact cells. To this aim,
a theoretical and experimental sensitivity analysis, called modular meta-
bolic control analysis (MMCA), was proposed. This field was previously
developed under the assumptions of infinitesimal changes and ⁄ or propor-
tionality between parameters and rates, which are usually not fulfilled
in vivo. Here we develop a general MMCA for two modules, not relying on
those assumptions. Control coefficients and elasticity coefficients for large
changes are defined. These are subject to constraints: summation and
response theorems, and relationships that allow calculating control from
elasticity coefficients. We show how to determine the coefficients from top-
down experiments, measuring the rates of the isolated modules as a func-
tion of the linking intermediate (there is no need to change parameters
inside the modules). The novel formalism is applied to data of two experi-
mental studies from the literature. In one of these, 40% increase in the
activity of the supply module results in less than 4% increase in flux, while
infinitesimal MMCA predicts more than 30% increase in flux. In addition,
it is not possible to increase the flux by manipulating the activity of
demand. The impossibility of increasing the flux by changing the activity of
a single module is due to an abrupt decrease of the control of the modules
when their corresponding activities are increased. In these cases, the infini-
tesimal approach can give highly erroneous predictions.
Abbreviations
ANT, adenine nucleotide translocator; MCA, metabolic control analysis; MMCA, modular metabolic control analysis.
188 FEBS Journal 274 (2007) 188–201 ª 2006 The Authors Journal compilation ª 2006 FEBS
Regarding network complexity, top-down or modu-
lar strategies have been proposed [8–10]. These strat-
egies abstractly divide the system into modules,
lumping together irrelevant (and unknown) compo-
nents and representing explicitly only the processes
that we are interested in describing. The aim is to sti-
mulate and measure the responses using the intact sys-
tem, so that we are certain that the analysis performed
and the conclusions obtained apply to this system.
To deal with nonlinearity two assumptions have been
made. The first is that metabolic perturbations and
responses are small, so that they can be described using
a first order infinitesimal treatment. The second
assumption is that in vivo enzyme catalysed reaction
rates are proportional to the corresponding enzyme
concentrations, as is normally the case when measured
in diluted in vitro conditions. It is important to note
that, to our knowledge, all the developments in steady-
state MCA have included at least one of these two
assumptions [11,12]. However, many, if not most, of
the responses exhibited by metabolic systems subject to
environmental changes or genetic manipulations
involve large changes in metabolic variables. Moreover,
the assertion that in vivo rates are proportional to
enzyme concentration is difficult to justify. The cyto-
plasm of cells is far from being diluted, showing a very
crowded state where the validity of the proportionality
found in vitro has still not been demonstrated [13].
Attempts to extend infinitesimal control analysis to
large changes in the variables have been reviewed in
previous publications [5,12]. Our previous contribu-
tions to extend infinitesimal modular metabolic control
analysis (MMCA) consisted on the following steps.
First, control coefficients for large changes were
defined and summation theorems, in terms of enzyme
concentrations, derived [14]. Expressions to calculate
these control coefficients in terms of the elasticity coef-
ficients for large changes were obtained [12,15]. How-
ever, the interpretation of the results of all these
previous contributions to MMCA for large changes
requires that the rates of the steps are proportional to
the corresponding enzyme concentrations.
In the present contribution, we develop an MMCA
that applies to steady-state responses of any extent and
that does not assume proportionality between reaction
rates and parameters. Therefore, it applies to any
parameter (enzyme concentration, external effector,
etc.), irrespective of its functional relationship with the
reaction rate. To achieve this, rate control coefficients
(where parameters are not specified) and p-elasticity
coefficients for large changes were defined. Combining
these two types of newly defined coefficients, we derive
response theorems, which are essential to study the
response of metabolic variables to external activators
or inhibitors. We also show, in the framework of large
changes, that rate control coefficients verify the same
constraints (summation theorems, etc.) as those satis-
fied, when rates are proportional to enzyme concentra-
tions, by enzyme response coefficients. Another central
result is that the rate control coefficients can be used
to determine the flux and intermediate changes that
would be obtained by changing the rates of the isola-
ted modules by large factors. These relationships are
useful to analyse where to modulate the system in
order to change a variable in a desirable way, or to
speculate about possible sites at which cell physiology
operates to modify the variables, when adapting to dif-
ferent conditions. All the quantities and relationships
developed here may be applied to data obtained from
top-down experiments. Notably, this type of experi-
ment may be performed by direct modulation of the
intermediate, without changing parameters inside the
modules. The way the formalism is applied and
the type of conclusions that can be drawn are illustrated
with two studies, taken from the literature, performed
using top-down experiments: the control of glycolytic
flux and biomass production in Lactococcus lactis [16]
and the control of oxidative phosphorylation in isola-
ted rat liver mitochondria [17].
Results
The modular approach to large metabolic
responses
A central issue to solving many biotechnological and
biomedical problems is to assess how to modulate a
metabolic system in order to obtain a pre-established
change in the concentration of an intermediate or a
flux. Within the framework of reductionist approaches,
the studies to solve this type of problem are performed
on isolated component reactions, reconstructed small
portions of the network or extracts. As a consequence,
the results obtained may not be extrapolated with con-
fidence to the in vivo system because, in the reduction
process, it is more likely that relevant interactions are
lost. In contrast, modular approaches study the intact
system and therefore the conclusions obtained apply to
this system.
Let us consider a metabolic network with any num-
ber of intermediates and reactions. In the modular
approach, we focus on an intermediate S which divides
the system into two parts or modules (Scheme 1). The
system has three variables: the concentration of the
linking intermediate (S), the rate at which the interme-
diate is produced by the supply module (v
1
) and the
L. Acerenza and F. Ortega Metabolic control analysis of large responses
FEBS Journal 274 (2007) 188–201 ª 2006 The Authors Journal compilation ª 2006 FEBS 189
rate at which it is consumed by the demand module
(v
2
) [18]. In this strategy, it is assumed that the only
interactions between modules are linking intermediates
[10]. A module could be an enzyme catalysed reaction,
a metabolic pathway, a large portion of metabolism
(i.e., carbohydrate metabolism), an organelle (e.g.,
mitochondria) or a cell.
The rate v
1
depends on S and on all the parameters
belonging to the supply module. Similarly, v
2
depends
on S and on the parameters belonging to the demand
module. Examples of parameters could be the concen-
trations of external substrates, products or effectors
and the concentrations of enzymes. The functional
dependence of v
1
and v
2
on S and on the parameters
could be very complex because, in the case that mod-
ules are large portions of metabolism, many enzyme
catalysed reactions and metabolites are involved. But,
for our purposes, we only need to consider explicitly
one parameter for each module: p
1
for the supply
module and p
2
for the demand module. In this context,
the functional dependence of the rates could be
expressed as follows: v
1
¼ v
1
(S, p
1
) and v
2
¼ v
2
(S, p
2
).
Note that proportionality between rates and parame-
ters is not assumed in this treatment. At steady state,
both rates are equal to the flux, J (v
1
¼ v
2
J).
There are three types of metabolic changes relevant
to the modular control analysis that we shall develop
below. In the first, p
1
(or p
2
) is changed and the pertur-
bation propagates throughout the system, with S and J
settling to new steady-state values. In the second type,
S is kept at a constant value by some external means so
that when p
1
(or p
2
) is changed, the perturbation will
not be able to propagate to the other module, resulting
in different final values of v
1
and v
2
. In the third type,
one changes S without changing any parameter of the
system (for example, adding an auxiliary reaction
which consumes S), also resulting in different changes
in the rates. These three types of metabolic changes are
the basis for the definitions of response (and control),
p-elasticity and e-elasticity coefficients for large chan-
ges, respectively, given below.
Quantification of metabolic responses
The sensitivity of response of a steady-state variable, w
(usually metabolite concentration, S, or flux, J)toa
large change in a parameter, p
i
, from an initial state o
to a final state f, is quantified by the mean-response
coefficient (or mean-sensitivity coefficient) [14]:
R
w
pi
¼
w
f
w
o
À 1
p
f
i
p
o
i
À 1
!,
ð1Þ
It represents the relative change in the variable divided
by the relative change in the parameter that originated
the variable change. This sensitivity coefficient is a sys-
temic property because the effect of the parameter
change propagates through all the system. Because, in
Scheme 1, we have two system variables, S and J, and
two parameters, p
1
and p
2
, we will consider four of
these coefficients:
R
S
p1
, R
S
p2
, R
J
p1
and R
J
p2
.
Next, the parameter, p
i
, is changed, keeping S at a
fixed value. For the sake of convenience, S is kept at
the value S
f
, i.e., the value of the final state that S
would reach if the parameter was changed without
keeping S fixed (definition of response coefficient given
above). We shall quantify the sensitivity of the rate, v
i
,
to a large change in p
i
, from an initial value p
o
i
to a
final value p
f
i
, by the mean p-elasticity coefficient:
p
vi
pi
¼
v
ff
i
v
fo
i
À 1
!
p
f
i
p
o
i
À 1
!,
ð2Þ
Here we have used the compact notation:
v
ab
i
¼ v
i
ðS
a
; p
b
i
Þ. Having two rates and two parameters
there are four mean p-elasticity coefficient: p
v1
p1
, p
v1
p2
, p
v2
p1
and p
v2
p2
. Because v
1
is independent of p
2
and v
2
inde-
pendent of p
1
it follows that: p
v1
p2
¼ p
v2
p1
¼ 0. p-Elasticity
coefficients represent the sensitivities of the rates of the
isolated component modules to changes in the parame-
ters.
Finally, we consider that the concentration, S,is
changed by some external means, without changing the
parameters p
i
. The sensitivity of the rate, v
i
, to a large
change in S, from an initial value S
o
to a final value S
f
,
is quantified by the mean e-elasticity coefficient [12]:
e
vi
S
¼
v
fo
i
v
oo
i
À 1
!
S
f
S
o
À 1
ð3Þ
Here we have also used the notation: v
ab
i
¼ v
i
ðS
a
; p
b
i
Þ.
Having two rates and one intermediate there are two
e-elasticity coefficients:
e
v1
S
and e
v2
S
. These e-elasticity
coefficients represent the sensitivity of the rate of the
supply module to changes in the concentration of its
product and the sensitivity of the rate of the demand
module to changes in the concentration of its sub-
strate, respectively.
In the case of mean elasticity coefficients, p
i
and S
both play the role of parameters. But note that while
S
v
1
v
2
supply demand
Scheme 1. Metabolic system constituted by a supply module (1)
and a demand module (2) linked by one intermediate S.
Metabolic control analysis of large responses L. Acerenza and F. Ortega
190 FEBS Journal 274 (2007) 188–201 ª 2006 The Authors Journal compilation ª 2006 FEBS
in the definition of mean p-elasticity coefficients the
change in the rate with p
i
is performed keeping S at
the final value, in the definition of mean e-elasticity
coefficients the change in the rate with S is performed
keeping p
i
at the initial value.
Parameter changes affect S or J through the effects
on the rates to which the parameters belong. Control
coefficients can, therefore be defined in terms of rates,
i.e., as relative change in the variable divided by the
relative change in rate that produced the variable
change [11,19,20]. More specifically, a parameter p
i
is
changed from the initial value p
o
i
to a final value p
f
i
,at
fixed S, producing a change in the rate v
i
. As in the
definition of mean p-elasticity coefficients [Eqn (2)],
the rate change is evaluated at S ¼ S
f
. To quantify the
sensitivity of response of the steady-state variable w to
a large change in the rate v
i
we define the mean-control
coefficient:
C
w
vi
¼
w
f
w
o
À 1
v
ff
i
v
fo
i
À 1
!,
ð4Þ
Remember that: v
ab
i
¼ v
i
ðS
a
; p
b
i
Þ. The value taken by
this coefficient is a system property, because the effect
of the rate change propagates throughout. There are
four of these coefficients:
C
S
v1
, C
S
v2
, C
J
v1
and C
J
v2
.
It can be easily shown, using Eqns (1), (2), and (4),
that the two types of control coefficients defined above
[Eqns (1) and (4)] are related by the response theorem:
R
w
pi
¼ C
w
vi
p
vi
pi
ð5Þ
w stands for S or J and i ¼ 1,2. This theorem states
that the effect that a change in a parameter has on a
metabolic variable depends on two factors: the local
effect that the parameter has on the isolated rate
through which it operates and the systemic effect that
a change in rate has on the metabolic variable. If the
parameter p
i
is an enzyme concentration or other inter-
nal parameter its initial value, p
o
i
, is not zero and its
relative change ðp
f
i
=p
o
i
À 1Þ has a finite value. In this
case, the coefficients
R
w
pi
and p
vi
pi
are well defined. But,
if p
i
is an external effector (inhibitor, activator or new
enzyme activity), p
o
i
will normally be zero and the coef-
ficients would tend to infinity. This could easily be
solved by replacing in the definitions of
R
w
pi
and p
vi
pi
relative changes in p
i
by the corresponding absolute
changes, i.e., replacing ð p
f
i
=p
o
i
À 1Þ by ðp
f
i
À p
o
i
Þ¼p
f
i
.
The rates of the supply and demand modules, v
i
, are
non zero and therefore the coefficients
C
w
vi
are always
well defined.
One of the central aims of the present work is to
show how the coefficients
C
w
vi
can be calculated using
data obtained from top-down experiments. In this type
of experiment only the rates of the modules for differ-
ent values of the intermediate concentration are deter-
mined, the measurement of parameter values not being
necessary. However, to derive the equations that calcu-
late the values of
C
w
vi
from measurements of v
1
, v
2
and
S, the effect that particular changes in the parameter
values would have on the variables will be analysed.
These particular parameter changes and their conse-
quences on the values of the variables are the subject
matter below.
Parameter changes
We shall assume that the system starts at a reference
state o, where the parameters, rates and variables take
the values: p
o
1
, p
o
2
; v
oo
1
; v
oo
2
; S
o
and J
o
(Table 1). We shall
consider six different ways of modifying the initial
state, o, which give the final states: x
sp
, y
sp
, x
p
, y
p
, x
s
and y
s
. In two of them, one parameter is changed (p
1
or p
2
) and the variables (S and J) freely adjust to the
final steady state. If p
1
is changed the final state is x
sp
and if p
2
is changed the final state is y
sp
(Table 1). The
second two ways of modifying the system is to change
a parameter, keeping S at a fixed value. In this case, if
p
1
is changed the final state is x
p
, S being kept at the
constant value S
x
, and if p
2
is changed the final state is
y
p
, S being kept at S
y
(Table 1). Finally, the third two
ways of modifying the system are to change S by some
external means, without changing any parameter; S
will be changed from S
o
to S
x
and from S
o
to S
y
,
being the final states x
s
and y
s
, respectively (Table 1).
We call r
1
the factor by which the rate v
1
changes
when we go from state x
s
to state x
sp
, i.e., when p
1
is
changed from p
o
1
to p
x
1
, keeping S fixed at S
x
. Similarly,
we call r
2
the factor by which the rate v
2
changes when
we go from state y
s
to state y
sp
, i.e., when p
2
is chan-
ged from p
o
2
to p
y
2
, keeping S fixed at S
y
. As was men-
tioned above, to develop the theory for a MMCA for
large changes we need to consider particular changes
in the parameters. These particular parameter changes
Table 1. Different ways of modifying the reference state. Details
given in text [note that v
ab
i
¼ v
i
ðS
a
; p
b
i
Þ].
p
1
p
2
v
1
v
2
SJ
o p
0
1
p
0
2
v
00
1
v
00
2
S
0
J
0
x
sp
p
x
1
p
0
2
v
xx
1
v
x0
2
S
x
J
x
y
sp
p
0
1
p
y
2
v
y0
1
v
yy
2
S
y
J
y
x
p
p
x
1
p
0
2
v
xx
1
v
x0
2
S
x
y
p
p
0
1
p
y
2
v
y0
1
v
yy
2
S
y
x
s
p
0
1
p
0
2
v
x0
1
v
x0
2
S
x
y
s
p
0
1
p
0
2
v
y0
1
v
y0
2
S
y
L. Acerenza and F. Ortega Metabolic control analysis of large responses
FEBS Journal 274 (2007) 188–201 ª 2006 The Authors Journal compilation ª 2006 FEBS 191
are those resulting in r
2
equal to the reciprocal of r
1
.
In equations, we have (Table 1):
r
1
B
v
xx
1
v
xo
1
and r
2
B
v
yy
2
v
yo
2
with r
2
¼
1
r
1
ð6Þ
If p
1
and p
2
are changed so that Eqn (6) is fulfilled,
the values of the variables satisfy the following rela-
tionships (see Appendix for proof):
S
x
¼ S
y
and J
x
¼ r
1
J
y
ð7Þ
As a consequence of the steady state condition, and
Eqns (6) and (7), eight equalities between the rates are
fulfilled:
J
o
¼ v
oo
1
¼ v
oo
2
J
x
¼ v
xx
1
¼ v
xo
2
¼ v
yo
2
J
y
¼ v
yy
2
¼ v
yo
1
¼ v
xo
1
ð8Þ
Therefore, experimental determination of three rates,
J
o
, v
xo
1
and v
yo
2
, allows the calculation of the 11 rates
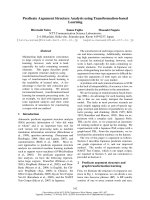
involved (Table 1). In Fig. 1, we give a graph (similar
to the graph of combined rate characteristics used by
Hofmeyr and Cornish-Bowden [18]) representing the
effects on the rates of two sets of parameter changes,
one fulfilling and the other not fulfilling the condition
given in Eqn (6).
Next, we will derive useful relationships involving
the mean control coefficients [defined in Eqn (4)] and
the mean e-elasticity coefficients [defined in Eqn (3)].
Relationships between system properties and
module properties
The fundamental relationships of MMCA for large
changes, in the case of two modules, are the following:
C
J
v1
¼ e
v1
S
C
S
v1
þ e
v1
S
ðr
S
À 1Þþ1
C
J
v2
¼ e
v1
S
C
S
v2
C
J
v1
¼ e
v2
S
C
S
v1
C
J
v2
¼ e
v2
S
C
S
v2
þ e
v2
S
ðr
S
À 1Þþ1
ð9Þ
where r
s
¼ S
x
⁄ S
o
¼ S
y
⁄ S
o
. These four equations are
the starting point to derive all the other relationships
and theorems for large changes given below. Their
validity can be tested using Eqns (3) (4), (6), (7) and
(8), and Table 1.
Equation (9) can be solved to obtain the mean
control coefficients in terms of the mean e-elasticity
coefficients and r
s
. The result is:
C
J
v1
¼
e
v2
S
ðe
v1
S
ðr
S
À 1Þþ1Þ
e
v2
S
À e
v1
S
C
J
v2
¼
Àe
v1
S
ðe
v2
S
ðr
S
À 1Þþ1Þ
e
v2
S
À e
v1
S
C
S
v1
¼
e
v1
S
ðr
S
À 1Þþ1
e
v2
S
À e
v1
S
C
S
v2
¼
Àðe
v2
S
ðr
S
À 1Þþ1Þ
e
v2
S
À e
v1
S
ð10Þ
From these equations it is easily shown that mean con-
trol coefficients fulfil the following summation theo-
rems:
C
J
v1
þ C
J
v2
¼ 1 ð11Þ
C
S
v1
þ C
S
v2
¼ 1 À r
s
ð12Þ
The factors r
1
and r
2
can also be calculated in terms of
the mean e-elasticity coefficients and r
s
:
r
1
¼
1
r
2
¼
e
v2
S
ðr
S
À 1Þþ1
e
v1
S
ðr
S
À 1Þþ1
ð13Þ
This relationship was obtained using Eqns (4), (6), (7)
and (10).
Fig. 1. Rates versus S. Schematic representations when condition
Eqn 6 (A) is not fulfilled and (B) is fulfilled.
Metabolic control analysis of large responses L. Acerenza and F. Ortega
192 FEBS Journal 274 (2007) 188–201 ª 2006 The Authors Journal compilation ª 2006 FEBS
Solving Eqn (13) for (r
s
) 1) and replacing the
resulting expression into Eqn (10) gives:
C
J
v1
¼
e
v2
S
e
v2
S
À r
1
e
v1
S
C
J
v2
¼
Àr
1
e
v1
S
e
v2
S
À r
1
e
v1
S
C
S
v1
¼
1
e
v2
S
À r
1
e
v1
S
C
S
v2
¼
Àr
1
e
v2
S
À r
1
e
v1
S
ð14Þ
These expressions constitute a different way to calcu-
late the mean control coefficients in terms of the mean
e-elasticity coefficients, to the one given in Eqn (10).
Finally, expressions to calculate the mean e-elasticity
coefficients from the mean control coefficients, i.e., the
metabolic control design equations for large changes,
can be readily obtained from Eqn (14).
e
v1
S
¼
C
J
v2
C
S
v2
e
v2
S
¼
C
J
v1
C
S
v1
ð15Þ
Equations (9) to (13) are valid independently of the
functional relationship between the rates v
1
and v
2
,
and the corresponding parameters p
1
and p
2
. They
were previously derived under the restrictive assump-
tion that the rates are proportional to the correspond-
ing enzyme concentrations [12,14,15]. It is easy to
show that when the changes of the parameters and
rates are small (r
1
and r
s
tend to one) they reduce to
the well-known relationships of traditional MCA,
based on infinitesimal changes [1–5,21–23].
Up to this point, the analysis performed did not
require the measurement of parameter values. In fact,
to calculate
C
S
v1
, C
S
v2
, C
J
v1
and C
J
v2
, only measurements
of S
o
, S
x
, J
o
, v
xo
1
and v
yo
2
are needed. Nevertheless, if
we want to determine
R
S
p1
, R
S
p2
, R
J
p1
and R
J
p2
, the initial
and final values of the parameter, p
o
1
, p
x
1
, p
o
2
and p
y
2
,
and the corresponding rates have to be known, in
order to calculate the mean p-elasticity coefficients
(Eqn 2).
With these, the mean response coefficients (Eqn 1),
are obtained introducing Eqn (2) and (10) into the
response theorems (Eqn 5).
The relationships that we have derived show that
the control coefficients for large changes are subject to
constraints, which condition the responses of the meta-
bolic variables to parameter changes. As a conse-
quence, an important issue in MCA is to determine
how a variable (w) would respond if a parameter or a
rate of the system is modulated with a large change.
The mean control coefficients can be used to perform
this calculation, employing the following equation,
derived from Eqn (4).
w
f
w
o
¼ 1 þ C
w
vi
ðr
i
À 1Þ with i ¼ 1; 2 ð16Þ
where w
0
and w
f
are the initial and final values of the
variable (intermediate or flux), respectively,
C
w
vi
is the
mean control coefficient (Eqn 10), and r
i
is the factor
by which the rate of the isolated module i has been
changed (Eqn 13). If
C
w
vi
and (r
i
– 1) have the same
sign the variable increases and if they have opposite
signs the variable decreases. Rate changes are pro-
duced by parameter changes. The change in the vari-
able that results from the change in a particular
parameter, p
i
, can be calculated with an analogous
equation to Eqn (16):
w
f
=w
o
¼ 1 þ C
w
vi
p
vi
pi
p
f
i
=p
o
i
À 1
with i ¼ 1; 2:
Calculation of systemic responses from top-down
experiments
Next, we shall show how the mean control coefficients
may be calculated from top-down experiments using
the relationships derived in the previous section.
Adding to Scheme 1 an auxiliary reaction, it is poss-
ible to modulate the concentration of the intermediate,
S, and measure the rates of the supply and demand
modules, v
1
and v
2
. Applying fitting procedures to the
table of experimental values v
1
, v
2
and S, continuous
functions, represented by v
1
(S) and v
2
(S), can be
obtained. These two functions are the basis for all the
calculations.
In the reference state, o, the auxiliary rate is zero:
S ¼ S
o
, v
1
¼ v
oo
1
¼ v
1
ðS
o
Þ and v
2
¼ v
oo
2
¼ v
2
ðS
o
Þ. When
the auxiliary rate is gradually changed, the values
taken by intermediate and rates are: S ¼ S
x
¼ S
y
,
v
1
¼ v
xo
1
¼ v
1
ðSÞ and v
2
¼ v
yo
1
¼ v
2
ðSÞ. The mean e-elas-
ticity coefficients (Eqn 3), expressed in terms of the
fitting functions, are given by:
e
v1
S
¼
v
1
ðSÞ
v
1
ðS
o
Þ
À 1
S
S
o
À 1
e
v2
S
¼
v
2
ðSÞ
v
2
ðS
o
Þ
À 1
S
S
o
À 1
ð17Þ
Introducing these functions and r
s
¼ S ⁄ S
o
into
Eqns (10) and (13) we obtain
C
S
v1
, C
S
v2
, C
J
v1
, C
J
v2
, r
1
and
r
2
as a function of S. With these functions several plots
can be built. We can represent C
S
v1
, C
S
v2
, C
J
v1
, C
J
v2
,
L. Acerenza and F. Ortega Metabolic control analysis of large responses
FEBS Journal 274 (2007) 188–201 ª 2006 The Authors Journal compilation ª 2006 FEBS 193
C
S
v1
þ C
S
v2
and C
J
v1
þ C
J
v2
as a function of S ⁄ S
o
. These
plots show how the overall control, given by the sum-
mation theorems (Eqns 11 and 12), is distributed
among the blocks. On the other hand, we can repre-
sent
C
S
v1
and C
J
v1
as a function of r
1
, and C
S
v2
and C
J
v2
as a function of r
2
. These are useful to analyse how
the control of each module varies as its activity chan-
ges. In the case of the flux the control normally drops
when the activity is increased.
The procedure of analysis that we have described
does not require the measurement of parameter values.
But, as was mentioned above, to calculate the mean
p-elasticity coefficient,
p
v1
p1
and p
v2
p2
, and the mean
response coefficients,
R
S
p1
, R
S
p2
, R
J
p1
and R
J
p2
, the param-
eter values, p
o
1
, p
x
1
, p
o
2
and p
y
2
, and the rates for these
parameter values must be measured. The calculations
for the case of parameters acting, say, on the rate v
1
are performed as follows. The increase in the param-
eter from p
o
1
to p
x
1
, results in a new steady state in the
intermediate, S
x
. p
v1
p1
, C
S
v1
and C
J
v1
are evaluated at S
x
.
Introducing these values in the response theorems
(Eqn 5),
R
S
p1
and R
J
p1
are obtained. An analogous pro-
cedure can be followed to calculate
R
S
p2
and R
J
p2
.
Finally, using Eqn (16), the mean control coefficients
can be used to calculate the change in the system vari-
able (w ¼ J or S) that could be obtained with a large
change in the rate of the isolated module by a factor r.
For this purpose, the ratios J
f
⁄ J
o
and S
f
⁄ S
o
are plotted
as a function of r, for each one of the modules. These
plots show where and in what extent the system has to
be modulated in order to obtain a desirable change in
a variable.
Below, we will apply this analysis to data deter-
mined with top-down experiments obtained from the
literature.
Analysis of experimental cases
Here, we shall apply the formalism developed in two
studies, performed using top-down experiments. The
first analyses the control of glycolytic flux and biomass
production of L. lactis [16] and the other studies the
control of oxidative phosphorylation in isolated rat liver
mitochondria [17]. The choice of these cases was not
based on the particular interest of the systems studied,
but on the appropriateness of the examples to illustrate
the application of the analysis developed in this work.
In the study of Koebmann and colleagues [16],
energy metabolism of L. lactis was split into a supply
module, that produces ATP (glycolytic module or
module 1), and a demand module, that consumes ATP
(biomass production module or module 2). The inter-
mediate is the ratio of concentrations ATP ⁄ ADP
(Scheme 1 with S ¼ ATP ⁄ ADP). Top-down experi-
ments consisted of varying the ATP ⁄ ADP ratio and
measuring the supply and demand rates independently.
The decrease in the ATP ⁄ ADP ratio was achieved by
overexpressing the hydrolytic part of the F1 domain of
the (F
1
F
2
)H
+
-ATPase, that increases ATP consump-
tion. To perform an infinitesimal top-down control
analysis at the reference state, the authors obtained fit-
ting functions for the experimental values of v
1
and v
2
versus S. These functions are adequate for their pur-
pose, but they are not sufficiently good for points
away from the reference state, which should be consi-
dered when performing a top-down control analysis
for large changes. Here, the values of v
1
and v
2
versus
S were fitted to the following functions: v
1
(S) ¼
82.14 S
0.4
⁄ (0.8574 + 0.2107 S
0.75
) and v
2
(S) ¼ 2.325
S
3.5
⁄ (2.253 + 0.02219 S
3.5
) (Scheme 1). As mentioned
above, these two functions are the basis for all our cal-
culations. The parameters of the fitting functions do
not have units, because S (i.e., ATP⁄ ADP) is dimen-
sionless and the values of the rates are expressed as a
percentage of the rate at the reference state. The refer-
ence state is S
o
¼ 9.7 and the ratios S ⁄ S
o
, studied
experimentally, are in the interval (0.49, 1). The mean
e-elasticity coefficients,
e
v1
S
and e
v2
S
, are calculated
replacing the fitting curves given above, v
1
(S) and
v
2
(S), in Eqn (17). e
v2
S
is always positive. This is the
sign normally expected because a substrate is an acti-
vator of the reaction rate, its increase normally result-
ing in an increase in rate.
e
v1
S
, a product elasticity,
exhibits the normal (negative) sign around the refer-
ence state (S
o
¼ 9.7). However, at approximately S ¼
6.24 the elasticity vanishes, taking a positive sign under
this value. This behaviour represents ‘product activa-
tion’ of S on the rate of module 1. Finally,
C
S
v1
, C
S
v2
,
C
J
v1
, C
J
v2
, r
1
and r
2
are obtained, introducing the expres-
sions for the mean e-elasticity coefficients and r
s
¼
S ⁄ S
o
into Eqn (10) and (13). At the reference state
(when S tends to S
o
), these expressions give the values
of the infinitesimal control coefficients: C
J
v1
¼ 0:80,
C
J
v2
¼ 0:20, C
S
v1
¼ 6:55 and C
S
v2
¼À6:55. In Fig. 2 we
represent
C
S
v1
, C
S
v2
, C
J
v1
, C
J
v2
, C
S
v1
þ C
S
v2
and C
J
v1
þ C
J
v2
as
a function of S ⁄ S
o
.
C
J
v1
þ C
J
v2
is always one, according to what it states
in the flux summation relationship for large changes
(Eqn 11). In the region of S⁄ S
o
values between 0.49
and 0.65, C
J
v1
> 1 and C
J
v2
< 0. This is due to the posit-
ive sign of the product elasticity,
e
v1
S
, in this region. In
addition, the values
C
J
v1
and C
J
v2
are quantitatively very
different from those obtained with infinitesimal chan-
ges (Fig. 2A). The concentration summation relation-
ship (Eqn 12) states that in the case of large changes
C
S
v1
þ C
S
v2
is not equal to zero. Because in all the
Metabolic control analysis of large responses L. Acerenza and F. Ortega
194 FEBS Journal 274 (2007) 188–201 ª 2006 The Authors Journal compilation ª 2006 FEBS
experimental range S £ S
o
, the sum of the coefficients
is positive. In this case,
C
S
v2
is negative and slightly
smaller in absolute value than
C
S
v1
, which is positive.
Only at the reference state, both coefficients take the
same absolute value, i.e., when the changes are infini-
tesimal (Fig. 2B).
Next, we represent
C
S
v1
and C
J
v1
as a function of r
1
,
and C
S
v2
and C
J
v2
as a function of r
2
in two parametric
plots:
C
J
v1
and C
J
v2
in Fig. 3A and C
S
v1
and C
S
v2
in
Fig. 3B. These are useful plots to analyse how the flux
and concentration control of each module changes as
the activity of the corresponding module is increased.
For the flux control, we obtain the normal behaviour,
i.e., the control of both modules diminishes as their
activity is increased (Fig. 3A). In addition,
C
J
v1
is
greater than
C
J
v2
in all the range of r factors studied
(0.72, 1.38), but they both fall dramatically in this
rather small range.
C
J
v1
decreases from 1.04 to 0.09 and
C
J
v2
from 0.91 to )0.04. For the concentration control,
the control of the supply module increases and the
control of the demand module decreases, in absolute
terms, when the corresponding activity is increased
(Fig. 3B). In the range studied (0.72, 1.38),
C
S
v1
increa-
ses from 1.9 to 15.9 and À
C
S
v2
decreases from 22.0 to
1.4. At r ¼ 0.72, ÀC
S
v2
is more than 11 times greater
than
C
S
v1
and, at r ¼ 1.38, C
S
v1
is more than 11 times
greater than À
C
S
v2
.Atr ¼ 1, where the mean coeffi-
cients coincide with the infinitesimal coefficients, C
S
v1
and ÀC
S
v2
are equal.
Finally, we determine the changes in the flux and
intermediate that could be obtained by changing the
rates of the modules. This calculation is performed
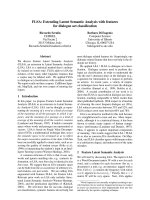
using Eqn (16) and is represented in Fig. 4. Figure 4A
shows that it is not possible to increase the flux signifi-
cantly, which is due to the abrupt decrease in
C
J
v1
and
C
J
v2
with r
1
and r
2
, respectively. In this respect, a 40%
increase in the activity of the supply module (mod-
ule 1) results in less that 4% increase in flux and, in
practice, increasing the activity of the demand module
Fig. 2. Mean control coefficients versus S ⁄ S
o
in L. lactis. (A) Flux
mean control coefficients and their sum and (B) intermediate mean
control coefficients and their sum. The reference state is indicated
by d at S ⁄ S
o
¼ 1. The range of S ⁄ S
o
represented corresponds to
the experimental range reported in [16].
Fig. 3. Mean control coefficients versus module activity, r,in
L. lactis. (A) Flux mean control coefficients and (B) intermediate
mean control coefficients. Solid lines represent values in the experi-
mental range and dashed lines give values extrapolated outside this
range. The reference state is indicated by d at S ⁄ S
o
¼ 1.
L. Acerenza and F. Ortega Metabolic control analysis of large responses
FEBS Journal 274 (2007) 188–201 ª 2006 The Authors Journal compilation ª 2006 FEBS 195
(module 2) the flux decreases (there is a very small
increase in the flux when increasing the activity of
module 2 for r between 1 and 1.1, which is, for all
practical purposes, irrelevant). In contrast, decreasing
both rates, independently, produces significant and
similar decreases of the flux. In this region, flux and
rate are approximately proportional for both modules,
the decrease in rate of module 1 producing a slightly
bigger decrease of the flux. Note that, in this example,
there is no way to obtain significant increases in the
flux by changing the activity of a single module.
Regarding the intermediate, Fig. 4B shows that
decreasing the supply rate or increasing the demand
rate produces moderate decreases (less than 50%),
while increasing the supply rate or decreasing the
demand rate produces increases by a large factor (up
to more than seven times).
Let us now analyse the second experimental case,
concerning the control of oxidative phosphorylation in
isolated rat liver mitochondria [17]. Oxidative phos-
phorylation was divided into two modules linked
by the fraction of mitochondrial matrix ATP
[S ¼ ATP ⁄ (ADP + ATP)]. The demand module
(ATP-consuming module or module 2) is the adenine
nucleotide translocator (ANT) and the supply module
(ATP-producing module or module 1) is the rest of
mitochondrial oxidative phosphorylation, including
respiratory chain, ATP synthesis and the associated
transport processes. Membrane potential (Dw)isan
intermediate included inside module 1. In the following
analysis, we shall assume that the direct effect of this
intermediate on module 2 can be neglected, existing
only an indirect effect through S. Experimental evi-
dence for this assumption was reported by Ciapaite
et al. [24]. Under these conditions, the analysis remains
valid even if large changes in Dw take place when the
system is modulated with effectors. One of these effec-
tors is palmitoyl-CoA, an inhibitor of module 2 (ANT)
that has no direct effect on module 1. To apply the
top-down control analysis developed in the present
work to this case, we fitted the experimental points
reported in Fig. 5 of [17] to continuous functions.
Fig. 4. Fluxes (A) and intermediate concentrations (B) produced by
independent modulations in the activity of the supply or demand in
L. lactis. Solid lines represent values in the experimental range and
dashed lines give values extrapolated outside this range. The refer-
ence state is indicated by d at S ⁄ S
o
¼ 1.
Fig. 5. Mean control coefficients versus S ⁄ S
o
in isolated rat liver
mitochondria. (A) Flux mean control coefficients and their sum and
(B) intermediate mean control coefficients and their sum. The refer-
ence state is indicated by d at S ⁄ S
o
¼ 1. The range of S ⁄ S
o
repre-
sented corresponds to the experimental range reported in [17].
Metabolic control analysis of large responses L. Acerenza and F. Ortega
196 FEBS Journal 274 (2007) 188–201 ª 2006 The Authors Journal compilation ª 2006 FEBS
The rates of module 1 and 2 are given by:
v
1
(S) ¼ 14.04 ⁄ (0.03625 + S
10.19
) and v
2
(S) ¼ 1259S ⁄
(1.136 + S) (Scheme 1). When 5 lmolÆL
)1
of palmi-
toyl-CoA (I ¼ 5) was added, the rate v
1
was described
by the same function [v
1
(S, I ¼ 5) ¼ v
1
(S)] and the rate
v
2
changed, being described by: v
2
(S, I ¼ 5) ¼
378.3S ⁄ (0.4796 + S). The reference states, without and
with 5 lmolÆL
)1
of palmitoyl-CoA, were S
o
¼ 0.49 and
S
o
I
¼ 0:70, respectively. The mean e-elasticity coeffi-
cients,
e
v1
S
and e
v2
S
, are calculated replacing the fitting
curves, v
1
(S) and v
2
(S), into Eqn (17). For the entire
range of S studied,
e
v2
S
is positive and e
v1
S
is negative as
would normally be expected. Introducing
e
v1
S
, e
v2
S
and
r
s
¼ S ⁄ S
o
into Eqn (10) and (13) C
S
v1
, C
S
v2
, C
J
v1
, C
J
v2
, r
1
and r
2
are obtained. Note that, v
1
and v
2
were meas-
ured for different ranges of values of S (see Fig. 5 of
[17]). As a consequence, all values of mean-control
coefficients calculated by this analysis involve values of
mean-elasticity coefficients extrapolated outside the
experimental range. Accordingly, in the figures that we
will present next, no distinction between experimental
and extrapolated range will be made (in contrast to
Figs 2–4). In Fig. 5, we plot
C
S
v1
, C
S
v2
, C
J
v1
, C
J
v2
,
C
S
v1
þ C
S
v2
and C
J
v1
þ C
J
v2
as a function of S ⁄ S
o
.
C
J
v1
þ C
J
v2
is always one (Eqn 11) and, in this case,
0 <
C
J
v1
< 1 and 0 < C
J
v2
< 1 because e
v1
S
and e
v2
S
show
normal signs (Fig. 5A).
C
S
v1
> 0 and C
S
v2
< 0 in all the
range of S ⁄ S
o
values (Fig. 5B). For S ⁄ S
o
<1,
C
S
v1
> C
S
v2
and
C
S
v1
þ C
S
v2
> 0 (total concentration con-
trol dominated by supply), while for S ⁄ S
o
>1,
C
S
v1
< C
S
v2
and
C
S
v1
þ C
S
v2
< 0 (total concentration con-
trol dominated by demand).
C
S
v1
þ C
S
v2
¼ 0 at the refer-
ence state only (Eqn 12).
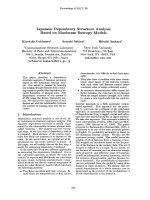
Finally, we have quantified the effect of palmytoil-
CoA (I, specific inhibitor of module 2) on the interme-
diate, S, and the flux, J, using the corresponding mean
response coefficients,
R
S
I
and R
J
I
. Here, definitions
involving absolute changes in I are used because the
initial value of I is zero [
R
S
I
¼ðS
f
=S
o
À 1Þ=ðI
f
À I
o
Þ and
R
J
I
¼ðJ
f
=J
o
À 1Þ=ðI
f
À I
o
Þ]. These coefficients are calcu-
lated using the response theorems for large changes
(Eqn 5), i.e.,
R
S
I
¼ C
S
v2
p
v2
I
and R
J
I
¼ C
J
v2
p
v2
I
, where p
v2
I
is the mean p-elasticity coefficient, defined in terms of
absolute changes in I ½
p
v2
I
¼ðv
ff
2
=v
fo
2
À 1Þ=ðI
f
À I
o
Þ¼
v
2
ðS; I ¼ 5Þ=v
2
ðSÞÀ1=ð5 À 0Þ. In Fig. 6, we represent
R
S
I
, R
J
I
and p
v2
I
as a function of S=S
o
I
. In the range of
values analysed, p
v2
I
varies between, approximately,
)0.07 and )0.1. Therefore, its effect, in the response
theorem is, roughly speaking, to lower by a tenth the
absolute value of the mean control coefficients,
C
S
v2
and C
J
v2
, and to change their sign (compare Figs 5 and
6). Another interesting representation would be to plot
R
S
I
, R
J
I
and p
v2
I
as a function of the concentration of
inhibitor I. This was not possible for this example
because the data available was determined at one
inhibitor concentration only.
Discussion
In MCA, elasticity analysis is the procedure that
allows calculation of the control coefficients in terms
of elasticity coefficients. In this contribution, we
develop a completely general modular elasticity analy-
sis of large metabolic responses, for the case of two
modules and one intermediate, which also constitutes
an extension of the infinitesimal supply demand analy-
sis developed by Hofmeyr and Cornish-Bowden [18] to
large changes. The stages to achieving this goal were
the following: In the first elasticity analysis of large
metabolic responses that we previously developed [12],
the equations obtained were valid for variable elasticity
coefficients and could be applied to analyse model si-
mulations involving this type of coefficient. However,
they could not be applied to analyse top-down experi-
ments that result in variable elasticity coefficients,
because the relationship between the factor r and the
elasticity coefficients had not been deduced. In this
context, we applied the analysis to an experimental
case where the elasticity coefficients were reported to
be approximately constant [12]. In a recent contribu-
tion [15], the relationship between r and the elasticity
coefficients was established and applied to an experi-
mental case with variable elasticity coefficients. These
two preceding formalisms still relied, for the interpret-
ation of the results obtained, on the assumption that
all the reaction rates are proportional to the corres-
ponding enzyme concentrations. In addition, they
Fig. 6. Mean response coefficients versus S=S
o
I
in isolated rat liver
mitochondria. The mean p-elasticity coefficient of the demand block
with respect to the inhibitor (I, palmitoyl-CoA),
p
v2
I
, is also represen-
ted. The reference state (with 5 lmolÆ L
)1
of palmitoyl-CoA) is indi-
cated by d at S=S
o
I
¼ 1.
L. Acerenza and F. Ortega Metabolic control analysis of large responses
FEBS Journal 274 (2007) 188–201 ª 2006 The Authors Journal compilation ª 2006 FEBS 197
could not be applied to the analysis of the effect of
parameters that are related to the rates in a nonpro-
portional way, which is the case for most external
effectors. As a consequence, response theorems were
not obtained.
The modular elasticity analysis of large changes,
developed in the present contribution, can be applied
to modules of any structure, size and kinetic proper-
ties. The first part of the analysis determines the
control coefficients as a function of the elasticity coeffi-
cients, being valid irrespective of the parameter that
has produced the rate change. The parameter can act
in any reaction of the module and can affect the rate
of the reaction in any functional way. This approach is
inspired in the one proposed by Reder for infinitesimal
changes [19]. It is important to note that in this new
formalism, summation theorems (Eqns 11 and 12), are
structural properties, being completely independent of
the kinetic properties of the reactions involved. The
second part of the analysis determines the response
coefficients, from the control coefficients, the p-elasti-
city coefficients and the response theorems. Only in
this last part, the parameters appear explicitly in the
analysis.
There are two ways to perform the modulations of
the system in top-down experiments, in order to meas-
ure the effect that changes in the intermediate that
links the modules has on their rates. One is to add an
auxiliary branch, to perturb the intermediate, without
making changes inside the modules. The rates of both
modules are measured before and after this modula-
tion is carried out. This was the experimental proce-
dure used by Koebmann et al. [16] to obtain the data
on the control of glycolytic flux and biomass produc-
tion of L. lactis that we have analysed in first place.
The other way to perform the modulations is, first, to
perturb inside the supply module and measure the
changes in the intermediate and the demand rate and,
second, to perturb the demand module and measure
the changes in the intermediate and the supply rate.
This is the way that the experiments were designed by
Ciapaite et al. [17], to obtain the data related to the
control of oxidative phosphorylation in isolated rat
liver mitochondria that we analysed in the second
place.
As we described above, there are two ways to
modulate the intermediate: with an auxiliary branch-
ing reaction or perturbing the modules. If we use an
auxiliary branch that consumes the intermediate, S
decreases (S < S
o
) and the effect of this decrease on
the rates of the modules is measured. With this data
and the theory here developed, the mean control coef-
ficients as a function of S ⁄ S
o
can be calculated and
plotted (e.g., Fig. 2). The decrease in S corresponds
to a decrease in the activity of supply (module 1) or
an increase in the activity of demand (module 2).
Therefore, when the mean control coefficients are
plotted against r (the factor by which the activity of
the corresponding module is changed), the coefficients
with respect to v
1
(C
S
v1
and C
J
v1
) are in the range of
values r < 1, and the coefficients with respect to v
2
(C
S
v2
and C
J
v2
) in the range r > 1 (Fig. 3). This is
why, to cover the range of r for the four mean con-
trol coefficients we had to extrapolate outside the
experimental region (extrapolated behaviour represen-
ted by dashed line in Fig. 3). The way to have values
of the coefficients determined experimentally for all
the range of r values, would be to do an additional
experiment with an auxiliary branch that produces
the intermediate (S > S
o
). On the other hand, if we
want to cover experimentally all the range of r-values
with the alternative way of modulating the intermedi-
ate, i.e., perturbing the modules, we would have to
do four separate experiments, using one specific inhib-
itor and one specific activator of each module. When
the full set of experimental results required is
obtained, by either way of modulating the intermedi-
ate, the analysis constitutes an interpolation in the
experimental range, extrapolating outside this range
not been needed. In this case, the conclusions
obtained are entirely based on experimental evidence.
To our knowledge, there is no study published in the
literature where the experiments required for calcula-
ting the mean control coefficients in all the experi-
mental range of r factors has been reported.
The rates determined in top-down experiments cor-
respond to the kinetic behaviour of modules, usually
composed of several or many enzyme-catalysed reac-
tions coupled in intricate ways. Therefore, one would
expect to find functional dependencies of the rates with
the linking intermediate which are unusual for enzymes
studied in isolation. For instance, in the first experi-
mental case studied above, the rate v
1
exhibits the nor-
mal product inhibition behaviour close to the reference
state (i.e., for small changes in the intermediate). But,
for large changes in S, it shows a rather unusual prod-
uct activation behaviour, resulting in a positive prod-
uct mean e-elasticity coefficient.
The mean e-elasticity coefficients, calculated from
the rates determined in top-down experiments, can be
used to calculate the mean control coefficients
(Eqn 10). These coefficients quantify the control of
flux and intermediate exerted by each module. If we
want to change the flux in a large proportion, then it
would be better to act on the module with higher con-
trol of flux. In addition, according to the response
198 FEBS Journal 274 (2007) 188–201 ª 2006 The Authors Journal compilation ª 2006 FEBS
Metabolic control analysis of large responses L. Acerenza and F. Ortega
theorem (Eqn 5), the mean p-elasticity coefficient of
the effector used to act on the module would have to
show a reasonably high value.
The mean control coefficients were plotted as a
function of S ⁄ S
o
(Figs 2, 5 and 6) and r (Fig. 3).
These are two different ways to represent the extent
of the change. The case of infinitesimal changes cor-
responds to S ⁄ S
o
¼ 1 and r ¼ 1. The difference is
that S ⁄ S
o
is obtained directly from experimental
measurements of the concentrations of intermediate
and r, the change in the activity of the module
(Eqn 13), requires an elaborate calculation. The plots
as a function of S ⁄ S
o
can be used to study how con-
trol is distributed and how this distribution is modi-
fied with the extent of the change. On the other
hand, the plots as a function of r describe how the
control changes with respect to the variation in the
activity of the modules. In particular, this type of plot
allows visualization of the fact that the control of the
flux of a module normally drops when its activity is
increased (Fig. 3). Moreover, the values of the mean
control coefficients, represented in this way, may be
used to represent the changes in the variables,
Eqn (16), as a function of r, which was done in
Fig. 4. It is important to note that this general proce-
dure for calculating the change in the variable as a
function of r uses, in principle, data covering all the
experimental range of r-values. This is different from
what happens in infinitesimal control analysis, when
one predicts a noninfinitesimal flux change by linear
extrapolation, using the value of the infinitesimal con-
trol coefficient. The application of Eqn (16) is basic-
ally an interpolation in the experimental range and
not an extrapolation, and therefore is not subject to
the uncertainties of predictions obtained extrapolating
outside the experimental range. However, this is pos-
sible only if the full set of experiments (described
above) required by the theoretical framework is per-
formed.
The results obtained when applying the analysis
developed in this work to experimental data can be
used for different purposes. If the aim were to increase
the flux (e.g., in a biotechnological application), then
we would have to change the activity of the module
that has the greatest effect on the flux. The factor by
which the flux changes, from the initial (J
o
) to the final
(J
f
) value, is given by Eqn (16). In the example repre-
sented in Fig. 4A, we have seen that it is not possible
to obtain a substantial increase in the flux by changing
the activities of the modules. Note that, a 40%
increase in the activity of the supply module, results in
less than 4% increase in flux. This is a rather unex-
pected result from the point of view of the infinitesimal
treatment, taking into account that, at the reference
state, the supply module has 80% of the control
(C
J
v1
¼ 0:80). Using the infinitesimal flux control coeffi-
cient, one would predict more than 30% increase in
flux, obtaining less than 4%. This experimental case is
an example where using infinitesimal MCA, to esti-
mate the effect of increasing the activities of the mod-
ules on the flux, would lead to erroneous predictions.
In practice, when changing the activity of a single
module is not effective to obtaining significant increa-
ses in flux, simultaneously modulating both modules
would be required [25,26]. In addition, we saw that the
rate of both modules could be decreased in order to
decrease the flux, because J
f
@ rJ
o
for both modules, in
the region where r < 1. In the same example, let us
assume that our aim is to build a scenario on what cell
physiology would do to decrease the flux, keeping the
intermediate as constant as possible. The answer to
this problem would be to decrease the activity of sup-
ply module because the decrease in the activity of the
demand module produces similar decreases in flux, but
the intermediate is perturbed to a larger extent.
The analysis can be used to study model systems.
This could be useful to see if certain patterns of con-
trol not found in practice could be, in principle,
obtained. For instance, we have shown using model
examples that the curves representing mean flux con-
trol coefficients as a function of r may cross, in which
case the crossing points are at least two (results not
shown). This behaviour can be obtained with modules
built up with reactions whose rates are governed by
usual rate equations. In addition, we have used model
systems to test the validity of the novel relationships
derived here.
The control analysis for large changes presented in
this work is, in our view, a completely general analysis
for the case of two modules and one linking intermedi-
ate. Its limitations in the application to intact systems
are similar to those of infinitesimal treatments
[10,27,28]. One important limitation is that the mod-
ules defined do not interact significantly through inter-
mediates different to the linking one. This may be
checked by changing different sets of parameters that
produce independent changes in the intermediates
internal to the modules [29]. Calculation of elasticity
coefficients with these different independent parameter
changes must give similar values. Finally, the modular
analysis can be applied repeatedly to the same system
several times, dividing the system in two modules but
in different ways. For example, this iterative procedure
would be useful to determine in what portion of one
module, that has been shown to have the highest
control for a variable in the previous division, such
FEBS Journal 274 (2007) 188–201 ª 2006 The Authors Journal compilation ª 2006 FEBS 199
L. Acerenza and F. Ortega Metabolic control analysis of large responses
control resides. The extension of this approach to sys-
tems divided in more than two modules will be the
subject matter of a forthcoming publication.
Acknowledgements
We are grateful to B. J. Koebmann for supplying us
with experimental data on his work. LA acknowledges
funding from Comisio
´
n Sectorial de Investigacio
´
n
Cientı
´
fica dela Universidad de la Repu´ blica (Montevideo)
and Programa de Desarrollo de las Ciencias Ba
´
sicas
(Montevideo).
References
1 Kacser H & Burns JA (1973) The control of flux. Symp
Soc Exp Biol 27, 65–104.
2 Heinrich R & Rapoport TA (1974) A linear steady-
state treatment of enzymatic chains: general properties,
control and effector strength. Eur J Biochem 42, 89–
95.
3 Heinrich R & Schuster S (1996) The Regulation of Cellu-
lar Systems, 1st edn. Chapman & Hall, New York, NY.
4 Cascante M, Boros LG, Comı
´
n-Anduix B, de Atauri P,
Centelles JJ & Lee W-NP (2002) Metabolic control ana-
lysis in drug discovery and disease. Nat Biotechnol 20,
243–249.
5 Acerenza L (2003) Metabolic responses: large and small.
Comm Theor Biol 8, 279–322.
6 Bailey JE (1999) Lessons from metabolic engineering for
functional genomics and drug discovery. Nat Biotechnol
17, 616–618.
7 Bailey JE (2000) Life is complicated. In Technological
and Medical Implications of Metabolic Control Analysis
(Cornish-Bowden A & Ca
´
rdenas M-L, eds), pp. 41–47,
Kluwer Academic Publishers, Dordrecht.
8 Brown GC, Hafner RP & Brand MD (1990) A ‘top-
down’ approach to the determination of control coeffi-
cients in metabolic control theory. Eur J Biochem 188,
321–325.
9 Schuster S, Kahn D & Westerhoff HV (1993) Modular
analysis of the control of complex metabolic pathways.
Biophys Chem 48, 1–17.
10 Brand MD (1996) Top down metabolic control analysis.
J Theor Biol 182, 351–360.
11 Kacser H, Sauro HM & Acerenza L (1990) Enzyme–
enzyme interactions and control analysis. The case of
non-additivity: monomer–oligomer associations. Eur
J Biochem 187, 481–491.
12 Ortega F & Acerenza L (2002) Elasticity analysis and
design for large metabolic responses produced by
changes in enzyme activities. Biochem J 367, 41–48.
13 Minton AP (2001) The influence of macromolecular
crowding and macromolecular confinement on
biochemical reactions in physiological media. J Biol
Chem 276, 10577–10580.
14 Acerenza L (2000) Design of large metabolic responses.
Constraints and sensitivity analysis. J Theor Biol 207,
265–282.
15 Acerenza L & Ortega F (2006) Metabolic control analy-
sis for large changes: extension to variable elasticity
coefficients. IEE Proc Syst Biol 153, 323–326.
16 Koebmann BJ, Solem C, Pedersen MB, Nilsson D &
Jensen PR (2002) Expression of genes encoding F(1)-
ATPase results in uncoupling of glycolysis from biomass
production in Lactococcus lactis. Appl Environ Microbiol
68, 4274–4282.
17 Ciapaite J, van Eikenhorst G, Bakker SJ, Diamant M,
Heine RJ, Wagner MJ, Westerhoff HV & Krab K
(2005) Modular kinetic analysis of the adenine nucleo-
tide translocator-mediated effects of palmitoyl-CoA on
the oxidative phosphorylation in isolated rat liver mito-
chondria. Diabetes 54, 944–951.
18 Hofmeyr JS & Cornish-Bowden A (2000) Regulating
the cellular economy of supply and demand. FEBS Lett
476, 47–51.
19 Reder C (1988) Metabolic control theory: a structural
approach. J Theor Biol 135, 175–201.
20 Heinrich R, Rapoport SM & Rapoport TA (1977)
Metabolic regulation and mathematical models. Prog
Biophys Mol Biol 32, 1–82.
21 Acerenza L (1993) Metabolic control design. J Theor
Biol 165, 63–85.
22 Westerhoff HV, Hofmeyr J-HS & Kholodenko BN
(1994) Getting to the inside of cells using metabolic con-
trol analysis. Biophys Chem 50, 273–283.
23 Hofmeyr J-HS, Cornish-Bowden A & Rohwer JM
(1993) Taking enzyme kinetics out of control; put-
ting control into regulation. Eur J Biochem 212, 833–
837.
24 Ciapaite J, van Eikenhorst G & Krab K (2002) Applica-
tion of modular control analysis to inhibition of the
adenine nucleotide translocator by palmitoyl-CoA. Mol
Biol Rep 29, 13–16.
25 Kacser H & Acerenza L (1993) A universal method for
achieving increases in metabolite production. Eur J Bio-
chem 216, 361–367.
26 Acerenza L (2000) On the universality of the universal
method. In Technological and Medical Implications of
Metabolic Control Analysis (Cornish-Bowden A & Ca
´
r-
denas M-L, eds), pp. 33–37, Kluwer Academic Publish-
ers, Dordrecht.
27 Schuster S (1999) Use and limitations of modular meta-
bolic control analysis in medicine and biotechnology.
Metab Eng 1, 232–242.
28 Quant PA (1993) Experimental application of top-down
control analysis to metabolic systems. Trends Biochem
Sci 18, 26–30.
200 FEBS Journal 274 (2007) 188–201 ª 2006 The Authors Journal compilation ª 2006 FEBS
Metabolic control analysis of large responses L. Acerenza and F. Ortega
29 Acerenza L & Cornish-Bowden A (1997) Generalization
of the double modulation method for in situ determina-
tion of elasticities. Biochem J 327, 217–223.
Appendix
Proof of Eqn (7)
Three steady-states of the system were considered, o,
x
sp
and y
sp
, for which the corresponding following
equations are satisfied:
v
oo
1
¼ v
oo
2
¼ J
o
ðA1Þ
v
xx
1
¼ v
xo
2
¼ J
x
ðA2Þ
v
yo
1
¼ v
yy
2
¼ J
y
ðA3Þ
where the notation v
ab
i
¼ v
i
ðS
a
; p
b
i
Þ was used (Table 1).
p
x
1
and p
y
2
are such that Eqn (6) is fulfilled, i.e.,
v
xx
1
¼ r
1
v
xo
1
ðA4Þ
v
yy
2
¼ð1=r
1
Þv
yo
2
ðA5Þ
Eliminating v
xx
1
from (Eqn A2) and (Eqn A4), and
eliminating v
yy
2
from (Eqn A3) and (Eqn A5) we
obtain:
v
xo
2
¼ r
1
v
xo
1
ðA6Þ
v
yo
2
¼ r
1
v
yo
1
ðA7Þ
Because these are two identical equations, fulfilled
by S
x
and S
y
, and we assume that there is a unique
stable steady-state in the region of parameter values
considered, then:
S
x
¼ S
y
ðA8Þ
Finally, using successively Eqns (A2), (A4), (A8),
(A7), (A5) and (A3) we obtain
J
x
¼ v
xx
1
¼ r
1
v
xo
1
¼ r
1
v
yo
1
¼ v
yo
2
¼ r
1
v
yy
2
¼ r
1
J
y
i.e.; J
x
¼ r
1
J
y
ðA9Þ
FEBS Journal 274 (2007) 188–201 ª 2006 The Authors Journal compilation ª 2006 FEBS 201
L. Acerenza and F. Ortega Metabolic control analysis of large responses