THE PERFORMANCE OF SOCIALLY RESPONSIBLE INVESTMENT FUNDS: A META ANALYSIS doc
Bạn đang xem bản rút gọn của tài liệu. Xem và tải ngay bản đầy đủ của tài liệu tại đây (712.65 KB, 31 trang )
THE PERFORMANCE OF SOCIALLY
RESPONSIBLE INVESTMENT FUNDS: A META-
ANALYSIS
SEBASTIAN RATHNER
WORKING PAPER NO. 2012-03
The Performance of SRI Funds: A Meta-Analysis
1
The Performance of Socially Responsible
Investment Funds: A Meta-Analysis
Sebastian Rathner*
March 2012
Abstract
Empirical studies, which analyse the performance of Socially Responsible Investment
(SRI) funds relative to conventional funds, find contradictory results. The aim of this paper
is to investigate, with the help of a meta-analysis, how selected primary study
characteristics influence the probability of a significant under- or outperformance of SRI
funds compared with conventional funds. 25 studies with more than 500 observations are
included in the meta-analysis. The results of this paper suggest that the consideration of the
survivorship bias in a study increases (decreases) the probability of a significant
outperformance (underperformance) of SRI funds relative to conventional funds. The focus
on United States (US) SRI funds increases (decreases) the probability of a significant
outperformance (underperformance) too. The time period influences the probability of a
significant under- and outperformance of SRI funds as well, but based on the results of this
paper, it is not possible to draw general conclusions on this variable.
Keywords: Corporate Social Responsibility (CSR), Ethical Investment, Fund
performance, Socially Responsible Investment (SRI), Sustainability
JEL Codes: G12, M14
___________________________
* Department of Economics and Social Sciences, University of Salzburg, Residenzplatz 9,
A-5010 Salzburg, Austria. E-mail:
The Performance of SRI Funds: A Meta-Analysis
2
1 Introduction
Socially Responsible Investment (SRI) is an investment process that combines an
investor’s financial objectives with environmental, social or ethical considerations
(Renneboog et al., 2008a; European Sustainable Investment Forum (Eurosif), 2010).
Thus, SRI stock funds, for example, use financial screens as well as environmental, social
or ethical screens to select their stocks.
Over the last years SRI has seen strong growth. The total SRI assets under
management in Europe, for instance, increased from €2.7 trillion in 2007 to €5 trillion in
2009 which is an increase of 87% (Eurosif, 2010). Eurosif divides the SRI market into
two segments, a stricter ‘core’ SRI segment (investments have to apply sophisticated SRI
techniques), and a ‘broad’ SRI segment with less strict requirements.
1
The ‘core’ segment
(€1.2 trillion) is estimated to represent 10% of the asset management industry in Europe
in 2009 (Eurosif, 2010). Additionally the number of European SRI retail funds increased
from 280 in 2001 to 886 in 2011, which is an increase of 216% (Vigeo, 2011).
Furthermore, Eurosif (2010) reports the compound annual growth rates of SRI and
conventional funds by asset class between 2007 and 2009. Bond and monetary SRI funds
grew strongly (114% and 33%), while conventional bond and monetary funds
experienced small growth, respectively, a decrease (4% and -5%). Assets in SRI equity
funds decreased by 7% and assets in conventional equity funds by 14%.
One widely studied question in SRI literature is, whether the performance of SRIs
differs from the one of conventional investments. This question is addressed in most
academic studies by investigating SRI funds and conventional funds. From a theoretical
perspective, there are three different hypotheses about performance comparisons of SRI
and conventional funds. The ‘underperformance-hypothesis’ suggests that SRI funds
generate weaker financial performance than conventional funds. The main reason for the
underperformance can be seen in the fact that the implementation of SRI screens limits
the full diversification potential which ‘may shift the mean-variance frontier towards less
The Performance of SRI Funds: A Meta-Analysis
3
favorable risk-return tradeoffs than those of conventional portfolios’ (Renneboog et al.,
2008b, p. 304). An additional reason for the underperformance of SRI funds may be
found in the costs of the labour intensive screening process which could partly be passed
on to investors (Gil-Bazo et al., 2010).
The ‘outperformance-hypothesis’ claims superior returns of SRI funds. An
outperformance of SRI funds may occur if the SRI screening process, which investigates
a company’s environmental, social or ethical quality (in empirical studies called
Corporate Social Performance (CSP)), generates value-relevant information which would
not be available to fund managers otherwise. This ‘additional’ information may help fund
managers to select securities, respectively companies with higher risk-adjusted returns
(Renneboog et al., 2008b). Thus, the most pressing question is if there are any reasons
why a ‘good’ company may be a successful company as well?
2
Heal (2008) mentions amongst others the following reasons: Companies with a good
record concerning CSP may have a lower risk of being the target of negative press, NGO
actions, consumer boycotts and lawsuits. Another benefit is seen in environmentally
responsible actions that may cause cost reductions by reducing waste. In today’s
competitive world with few possibilities for product differentiation, a product’s image is
crucial. Good CSP may be a source differentiation and bad CSP may harm a company’s
brand. A ‘good’ company may attract a highly educated workforce and may be more
successful in motivating the employees than a company with a bad CSP record.
Furthermore, SRI may reduce the cost of capital of responsible companies if this type of
investment reaches a substantial market share. An important assumption of the
‘outperformance-hypothesis’ is that the stock market misprices the information on a
company’s Corporate Social Performance (Renneboog et al., 2008b).
The ‘no-effect-hypothesis’ suggests that there is no significant difference between the
returns of SRI and conventional funds. This hypothesis proposes that the SRI screening
The Performance of SRI Funds: A Meta-Analysis
4
process, respectively the CSP of companies, has neither a positive nor a negative
influence on the financial performance (Hamilton et al., 1993; Renneboog et al., 2008b).
Most empirical studies of this extensive body of literature corroborate the ‘no-effect-
hypothesis’ but there is some evidence for the other two hypotheses as well. The reasons
for the contradictory evidence are largely unexplored. One possibility is that primary
study characteristics (e.g. domicile of the studied funds) influence the results.
Therefore, the aim of this paper is to investigate, with the help of a meta-regression,
how selected primary study characteristics (the domicile of the investigated funds, the
survivorship bias consideration in a study, the sample period) influence the probability of
a significant under- or outperformance of SRI funds compared with conventional funds.
The remainder of this paper is organised as follows: Section 2 presents the study
selection process of the meta-analysis and a literature overview of the selected studies,
which compare the performance of SRI and conventional funds. Section 3 develops the
hypotheses and section 4 describes the data and methods. Section 5 presents the empirical
results. Section 6 provides a conclusion and various suggestions for future research.
2 Study selection process and literature overview
The starting points for this research were several narrative literature reviews (Chegut
et al., 2011; Capelle-Blancard and Monjon, 2010; Hoepner and McMillan, 2009;
Renneboog et al., 2008a). Additionally, a computer search in ‘ScienceDirect’ and ‘google
scholar’, using the keywords ‘socially responsible investment’ and ‘performance’ was
conducted and the references of included studies were explored. For being included in the
meta-analysis, a study had to meet the following criteria: First, the study investigated the
performance of ‘real’ SRI funds relative to conventional funds quantitatively. A study
which focused on SRI funds only or SRI indices was not included. Second, a study
needed to provide information on the significance of the observed effects.
A limitation of this study is that it is not possible to guarantee that all relevant studies
were found during the searching process, as there is an enormous amount of journals and
The Performance of SRI Funds: A Meta-Analysis
5
other web-sources where studies may be published. Nonetheless, from my point of view,
the selected studies are representative for this body of literature.
To reduce the publication bias, which suggests that journals tend to publish studies
with significant results rather than publishing studies with insignificant results, I included
unpublished papers of this research stream in the meta-analysis as well (two master theses
and two working papers).
3
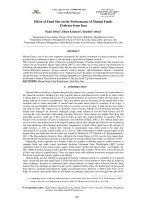
25 studies with 517 effects (= comparisons between SRI and conventional fund
performance in primary studies) are included in the meta-analysis. Single studies contain
several performance comparisons between SRI and conventional funds; e.g. for funds of
different countries. Basic information on the included studies and their results can be
found in Table I. Detailed information on the included studies can be found in Appendix
I.
TABLE I
Information on the included studies
Authors
Publica-
tion year
Significant
under-
performance
of SRI funds
No significant
performance
difference
Significant
out-
performance
of SRI funds
Total
Bauer, Derwall, Otten 2007 0 6 0 6
Bauer, Koedijk, Otten 2005 4 22 4 30
Bauer, Otten, Rad 2006 1 8 2 11
Bello 2005 0 6 1 7
Benson, Brailsford, Humphrey 2006 6 36 0 42
Bollen 2007 2 8 5 15
Chang, Witte 2010 10 20 4 34
Derwall, Koedijk 2009 0 23 9 32
Gil-Bazo, Ruiz-Verdu, Santos 2010 6 52 39 97
Goldreyer, Ahmed, Diltz 1999 3 9 0 12
Gregory, Matatko, Luther 1997 1 5 0 6
Gregory, Whitaker 2007 0 4 2 6
Hamilton, Jo, Statman 1993 0 2 0 2
Humphrey, Lee 2011 0 8 0 8
Kempf, Osthoff 2008 0 2 0 2
Koellner, Suh, Weber, Moser, Scholz 2007 0 5 1 6
Kreander, Gray, Power, Sinclair 2005 0 7 0 7
Kryzanowski, Ayadi, Ben-Ameur 2011 0 36 0 36
Liedekerke, Moor, Walleghem 2007 0 5 1 6
Mueller 1991 3 0 0 3
Renneboog, Horst, Zhang 2008 25 107 0 132
Sanchez, Sotorrio 2009 6 2 0 8
Spekl 2009 5 1 0 6
Statman 2000 0 2 0 2
Stenström, Thorell 2007 1 0 0 1
Total 73 376 68 517
The Performance of SRI Funds: A Meta-Analysis
6
As shown in Table I, the results of empirical studies that compare SRI and
conventional fund performance are contradictory. Both, a significant out- or
underperformance of SRI funds as well as no significant performance difference at all can
be observed by investigating, for example, the following studies. Bauer et al. (2006)
discuss possible performance differences between Australian SRI and conventional funds
during 1992-2003. They divide their sample into funds which invest in international and
domestic stock markets and do not find any significant performance difference between
SRI and conventional funds using a conditional multi-factor model. However, they show
that the results are sensitive to the chosen time period. Domestic SRI funds
underperformed their conventional peers in the first 3.5 years of the study’s time period,
outperformed conventional funds in the second 3.5 years and didn’t show any significant
performance difference in the last 3.5 years. An important contribution of Bauer et al.
(2006) is that they consider the survivorship bias in their study by adding back funds to
their samples, which were closed at any point during the sample period. Several authors
show that the consideration of survivorship bias influences the average fund performance
(e.g. Brown et al., 1992). Therefore, it should be an independent variable in the meta-
analysis. Humphrey and Lee (2011) do not find any significant performance difference
between Australian SRI and conventional fund portfolios. Their study uses the one-
factor-model based on Jensen (1968) as well as Carhart’s (1997) four-factor-model to
evaluate fund performance. As Humphrey and Lee (2011) many studies use several
models to evaluate fund performance and models vary from study to study as well.
Hence, it is reasonable to include the performance evaluation models as control variables
in the meta-analysis. Benson et al. (2006) compare the annual raw returns and sharp ratios
of US funds. They do not report any significant performance difference between SRI and
conventional funds during 1994-2003, except in 2003, in which conventional funds
showed a significant better performance than SRI funds.
The Performance of SRI Funds: A Meta-Analysis
7
In a comprehensive study Renneboog et al. (2008b) investigate the performance of
SRI funds relative to conventional funds in 17 countries around the globe using one- and
multi-factor models to evaluate fund performance. This study eliminates the problem of
small SRI fund samples as 440 SRI funds were included. The number of funds varies
strongly throughout the studies and therefore, a control variable which accounts for this
fact will be included in the meta-analysis. Renneboog et al. (2008b) do not find any
significant performance difference for funds of thirteen countries but report that SRI
funds of France, Ireland, Sweden and Japan significantly underperformed their
conventional peers by 4%-7% per annum during 1991-2003.
4
This suggests that the
conclusion about the performance of SRI funds relative to conventional funds may be
sensitive to the domicile of the investigated funds. Chang and Witte (2010) compare the
average annual returns of US SRI and conventional funds over a three-, five-, ten-, and
fifteen-year period ending on March 31, 2008. They report a significant
underperformance of SRI funds over the five-, ten-, and fifteen-year period but the results
over the three-year period are not significant. Again, the time period seems to influence
the observed results. Thus, it is reasonable to include a variable ‘time period’ in the meta-
analysis. Bauer et al. (2005) find a significant underperformance of German and US SRI
funds during 1990-1993 relative to conventional funds as well as a significant
outperformance of SRI fund portfolios from the UK and the US during the subperiod
1998-2001.
Applying a conditional 4-factor-model, Liedekerke et al. (2007) examine Belgian SRI
and conventional funds. Generally, they do not find any significant performance
difference but they report a significant outperformance of SRI funds which invested in the
international market during 2001-2005. Gil-Bazo et al. (2010) investigate US SRI and
conventional funds during 1997-2005 using a wide variety of models. They apply a
matching estimator methodology to compare funds with similar characteristics. Several
other studies use a matching procedure too (e.g. Kreander et.al., 2005; Statman, 2000).
The Performance of SRI Funds: A Meta-Analysis
8
The aim of such a procedure is to select comparable funds whose main difference is the
SRI characteristic. The use of this procedure possibly leads to a different conclusion
about the performance comparison between SRI and conventional funds. As a result, a
control variable which accounts for the use of a matching procedure in a study should be
integrated in the meta-analysis. Gil-Bazo et al. (2010) conclude that the SRI funds of their
sample outperform the matched conventional funds but these results are driven by SRI
funds which are operated by fund management companies with a specialization in SRI.
3 Hypotheses
This section presents the hypotheses on three selected primary study characteristics,
which play a major role in studies on SRI fund performance and may have an impact on
the probability of a significant under- or outperformance of SRI funds compared with
conventional funds. The following characteristics may contribute to an explanation of the
contradictory results of the cited primary studies: survivorship-bias consideration,
domicile of the investigated funds, sample period.
3.1 Survivorship bias consideration
An interesting characteristic, which distinguishes relevant studies, is whether a study
considers survivorship bias or if it does not. A survivorship bias appears if fund samples
(in a study) contain currently active funds only and do not include ‘dead’ funds. This bias
leads to an overestimation of the average fund performance because the average ‘dead’
fund performs poorly. Hence, a systematic difference in the attrition rate between SRI and
conventional funds would influence the performance comparisons in all studies which
ignore the survivorship bias. Interestingly, there is some empirical evidence which
suggests that the attrition rates of SRI and conventional funds are dissimilar and
therefore, fund samples suffer from survivorship bias to a different degree. Gregory and
Whittaker (2007) find that 29.93% of their conventional fund sample died before the end
of the sample period. In contrast, only 12.5% of the SRI fund sample did so. Similarly,
The Performance of SRI Funds: A Meta-Analysis
9
Kempf and Osthoff (2008) report an attrition rate of 36% for conventional and 17% for
SRI funds. Accordingly, Renneboog et al. (2008b) discover a lower attrition rate for SRI
than for conventional funds.
If a study does not consider survivorship bias and the attrition rate of conventional
funds is higher than the attrition rate of SRI funds (and therefore, the average
performance of conventional funds is biased more upwards than the average performance
of SRI funds), there should be a higher (lower) probability of a significant
underperformance (outperformance) of SRI funds. In contrast, a study which accounts for
survivorship bias (includes dead funds in the samples) should on average have a higher
(lower) probability of a significant outperformance (underperformance) of SRI funds
(hypothesis 1 (H1)).
3.2 Domicile of the investigated funds
One criterion, which distinguishes funds from each other, is their domicile. Most
studies focus on the SRI fund industry of the US which is claimed to be the oldest and
most developed SRI fund industry in the world. Louche and Lydenberg (2006) report that
the ‘Pioneer Fund’, established in 1928 in the US, was the first SRI fund. Several other
authors claim that the ‘PAX World Fund’, established in 1971 in the US, was the first
‘modern’ SRI fund (e.g. Renneboog et al., 2008a). Due to the age and development of the
SRI fund industry, I hypothesise that studies which investigate US SRI funds only tend to
have, on average, a higher (lower) probability of a significant outperformance
(underperformance) of SRI funds compared with studies which focus on funds of other
countries (H2).
3.3 Sample period
Another widely studied characteristic is the sample period. Several authors divide their
period into subperiods to investigate the influence of study subperiods on the results (e.g.
Bauer et al., 2006; Renneboog et al., 2008b; Gil-Bazo et al., 2010). The findings of these
studies ‘suggest that different sample periods may lead to different conclusions about the
The Performance of SRI Funds: A Meta-Analysis
10
performance of SRI funds relative to that of conventional funds’ (Gil-Bazo et al., 2010, p.
253). Several studies find a ‘catching up phase’ of SRI funds, which means that studies
with a newer sample period show better results for SRI funds (Bauer et al., 2005; Bauer et
al., 2006). The main reason may be seen in the steady advancement of the SRI fund
industry. In accordance with the mentioned studies, I hypothesise that studies with a(n)
newer (older) sample period have, on average, a higher (lower) probability of a
significant outperformance and a lower (higher) probability of a significant
underperformance of SRI funds (H3).
4 Data and methods
4.1 Variable description and empirical specification of the meta-analysis
Primary studies use different measures to compare the performance of SRI funds and
conventional funds and hence, it is difficult to compare them directly. Thus, I create the
categorical variable performance comparison (dependent variable of the meta-regression)
which takes value 0 if the SRI funds significantly underperform the conventional funds.
Value 1 is taken if there is no significant performance difference, and value 2 if the SRI
funds outperform their conventional peers significantly. By using logit-models, it will be
tested how the selected primary study characteristics (independent variables of the meta-
regression) influence the probability of a significant under- or outperformance of SRI
funds compared with conventional funds.
In the first approach, which uses binary logit-models, the dependent variable
(performance comparison) is dichotomised:
outperformance=1 if the SRI funds in a study significantly outperform conventional
funds; outperformance=0 in all other cases
underperformance=1 if the SRI funds in a study significantly underperform
conventional funds; underperformance=0 in all other cases
The independent variables are the three previously discussed primary study
characteristics and additional control variables as shown in Table II.
The Performance of SRI Funds: A Meta-Analysis
11
TABLE II
Independent Variables
Survivorship bias consideration = 1 if a study considers survivorship bias
US funds = 1 if a study investigates US SRI funds only
Time period 1981-1990 = 1 if the biggest part of a study’s sample period is between 1981-1990
Time period 1991-2000 = 1 if the biggest part of a study’s sample period is between 1991-2000
Time period 2001-2008 = 1 if the biggest part of a study’s sample period is between 2001-2008
Performance evaluation Jensen’s Alpha = 1 if a study uses a one-factor regression model to evaluate fund
performance (Jensen's Alpha)
Performance evaluation Carhart’s Alpha = 1 if a study uses a multi-factor regression model to evaluate fund
performance (e.g. Carhart's four factor Alpha)
Other performance evaluation = 1 if a study uses a fund performance evaluation model model, which
cannot be assigned to the other two groups
Conditional performance evaluation = 1 if a study uses a conditional regression approach to evaluate fund
performance (e.g. Ferson and Schadt, 1996)
Matching procedure = 1 if a study uses a matching procedure to match a certain number of
conventional funds to SRI funds (based on e.g. fund size and age)
Number of SRI funds = number of studied SRI funds
Number of conventional funds = number of studied conventional funds
In the second approach, a multinominal logit model is used to conduct a ‘robustness
check’. Thus, the dependent variable can be used as originally defined with three
outcomes (performance comparison). In this alternative model, the independent variables
remain unchanged.
4.2 Descriptive statistics
Table III shows the distribution of the dependent variable. Almost 73% of the effects
do not show any significant performance difference between SRI and conventional funds.
A significant under- and outperformance of SRI funds is found by approximately 14%
and 13% of the effects. The descriptive results of Table III must be treated with caution
and should not be interpreted as a ‘vote-counting’ approach which could often be
misleading. ‘Vote-counting’ approaches count the number of significant and insignificant
results in primary studies and pick the category with the largest number of ‘votes’ as
winner. The problem is that these approaches treat nonsignificant results of studies as
evidence that a ‘true’ effect is absent and ignore the possibility that the nonsignificant
results occur because of low statistical power (Borenstein et al., 2009).
The Performance of SRI Funds: A Meta-Analysis
12
TABLE III
Distribution of the primary studies’ results
Freq. Percent Cum.
Significant
underperformance of SRI
funds
73 14.12
14.12
No significant performance
difference
376 72.73
86.85
Significant outperformance
of SRI funds
68 13.15
100.00
Total 517 100.00
Table IV reports the number of effects which considers survivorship bias and the
number which ignores it.
5
76% of the effects consider survivorship bias while 24% do
not. This is consistent with Chegut et al. (2011) who find substantial differences between
studies concerning the treatment of survivorship bias too.
TABLE IV
Frequency of effects (according to the consideration of survivorship bias)
Freq. Percent
Survivorship bias
considered
381 75.90
Survivorship bias not
considered
121 24.10
Total 502 100.00
Table V shows how often individual countries/regions are investigated. US funds are
by far studied the most. This is consistent with, for example, Cortez et al. (2009) who
suggest that most studies were conducted in the US market. It is remarkable that four
Anglo-Saxon countries, namely, the US, Canada, the UK and Australia are considered
most in this research, although Europe has the largest share of the global SRI market
today (Eurosif, 2010).
The Performance of SRI Funds: A Meta-Analysis
13
TABLE V
Frequency of effects (according to the domicile of the funds)
Freq. Percent Cum.
Australia 27 5.22 5.22
Belgium 14 2.71 7.93
Canada 49 9.48 17.41
Europe 14 2.71 20.12
France 8 1.55 21.66
Germany 14 2.71 24.37
Germany/Austria/Switzerland 6 1.16 25.53
International 3 0.58 26.11
Ireland 8 1.55 27.66
Italy 7 1.35 29.01
Japan 8 1.55 30.56
Luxembourg 7 1.35 31.91
Malaysia 8 1.55 33.46
Netherlands 8 1.55 35.01
Norway 7 1.35 36.36
Singapore 7 1.35 37.72
Sweden 9 1.74 39.46
Switzerland 8 1.55 41.01
UK 33 6.38 47.39
UK/Sweden/Germany/Netherlands 4 0.77 48.16
US 268 51.84 100.00
Total 517 100.00
Table VI provides information on the sample periods of the effects of primary
studies.
6
I create three dummy variables which divide the sample period throughout all 25
primary studies, lasting from 1981-2008, into the following three subperiods (almost
decades) 1981-1990, 1991-2000 and 2001-2008.
7
A dummy variable takes value 1 if the
biggest part of the sample period of an effect is in this subperiod. The first period reflects
the beginning of the SRI movement. Eleven effects investigate funds in this period. The
small number seems reasonable because in this early period only some SRI funds existed.
All over the world the SRI fund industry started to expand in the early 1990s (Renneboog
et al., 2008a). Since the early 2000s the growth of the SRI industry has accelerated as
large institutional investors, in particular pension funds, increasingly entered the market.
The adoption of SRI techniques by large institutional investors is regarded as a kind of
‘mainstreaming’ of SRI as well as an important step in the maturity of SRI (Sparkes and
Cotwon, 2008; Bengtsson, 2008). As a result, most effects study SRI funds in the periods
1991-2000 and 2001-2008.
The Performance of SRI Funds: A Meta-Analysis
14
TABLE VI
Frequency of effects (according to the sample period)
Freq. Percent Cum.
1981-1990 11 2.29 2.29
1991-2000 287 59.79 62.08
2001-2008
182 37.92 100.00
Total 480 100.00
5 Results and discussion
Recall that in the first approach the dependent variable is dichotomised. The dummy
variables outperformance and underperformance represent a significant outperformance,
respectively underperformance, of SRI funds compared with conventional funds.
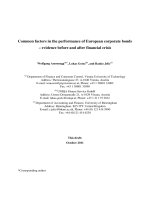
Table VII and VIII present the results of the logit models with underperformance and
outperformance as dependent variables and the independent variables as stated in Table
II. The coefficients represent average marginal effects.
8
The standard errors are clustered
by study, so I am adjusting for the fact that effects of the same study may be correlated.
9
In the following tables the first models do not include the variables on the number of
funds in the primary studies because their inclusion reduces the number of meta-
regression observations strongly. The second models include all independent variables.
TABLE VII
Results of the meta-regression with the dependent variable underperformance (logit model)
(1) (2)
Coef. Std. Err. Coef. Std. Err.
Performance evaluation Jensen’s Alpha -0.012 0.048 -0.016 0.027
Performance evaluation Carhart’s Alpha -0.022 0.046 -0.039 0.028
Conditional performance evaluation -0.053*** 0.017 -0.031*** 0.011
Matching procedure -0.050* 0.030 -0.095*** 0.024
Survivorship bias consideration -0.061* 0.032 -0.063*** 0.021
US funds -0.091** 0.038 -0.214*** 0.027
Time period 1981-2000 -0.042 0.042 -0.055*** 0.021
Number of SRI funds 0.001*** 0.000
Number of conventional funds 0.000* 0.000
Obs 477 376
Log pseudolikelihood -177.047 -107.482
Pseudo R2 0.049 0.2196
This table shows the average marginal effects of the independent variables in decimal notation and standard errors
(clustered by study). The dependent variable is underperformance, which takes the value 1 if the SRI funds in a study
significantly underperform the conventional funds, underperformance=0 in all other cases.
* Coefficient is statistically significant at the 10% level.
** Coefficient is statistically significant at the 5% level.
*** Coefficient is statistically significant at the 1% level.
Concerning the consideration of survivorship bias the results of Table VII are
consistent with H1. Model (1) and (2) find a (significant) lower probability of a
The Performance of SRI Funds: A Meta-Analysis
15
significant underperformance of SRI funds if a study accounts for survivorship bias. The
probability of a significant underperformance is on average approximately 6% (model (1)
and (2)) smaller if a study considers survivorship bias in comparison to not considering
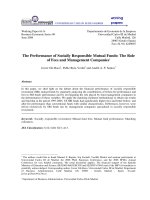
this bias (everything else being equal). Accordingly, Table VIII shows a (significant)
higher probability of a significant outperformance of SRI funds if a study accounts for
survivorship bias. Strictly explaining, based on these models, the consideration of
survivorship bias influences the probability of an out- or underperformance of SRI funds.
From the author’s perspective the most important implication of these findings is that all
future studies should give at least an explicit statement on how they deal with the
survivorship bias. The best option would be to eliminate survivorship bias by using
survivorship bias free data or by adding back closed funds to the sample. Moreover the
evidence of this paper may help interpreting the results of existing studies.
The results of Table VII and VIII support H2 as well. Effects, which investigate US
SRI funds only, have, on average, a 9%, respectively 21%, lower probability of a
significant underperformance and a 14%, respectively 25%, higher probability of an
outperformance of SRI funds compared with effects that focus on funds of other
countries. As approximately half of the primary study effects focuses on SRI funds of the
US and their results appear to be sample-specific, it seems to be necessary to investigate
SRI funds of single non-US countries in more detail. Additionally, an interesting topic for
future research may be the empirical investigation of possible differences between US
and non-US SRI funds.
10
Differences may exist as far as performance, screening type and
intensity, fund size, fund age etc. are concerned.
Regarding H3, mixed evidence is found. The variable time period 2001-2008 was
chosen to be the benchmark category.
11
As can be observed from Table VII, model (1)
does not show any significant difference in the average probability of an
underperformance between effects which have the biggest part of their sample period in
1981-2000 compared with effects that investigate the period 2001-2008. Model (2)
The Performance of SRI Funds: A Meta-Analysis
16
reports a lower probability of an underperformance if an effect belongs to an earlier
sample period. Table VIII shows significant differences as well. The average probability
of a significant outperformance of SRI funds is 7% lower for effects that have the biggest
part of their sample period in 1981-2000 compared with effects that have the biggest part
of their sample period in 2001-2008. The results of Table VIII are consistent with H3.
However, the results of Table VII are not. In order to support H3, Table VII should show
a significant higher probability of an underperformance of SRI funds for effects with an
older sample period.
TABLE VIII
Results of the meta-regression with the dependent variable outperformance (logit model)
(1) (2)
Coef. Std. Err. Coef. Std. Err.
Performance evaluation Jensen’s Alpha -0.036 0.060 -0.041 0.046
Performance evaluation Carhart’s Alpha -0.015 0.044 0.005 0.068
Conditional performance evaluation 0.076 0.105 0.154 0.121
Matching procedure 0.104 0.081 0.057 0.087
Survivorship bias consideration 0.170* 0.093 0.157** 0.068
US funds 0.139** 0.070 0.247* 0.128
Time period 1981-2000 -0.070*** 0.013 -0.071** 0.029
Number of SRI funds 0.001 0.001
Number of conventional funds -0.000 0.000
Obs 477 376
Log pseudolikelihood -152.698 -109.136
Pseudo R
2
0.211 0.310
This table shows the average marginal effects of the independent variables in decimal notation and standard errors
(clustered by study). The dependent variable is outperformance, which takes the value 1 if the SRI funds in a study
significantly outperform the conventional funds, outperformance=0 in all other cases.
* Coefficient is statistically significant at the 10% level.
** Coefficient is statistically significant at the 5% level.
*** Coefficient is statistically significant at the 1% level.
Additional interesting results concerning the variable matching procedure are found in
the binary logit models. If an effect uses a matching procedure to match a certain number
of conventional funds to the SRI fund sample (based on criteria such as fund age or fund
size), there is, on average, a 5%, respectively 10%, lower probability of an
underperformance of SRI funds (Table VII). Possibly, the underperformance of SRI funds
in studies, which do not use a matching procedure, is not caused primarily by the SRI
characteristics but by other fund characteristics (like fund size or fund age).
Another result is that there is, on average, a significant lower probability of an
underperformance of SRI funds if a conditional regression model is used to evaluate fund
The Performance of SRI Funds: A Meta-Analysis
17
performance. By using a conditional approach it can be assumed that the risk exposure of
funds may be systematically changed by fund managers according to macroeconomic
conditions. The most prominent approach in SRI fund literature is the conditional
performance evaluation model introduced by Ferson and Schadt (1996). It suggests the
inclusion of several lagged macroeconomic variables into single- or multi-factor
regression models.
The second approach, which can be seen as ‘robustness check’, uses the dependent
variable in its original form. Value 0 is taken if the SRI funds significantly underperform
the conventional funds. Value 1 is taken if there is no significant performance difference,
and value 2 if the SRI funds outperform their conventional peers significantly. Table IX
shows the results of the multinominal logit model for the outcomes ‘significant under-
and outperformance of SRI funds’ and ‘no significant performance difference’. Once
again, the first model does not include the variables on the number of funds in the
primary studies because their inclusion reduces the number of the meta-regression
observations strongly. The second model includes all independent variables. The results
regarding the survivorship bias consideration (H1) and domicile of the funds (H2) are in
accordance with the results of the logit models. Again, a lower probability of an
underperformance and a higher probability of an outperformance of SRI funds occur if a
study considers survivorship bias or focuses on US funds only. The magnitudes of all
coefficients are comparable to the ones found in the binary logit-models. There is mixed
evidence in the binary logit models concerning H3. The ‘robustness check’ does not
reveal any clear evidence in favour of H3. The probability of an underperformance of SRI
funds for effects with a sample period between 1981-2000 is statistically not different
from effects with a sample period between 2001-2008 in model (1). In model (2) the sign
of the coefficient is in accordance with the results of the binary logit model but not as
expected by H3 negative and significant. A lower probability of an outperformance of
The Performance of SRI Funds: A Meta-Analysis
18
SRI funds is found in both models for effects with an earlier sample period. These latter
results are in accordance with the evidence of the binary logit models and H3.
There are only some significant results concerning the third possible outcome of the
dependent variable ‘no performance difference’. Studies, which have the biggest part of
their sample period between 1981-2000 have, on average, a 12%, respectively 13%,
higher probability of the outcome ‘no performance difference’. This additional evidence
contributes to the overall picture that an older sample period leads to a higher probability
of insignificant results while a newer sample period leads to a higher probability of
significant results, either an out- or an underperformance of SRI funds. These results are
obviously not easy to interpret. One reason for the observed evidence may be that at the
beginning of the SRI movement SRI funds used less strict screens to select their stocks.
One may think of US SRI funds which decided to divest from companies that operated in
South Africa during the apartheid regime. Their investment universe may differ only to a
small degree from the one of conventional funds and therefore, these funds possibly
delivered similar returns.
The Performance of SRI Funds: A Meta-Analysis
19
TABLE IX
Results of the meta-regression with the dependent variable performance comparison (multinominal logit model)
(1) (2)
Coef. Std. Err. Coef. Std. Err.
Underperformance
Performance evaluation Jensen’s Alpha -0.006 0.049 -0.012 0.027
Performance evaluation Carhart’s Alpha -0.015 0.047 -0.036 0.028
Conditional performance evaluation -0.056*** 0.018 -0.038*** 0.012
Matching procedure -0.047 0.032 -0.092*** 0.024
Survivorship bias consideration -0.062** 0.029 -0.062*** 0.019
US funds -0.086** 0.039 -0.210*** 0.028
Time period 1981-2000 -0.045 0.040 -0.057*** 0.021
Number of SRI funds 0.001*** 0.000
Number of conventional funds 0.000* 0.000
No performance difference
Performance evaluation Jensen’s Alpha 0.043 0.075 0.058 0.048
Performance evaluation Carhart’s Alpha 0.031 0.075 0.032 0.071
Conditional performance evaluation -0.018 0.098 -0.105 0.117
Matching procedure -0.058 0.076 0.022 0.089
Survivorship bias consideration -0.103 0.100 -0.088 0.075
US funds -0.052 0.069 -0.028 0.110
Time period 1981-2000 0.116*** 0.045 0.128*** 0.042
Number of SRI funds -0.002** 0.001
Number of conventional funds 0.000 0.000
Outperformance
Performance evaluation Jensen’s Alpha -0.037 0.060 -0.046 0.045
Performance evaluation Carhart’s Alpha -0.016 0.044 0.004 0.069
Conditional performance evaluation 0.074 0.105 0.143 0.121
Matching procedure 0.105 0.081 0.070 0.087
Survivorship bias consideration 0.165* 0.092 0.150** 0.068
US funds 0.138** 0.070 0.238** 0.115
Time period 1981-2000 -0.071*** 0.013 -0.071** 0.030
Number of SRI funds 0.001 0.001
Number of conventional funds -0.000 0.000
Obs 477 376
Log pseudolikelihood -322.416 -213.948
Pseudo R2 0.127 0.258
This table shows the average marginal effects of the independent variables in decimal notation and standard errors
(clustered by study). The dependent variable is used in its original form (performance comparison) as described in the
text.
* Coefficient is statistically significant at the 10% level.
** Coefficient is statistically significant at the 5% level.
*** Coefficient is statistically significant at the 1% level.
6 Conclusion
The aim of this paper is to investigate, with the help of a meta-regression, the
influence of selected primary study characteristics on the observed results.
Almost 75% of the performance comparisons (SRI with conventional funds) do not
find any significant performance difference. A significant out- and underperformance is
virtually found to the same degree (13%-14%). Furthermore, the most studied time period
The Performance of SRI Funds: A Meta-Analysis
20
in primary studies is 1991-2000. Additionally, approximately 50% of the effects
investigate funds of the US.
Significant evidence is found that the consideration of survivorship bias increases
(decreases) the probability of a significant outperformance (underperformance) of SRI
funds. Therefore, on the one hand, it is necessary for future studies to report on the
treatment of the survivorship bias in detail. On the other hand, the evidence of this study
can be used to interpret the results of existing studies. Further evidence reveals that
effects, which investigate US SRI funds only, have a higher (lower) probability of an
outperformance (underperformance) compared with effects which focus on funds of other
countries. The most important implication of this evidence is that if the results of the US
studies are sample-specific, it is reasonable to investigate SRI funds of other countries in
more detail. Some studies started to investigate SRI funds around the globe (e.g.
Renneboog et al., 2008b) but further evidence is needed to cope with special
circumstances of national SRI markets. This could be particularly interesting for
European countries, as they have the largest share of the global SRI market (Eurosif,
2010). The results of primary studies are sensitive to the time period of an effect as well
but based on the results of the binary logit models it is difficult to draw general
conclusions on this variable. Additional evidence from the multinominal logit model on
the time period suggests that an older sample period leads to a higher probability of the
outcome ‘no performance difference’, while a newer sample period has a higher
probability of significant results, either an out- or an underperformance of SRI funds.
Regarding the meta-level, future research might explore the influence of additional
study characteristics. On the level of primary studies, it may be reasonable to investigate
differences between US and non-US SRI funds empirically. A further interesting topic
could be the dissimilar attrition rates of SRI and conventional funds.
The Performance of SRI Funds: A Meta-Analysis
21
Appendix
Appendix I
Detailed information on the included studies
Study Survivor
-ship
bias
consider-
ation
US
fu-
nds
Time
period
1981-
1990
Time
period
1991-
2000
Time
period
2001-
2008
Perfor-
mance
evaluation
Jensen’s
Alpha
Perfor-
mance
evaluation
Carhart’s
Alpha
Other
perfor-
mance
evalu-
ation
Conditional
perfor-
mance
evaluation
Matching
procedure
Number
of SRI
funds
Number
of
conven-
tional
funds
Bauer, Derwall, Otten (2007) 0 0 0 1 0 1 1 0 0/1 0 8 267
Bauer, Koedijk, Otten (2005) 1 0/1 0 1 0 1 1 0 0 1 50 150
Bauer, Otten, Rad (2006) 1 0 0 1 1 0 1 0 0/1 0 15 195
Bello (2005) 0 1 0 1 0 1 0 1 0 1 42 84
Benson, Brailsford, Humphrey (2006) 0 1 0 1 1 0 1 1 0 0 184 6074
Bollen (2007) 1 1 1 1 1 1 1 1 0 0 187 9189
Chang, Witte (2010) 0 1 0 0 1 1 0 1 0 0 164 11913
Derwall, Koedijk (2009) 1 1 0 1 0 1 1 1 0 1 15 75
Gil-Bazo, Ruiz-Verdu, Santos (2010) 1 1 0 1 1 1 1 1 0 0/1 86 1761
Goldreyer, Ahmed, Diltz (1999) 1 0 0 1 0 1 29 20
Gregory, Matatko, Luther (1997) 1 0 1 1 0 0 1 1 0 0/1 16 92
Gregory, Whitaker (2007) 1 0 0 1 0 0 1 0 0/1 1 20 100
Hamilton, Jo, Statman (1993) 0 1 1 0 0 1 0 0 0 1 17 170
Humphrey, Lee (2011) 1 0 0 0 1 1 1 0 0 0/1 27 514
Kempf, Osthoff (2008) 1 1 0 1 0 0 1 0 0 0 72 3906
Koellner, Suh, Weber, Moser, Scholz (2007) 0 0 0 0 1 0 0 1 0 1 13 13
Kreander, Gray, Power, Sinclair (2005) 0 0 0 1 0 1 1 1 0 1 30 30
Kryzanowski, Ayadi, Ben-Ameur (2011) 1 0 0 1 0 1 1 1 0/1 0 67 517
Liedekerke, Moor, Walleghem (2007) 1 0 0 1 1 0 1 0 1 0 28 725
Mueller (1991) 1 1 0 0 0 0 1 0 0 10
Renneboog, Horst, Zhang (2008) 1 0/1 0 1 1 1 1 1 0/1 0/1 340 680
Sanchez, Sotorrio (2009) 0 0 0 0 1 0 0 1 0 1 103 103
Spekl (2009) 0 0 0 0 1 1 1 1 0 1 133 133
Statman (2000) 0 1 0 1 0 1 0 1 0 1 31 62
Stenström, Thorell (2007) 0 0 0 0 1 1 0 0 0 0 23 42
This table presents dummy variables with detailed information on the independent variables of the meta-regression, respectively on the included studies. Value 1 is taken if the effects of a study, for
example, consider survivorship bias (second column). Value 0 is taken if the effects of a study do not consider survivorship bias. The last two columns show the numbers of investigated funds of the
effect of a study (recall that most studies contain several effects) with the highest number of investigated funds.
The Performance of SRI Funds: A Meta-Analysis
22
Notes
1
For more information on the definition of ‘broad’ and ‘core’ SRI, see Eurosif (2010), p. 9.
2
This topic is investigated empirically by a vast amount of studies. For example, the often
cited meta-analysis of Orlitzky et al. (2003) finds a positive relationship between CSP and
Corporate Financial Performance. Furthermore, a recent literature review was conducted by Van
Beurden and Goessling (2008).
3
The influence of the publication bias on this body of literature seems to be rather small,
because lots of studies with insignificant results were published. Table III reports that almost 75%
of the primary studies’ results are insignificant.
4
Renneboog et al. (2008b) do not find significant performance differences for the following
countries: Belgium, Germany, Italy, Luxembourg, Netherlands, Norway, Switzerland, UK, US,
Canada, Australia, Malaysia and Singapore.
5
Some studies do not provide information on the consideration of survivorship bias.
6
Unfortunately, not every study provides information on the sample period of all effects.
7
A similar procedure to divide the sample period is used, for example, by Bauer et al. (2005)
and Bauer et al. (2006) who divide their sample periods into three equal and non-overlapping
subperiods.
8
Average marginal effects are calculated by computing individual marginal effects at every
observation and by averaging these individual marginal effects across the sample.
9
For instance, some studies use several models to evaluate the performance of their fund
samples. The results of the models of one study may be correlated to a certain degree because all
models use the identical data set.
10
Louche and Lydenberg (2006) investigate this issue from a historic perspective.
11
For the empirical estimation, the dummy variables time period 1981-1990 and time period
1991-2000 are taken together because there are only eight observations in the first subperiod with
information on all variables of the logit models. All of these observations have the identical
outcome in the dependent variable and hence, time period 1981-1990 would predict the dependent
variable perfectly.
The Performance of SRI Funds: A Meta-Analysis
23
References
Bauer, R., K. Koedijk and R. Otten: 2005, ‘International Evidence on Ethical Mutual
Fund Performance and Investment Style’, Journal of Banking and Finance 29(7),
1751–1767.
Bauer, R., R. Otten and A. T. Rad: 2006, ‘Ethical Investing in Australia, is there a
Financial Penalty?’, Pacific-Basin Finance Journal 14(1), 33–48.
Bauer, R., J. Derwall and R. Otten: 2007, ‘The Ethical Mutual Fund Performance Debate:
New Evidence from Canada’, Journal of Business Ethics 70(2), 111–124.
Bello, Z. Y.: 2005, ‘Socially Responsible Investing and Portfolio Diversification’,
Journal of Financial Research 28(1), 41–57.
Benson, K. L., T. J. Brailsford and J. E. Humphrey: 2008, ‘Socially responsible
investment funds: Investor reaction to current and past returns’, Journal of Banking
and Finance 32(9), 1850–1859.
Bengtsson, E.: 2008, ‘A History of Scandinavian Socially Responsible Investing’,
Journal of Business Ethics 82(4), 969–983.
Bollen, N.: 2007, ‘Mutual Fund Attributes and Investor Behavior’, Journal of Financial
and Quantitative Analysis 42(3), 683–708.
Borenstein, M., L. V. Hedges, J. P. T. Higgins and H. R. Rothstein: 2009, Introduction to
Meta-analysis (Wiley, West Sussex).
Brown, S. J., W. Goetzmann, R. G. Ibbotson and S. A. Ross: 1992, ‘Survivorship bias in
performance studies’, The Review of Financial Studies 5(4), 553–580.
Review of Financial Studies 5, 553–580.
Capelle-Blancard, G. and S. Monjon: 2010, ‘The Performance of Socially Responsible
Funds: Does the Screening Process matter?’, Working paper, Université Paris 1
Panthéon-Sorbonne, Paris.
The Performance of SRI Funds: A Meta-Analysis
24
Carhart, M. M.: 1997, ‘On the Persistence in Mutual Fund Performance’, The Journal of
Finance 52(1), 57–82.
Chang, C. E. and H. D. Witte: 2010, ‘Performance Evaluation of U.S. Socially
Responsible Mutual Funds: Revisiting Doing Good and Doing Well’, American
Journal of Business 25(1), 9–22.
Chegut, A., H. Schenk and B. Scholtens: 2011, ‘Assessing SRI Fund Performance
Research: Best Practices in Empirical Analysis’, Sustainable Development 19(2), 77–
94.
Cortez, M. C., F. Silva and N. Areal: 2009, ‘The Performance of European Socially
Responsible Funds’, Journal of Business Ethics 87(4), 573–588.
Derwall, J. and K. Koedijk: 2009, ‘Socially Responsible Fixed-Income Funds’, Journal of
Business Finance & Accounting 36(1/2), 210–229.
Eurosif: 2010, ‘European SRI Study 2010’, Paris.
Ferson, W. E. and R. W. Schadt: 1996, ‘Measuring Fund Strategy and Performance in
Changing Economic Conditions’, The Journal of Finance 51(2), 425–461.
Gil-Bazo, J., P. Ruiz-Verdu and A. A. P. Portela: 2010, ‘The performance of socially
responsible mutual funds: the role of fees and management companies’, Journal of
Business Ethics 94(2), 243–263.
Goldreyer, E. F., P. Ahmed and J. D. Diltz: 1999, ‘The Performance of Socially
Responsible Mutual Funds: Incorporating Sociopolitical Information in Portfolio
Selection’, Managerial Finance 25(1), 23–36.
Gregory, A. and J. Whittaker: 2007, ‘Performance and Performance Persistence of Ethical
Unit Trusts in the UK’, Journal of Business Finance & Accounting 34(7–8), 1327–
1344.
Gregory, A., J. Matatko and R. Luther: 1997, ‘Ethical Unit Trust Financial Performance:
Small Company Effects and Fund Size Effects’, Journal of Business Finance &
Accounting 24(5), 705–725.