Aesthetic Groundwater Quality Impacts from a Continuous Pilot-Scale Release of an Ethanol Blend pptx
Bạn đang xem bản rút gọn của tài liệu. Xem và tải ngay bản đầy đủ của tài liệu tại đây (1018.42 KB, 8 trang )
NGWA.org Ground Water Monitoring & Remediation 31, no. 3/ Summer 2011/pages 47–54 47
© 2011, The Author(s)
Ground Water Monitoring & Remediation
© 2011, National Ground Water Association.
doi: 10.1111/j1745–6592.2011.01334.x
Aesthetic Groundwater Quality Impacts
from a Continuous Pilot-Scale Release
of an Ethanol Blend
by Jie Ma, Zongming Xiu, Amy L. Monier, Irina Mamonkina, Yi Zhang, Yongzhi He, Brent P. Stafford,
William G. Rixey, and Pedro J.J. Alvarez
Abstract
A pilot-scale aquifer system (8 m
3
continuous-flow tank packed with fine grain sand) was used to evaluate groundwater
quality impacts from a continuous release of 10% v:v ethanol solution in water mixed with benzene and toluene (50 mg/L
each). The geochemical footprint (methane [CH
4
], volatile fatty acids [VFAs], pH, oxidation reduction potential [ORP], dis-
solved oxygen [DO], and temperature) was monitored more than 11 months. A rapid depletion of DO (from 5.3 to less than
0.1 mg/L) and a decrease of ORP (from 110 to −310 mV) were observed within 25 d of the release. The high-biochemical
oxygen demand exerted by ethanol resulted in strongly anaerobic conditions, indicated by the accumulation of CH
4
(up to
17.9 mg/L) and VFAs (up to 226 mg/L acetic acid and 280 mg/L n-butyric acid). Measurements at the sand surface (40 cm
from the water table) using a portable combustible gas detector did not detect CH
4
. However, accumulation of VFAs (par-
ticularly n-butyric acid) during the summer exceeded the secondary maximum contaminant level value for odor (odor levels
extrapolated from aqueous concentrations), which represents a previously unreported aesthetic impact. Temperature variations
(3.9 to 30.0 °C) significantly affected microbial activities, and a strong correlation was observed between groundwater tem-
perature and CH
4
/VFAs generation (p less than 0.05). Overall, these results suggest that seasonal variation of odor generation
and CH
4
concentration should be considered at sites contaminated with fuel ethanol blends.
Introduction
Ethanol is increasingly being used as a blending agent
for gasoline, which increases the likelihood of ethanol blend
releases during transportation and from underground stor-
age. Thus, it is important to investigate the potential ground-
water quality impacts of such releases. Previous research
has studied the migration characteristics of ethanol in the
subsurface (Dakhel et al. 2003; McDowell et al. 2003a;
McDowell and Powers 2003b; Corseuil et al. 2004; Capiro
et al. 2007; Stafford et al. 2009), its impact on indigenous
microorganisms (Capiro et al. 2008; Feris et al. 2008;
Nelson et al. 2010), and its influence on the concentration
and persistence of petroleum hydrocarbons such as ben-
zene, toluene, ethylbenzene, and xylenes (BTEX; Corseuil
et al. 1998; Lovanh et al. 2002; Ruiz-Aguilar et al. 2003;
Mackay et al. 2006; Beller et al. 2008). However, less atten-
tion has been directed toward potential groundwater quality
impacts of intermediate ethanol biodegradation products,
and how these impacts may change with seasonal variations
in temperature.
In groundwater, ethanol biodegradation rapidly con-
sumes oxygen and other electron acceptors creating an
anaerobic environment. Under these anaerobic conditions,
ethanol can be fermented to volatile fatty acids (VFAs)
such as acetic, propionic, n-butyric, and isobutyric acids,
which can be further syntrophically transformed to hydro-
gen (H
2
) and methane (CH
4
) (Powers et al. 2001). The
intermediate degradation products are ultimately mineral-
ized (to H
2
O and CO
2
) under oxidizing conditions. Transient
presence of VFAs, however, may cause aesthetic impacts to
potable groundwater because of their odor and taste. In the
United States, the Environmental Protection Agency (US
EPA) includes odor as 1 of 15 contaminants in National
Secondary Drinking Water Regulations. Furthermore, CH
4
could accumulate in shallow aquifers and subsurface soils
and pose hazards at sites with subsurface confined spaces
and conditions conducive to ignition (Freitas et al. 2010;
Nelson et al. 2010).
Groundwater temperature is an important factor that
affects indigenous microbial activities (Alvarez and Illman
2005). Therefore, variations in groundwater temperature
48 J. Ma et al./ Ground Water Monitoring & Remediation 31, no. 3: 47–54 NGWA.org
tolerance range of soil bacteria (Atlas and Bartha 1993). The
density of the ethanol/NaBr solution injected, relative to
water, was measured as 1.002 at 20 °C. Channel 2 served as
a control with the same injection depth and injection rate of
a water mixture containing 50 mg/L benzene, 50 mg/L tolu-
ene (B/T), and 24,000 mg/L NaBr with an estimated density
relative to water of 1.019 at 20 °C. The monitoring network
was designed to delineate the developed solute (i.e., B/T and
ethanol) plumes and characterize solute degradation and
accumulation of CH
4
and VFAs. All sampling ports (sample
ports were steel tubes screened on the bottom outlet) were
at the same depth as the E/B/T mixture injection point.
Vertical sampling in Channel 2 was conducted at various
depths given the possibility of some downward migration.
CH
4
and VFAs Analysis
Aqueous samples (A1, B1 for Channel 1 and A2, B2 for
Channel 2) were collected every 10 d from August 7, 2009
to June 9, 2010 and analyzed for CH
4
and VFAs.
For CH
4
analysis, aqueous samples (50 mL) were injected
into glass serum bottles (125 mL) capped with a Teflon-
lined septa and aluminum crimps. Bottles were shaken on
an Orbit 300 Multipurpose Vortexer (Labnet International
Inc., Edison, New Jersey) at 35 revolutions per minute (rpm)
for 1.5 h. Headspace samples (100 µL) were injected into
a gas chromatograph (GC; HP 5890, Minnesota, equipped
with a flame ionization detector [FID]) using a packed col-
umn (6 foot × 1/8 in o.d. 60/80 carbopack B/1% SP-1000,
Supelco, Bellefonte, Pennsylvania). The detection limit was
0.1 mg/L.
For VFA analysis (acetic, propionic, and n-butyric acid),
2.7 mL aqueous samples were collected and mixed with
0.3 mL of 0.3-M oxalic acid (to acidify the samples and
protonate the VFAs; Capiro et al. 2008). Mixtures were then
filtered into 1-mL screw-cap vials followed by 1 µL injec-
tions into a GC (hp 5890, Minnesota) equipped with a FID
and a glass column (2 m × 2 mm inner diameter) containing
80/120 Carbopack B-DA*/4% Carbowax 20 M (Supelco,
Bellefonte, Pennsylvania). The GC heating program was
175 °C for 10 min, injection port temperature 200 °C, and
FID temperature 200 °C. The method detection limit was
1 mg/L for acetic and propionic acid, and was 2 mg/L for
n-butyric acid.
Ethanol, Benzene, Toluene, and Bromide Tracer Analysis
Aqueous samples were collected every 2 d from August
7, 2009 to June 9, 2010 and analyzed for ethanol, benzene,
and toluene. The samples withdrawn from the tank were
injected into gastight 20-mL glass vials without headspace
with seasonal changes should be considered when assess-
ing an aquifer’s capacity for natural attenuation of ethanol
blends releases and characterizing impacts from by-products
of ethanol biodegradation. In this study, a pilot-scale aquifer
system was used to assess the groundwater quality impacts
from a continuous release of a simulated fuel ethanol blend
(ethanol, benzene, and toluene). The information gained by
monitoring this release over various seasons improves the
understanding of VFAs-induced odor and CH
4
generation
and accumulation, and the influence of temperature on these
interrelated processes.
Methods
Pilot-Scale Aquifer System
An 8 m
3
(3.7 × 1.8 × 1.2 m) pilot-scale continuous-flow
tank packed with fine grain sand was used in this study. The
tank was covered by a canopy to avoid confounding effects
from rain water and was open to the atmosphere. Details
on the tank construction, gravity-fed hydraulics, media,
and packing methods can be found in Stafford (2007).
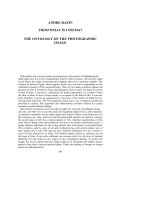
A plan view of the tank is shown in Figure 1. Two paral-
lel channels separated by an acrylic barrier were equipped
with independent inlet and outlet lines and instrumented
with sampling ports and wells to monitor groundwater. Tap
water was injected from the inlet of each channel to obtain
a water table elevation of 0.75 m from the bottom of the
tank. The vadose zone was 0.35 m high and the total aquifer
thickness was 1.1 m. Inlet water characteristics can be found
in Table 1. In Channel 1, a municipal water feed amended
with 10% (v/v) ethanol, 50 mg/L benzene, 50 mg/L tolu-
ene (E/B/T), and 24,000 mg/L sodium bromide (NaBr) was
injected at a depth of 22.5 cm below the water table at a rate
of 0.4 L/d. The NaBr was added as a conservative tracer, and
to maintain a solution density to reach a neutral buoyancy
condition with the flowing groundwater. Although high-
salt concentrations can be inhibitory to bacteria because of
osmotic stress, the added bromide salt was diluted by the
tank flow to less than 5000 mg/L, which is within the typical
Figure 1. Plan view of the experimental release system. The
water table elevation was 0.75 m from the tank bottom and the
vadose zone thickness was 0.35 m. Sampling ports and injec-
tion points are located 22.5 cm below the water table.
Channel 2
B/T
Channel 1
EtOH+B/T
Inlet
54“ 34“ 23 “ 11 “
Outlet
A1 B1
M1
A2 B2
M2
M4
M3
Inlet
Outlet
Sonde
Groundwater inlets/outlets
Monitoring wells
Glass window
Injection point
Injection point
E/B/T injection points
Sampling wells
Table 1
Inlet Water Characteristics
P arameter Value (± SD, n = 158)
Flow rate (L/d) 170 ± 40 L/d (each channel)
pH 7.5 ± 0.4
DO (mg/L) 5.5
Ionic strength (mM) 6–12
NGWA.org J. Ma et al./ Ground Water Monitoring & Remediation 31, no. 3: 47–54 49
then decreased to less than 0.5 mg/L concomitantly with
the lower temperatures in January and February (less than
10 °C). CH
4
concentration then increased 0.2 (March 29th)
to 12.9 mg/L (June 9th) with the increasing temperatures
(from 16.0 to 30.0 °C). A similar trend was observed at the
B1 sampling well. The maximum CH
4
concentration was
17.9 mg/L (B1, May 29th, 26.9 °C), representing 81% of the
solubility limit at the corresponding temperature (Yamamoto
et al. 1976). CH
4
was not detected in the control channel
amended with only benzene and toluene (Channel 2) during
the 11-month period. The lack of CH
4
detection in the con-
trol channel may be because of (1) much longer acclima-
tion periods required for BTEX than for ethanol degradation
under methanogenic conditions, often requiring years (Da
Silva and Alvarez 2004) and (2) the control channel was
exposed to a much lower concentration of organic compounds
(92 vs. 1.3 × 10
4
mg/L as total organic carbon) that are
potential sources of reducing equivalents for CH
4
formation.
A BX 168 portable combustible gas detector (Henan
Hanwei Electronics Co. Ltd, China; detection limit: 1%
of CH
4
lower explosive limit, or 400 ppm
v
CH
4
) was used
to analyze for CH
4
concentrations in the air just above the
sand surface of the ethanol-amended channel. No CH
4
was
detected, probably because of dilution by air movement as
CH
4
reaches the surface, as well as to some possible CH
4
biodegradation by methanotrophs in the vadose zone (King
1997; Bull et al. 2000). However, migration of CH
4
from
near-source ethanol impacted groundwater and subsequent
accumulation in subsurface enclosed spaces could lead to
potential explosion risks where ignitable conditions exist.
Thus, further research is needed to delineate conditions that
are conducive to CH
4
accumulation to inform the need for
periodic monitoring.
A strong correlation existed between CH
4
production
(A1) and water temperature (p = 0.00075; Figure 5a), which
indicates that CH
4
generation from the fuel ethanol blends
were significantly influenced by the variation of tempera-
ture. The annual average temperature of shallow groundwa-
ter (10 to 25 m depth) in the United States ranges from 4 °C
in the north central areas to approximately 25 °C in southern
Florida. The seasonal variation in groundwater temperature
is greatest near the surface, amounting 5 to 10 °C (Heath
1983). Methanogenesis is known to be enhanced at higher
temperatures and inhibited by low temperatures (Cullimore
et al. 1985; Conrad et al. 1987; Westermann 1993).
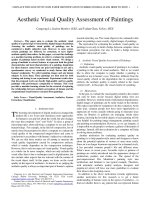
Effect of Temperature on VFAs Production
Acetic acid concentrations remained below 5 mg/L in the
control channel throughout the monitoring period. However,
in the channel exposed to the ethanol, acetic acid concen-
trations (A1) (Figure 3) increased from less than 1 mg/L
(August 7th, 29.9 °C) to 95.7 mg/L (December 8th, 14.6 °C),
followed by a concentration decrease to below 40 mg/L in
January (less than 10 °C). From February to June, with the
subsequent increase in temperature (from 8.0 to 30.0 °C), the
acetic acid concentration increased again to 131 mg/L (April
29th). A similar trend was observed at the sampling well B1.
The maximum concentration measured was 226 mg/L (B1,
May 10th, 23.9 °C). This indicates that acetic acid produc-
tion was significantly influenced by temperature variations.
and stored at 4 °C until further analysis. The vials were cen-
trifuged at 2000 rpm for 5 min during sample preparation.
For ethanol analysis, supernatants were collected in 2-mL
gastight glass vials with polypropylene caps and PTFE septa
(Sun SRI, Rockwood, Tennessee) and were injected directly
into a GC (hp 6890, Santa Clara, California) equipped with
a capillary column (Supelco, model SPB-5, 30 m length,
0.53 mm diameter, 5 m film thickness, St. Louis, Missouri)
and a FID (OI Analytical, College Station, Texas). The
detection limit was 1 mg/L. For benzene and toluene analy-
sis, supernatants (5 mL) were placed into a Tekmar P&T
Autosampler (model no. 2016, Mason, Ohio) and measured
by GC (Agilent 6890N, Santa Clara, California) equipped
with a 5973N Mass Selective Detector (J&W Scientific,
model DB-624, 20 m length, 0.130 mm diameter, Santa
Clara, California). The detection limit was 1.0 mg/L for
both benzene and toluene. Bromide samples were col-
lected separately in 125 mL field sampling bottles (Fisher
Scientific, Pittsburgh, Pennsylvania) and analyzed using a
bromide ion selective electrode (Cole-Parmer, Vernon Hills,
Illinois) as described by Capiro et al. (2007). The detection
limit was 1 mg/L.
Groundwater Geochemical Parameters Analysis
Temperature, pH, oxidation reduction potential (ORP),
dissolved oxygen (DO), and conductivity of groundwater
were monitored in Channel 1 by a Water Quality Sonde (YSI
600XLM, YSI Inc., Yellow Springs, Ohio) installed at M2
(Figure 1). The Sonde was programmed to take readings at
0:00 am and 12:00 pm daily from April 27, 2009 to June
9, 2010. Sensors were calibrated per manufacturer protocols.
Results and Discussion
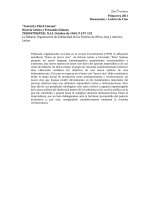
Effect of Temperature on CH
4
Production
Within the channel exposed to the ethanol, dissolved
CH
4
in A1 (Figure 2) increased from less than 0.1 (August
7th, 29.9 °C) to 6.8 mg/L (December 18th, 10.8 °C) and
Figure 2. CH
4
concentration at sampling well A1 (in Channel 1,
exposed to ethanol and B/T) and A2 (in Channel 2, exposed
to B/T alone). Sampling wells are depicted in Figure 1. Day 0
corresponds to August 17, 2009.
0 100 150 200 250 300
0
3
6
9
12
15
CH
4
(mg/L)
Days after B/T/(E) release
A1
A2
0
5
10
15
20
25
30
35
Groundwater
temperature
Temperature (°C)
50 J. Ma et al./ Ground Water Monitoring & Remediation 31, no. 3: 47–54 NGWA.org
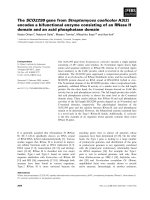
29th) (Figure 4). The initial lag in butyric acid production
was expected as butyric acid was likely a product of acetic
acid biotransformation. Under anaerobic conditions, ethanol
is oxidized to acetate followed by a conversion to acetyl
coenzyme A (acetyl-CoA). Two acetyl-CoA can form one
butyryl-coenzyme A, which can then be converted to butyr-
ate (Barker et al. 1945; Gibson 1965). As acetic acid is a
direct precursor for butyric acid formation, its higher abun-
dance is conducive to higher butyrate accumulation, and a
significant correlation was found between their concentra-
tions (p = 0.0012; Figure 6b). Accordingly, a significant
correlation was also found between butyric acid production
(A1) and temperature (p = 0.00000023; Figure 5c).
Similar to CH
4
, a significant correlation was found between
acetic acid production (A1) and temperature (p = 0.000024;
Figure 5b). Apparently, higher temperatures are conducive
to faster ethanol biotransformation to VFAs (mainly acetic
acid) and H
2
, which in turn result in higher CH
4
production.
Accordingly, higher availability of acetic acid (or its conju-
gate base acetate, which is the main substrate for aceticlastic
methanogens) was significantly correlated (p = 0.027) to
CH
4
concentrations (Figure 6a).
Unlike acetic acid, butyric acid remained at a relatively
low level (less than 20 mg/L) from August 7th
until late
February, and then increased steadily to 280 mg/L (A1, May
Figure 3. Acetic acid concentrations at sampling wells A1 (in
Channel 1, exposed to ethanol and B/T) and A2 (in Channel 2,
exposed to B/T alone). Sampling wells are depicted in Figure
1. Day 0 corresponds to August 17, 2009.
0 100 150 200 250 300
0
30
60
90
120
150
Acetic acid (mg/L)
Days after B/T/(E) release
A1
A2
0
5
10
15
20
25
30
35
Groundwater
Temperature
Temperature (°C)
Figure 4. Butyric acid concentrations at sampling wells A1 (in
Channel 1, exposed to ethanol and B/T) and A2 (in Channel 2,
exposed to B/T alone). Sampling wells are depicted in Figure
1. Day 0 corresponds to August 17, 2009.
0 100 150 200 250 300
0
50
100
150
200
250
300
n-butyric acid(mg/L)
Days after B/T/(E) release
A1
A2
0
5
10
15
20
25
30
35
Groundwater
Temperature
Temperature (°C)
Figure 5. Significant correlations between (a) CH
4
, (b) acetic acid, and (c) butyric acid concentrations (measured at A1) vs. ground-
water temperature.
(a) (b)
(c)
NGWA.org J. Ma et al./ Ground Water Monitoring & Remediation 31, no. 3: 47–54 51
significant removal; then, the low-temperature winter condi-
tions occurred and little ethanol degradation was observed.
Benzene and toluene similarly experienced lower attenua-
tion during the winter. Significant attenuation for ethanol,
benzene, and toluene returned in the spring as temperatures
increased. Attenuation of toluene was generally one order of
magnitude greater than that for benzene.
Because the injected mixtures for both channels were
the same except for the ethanol concentration, the absence
of the lighter ethanol in Channel 2 could have resulted in a
denser solute plume. Additional sample points from differ-
ent depths were collected and analyzed, but a solute plume
was not identified in this channel. As monitoring did not
identify the location and fate of the B/T plume in Channel 2,
a comparison of attenuation of benzene and toluene in the
presence vs. the absence of ethanol was not possible.
Effect on ORP, DO, and pH
ORP, pH, and DO data varied seasonally. The decrease
in ORP (from 110 to −310 mV), pH (from 7.0 to 5.1), and
DO (from 5.3 to 0 mg/L) following the release of the ethanol
blend indicated transition to anaerobic conditions. During
January and February, microbial activity was inhibited by
low temperatures (less than 10 °C), resulting in an increase
in ORP (to 80 mV), DO (to 3.6 mg/L), and pH (to 6.7)
thereby shifting the aquifer system from anaerobic to aerobic
conditions (Hillel 2004). After March, the system reverted
back to an anaerobic state indicated by a decrease of ORP
(to −400 mV), DO (to less than 0.1 mg/L), and pH (to 4.6)
thereby corroborating the relationship in ORP, pH, and DO
with temperature.
VFA Odor Generation
The standard odor criteria (secondary maximum con-
taminant level [SMCL]) for the US EPA National Secondary
Drinking Water Regulations is a threshold odor number
(TON) = 3. The TON is defined as the greatest dilution of
sample with odor-free water yielding a definitely percep-
tible odor (Greenberg et al. 1992). We determined the TON
for each VFAs species according to Equation 1:
Threshold odor number =
Odorant concentratioon (C )
Odor threshold value for that odo
gas
rrant
(1)
The “odor threshold value” is the lowest concentration
of a specific odorant detectable by human olfaction. The
“odorant concentration” is the gas phase concentration (C
gas
)
of a specific odorant (e.g., VFAs), which can be estimated
based on the measured aqueous concentration (C
aq
). Note
that C
aq
is the total concentration comprising both the weak
acid (i.e., the protonated form susceptible to volatilization)
and its conjugated base (which is charged and not suscep-
tible to volatilization). The concentration of the protonated
form that can undergo volatilization (and thus generate
odor), C
HA
,
can be calculated based on the measured C
aq
, the
pH of the solution, and the corresponding acid/base equilib-
rium constant (Ka) and molecular weight (MW) according
to Equation 2:
Ethanol, Benzene, and Toluene Attenuation
Attenuation of ethanol, benzene, and toluene in Channel
1 was also affected by temperature (Figure 7). The data in
Figure 6 are plotted as normalized solute concentrations
(C/C
o
)
i
divided by the normalized bromide concentrations
(C/C
o
)
Br
. When plotted in this way, attenuation because of
dilution is separated from attenuation resulting from bio-
degradation and volatilization. For ethanol, a short accli-
mation period with negligible attenuation was followed by
Figure 6. Significant correlations between acetic acid availabil-
ity and (a) CH
4
and (b) butyric acid concentrations (measured
at A1). Acetic acid is a precursor to both CH
4
and butyric acid
formation.
(a)
(b)
Figure 7. Ethanol, benzene, and toluene attenuation at sam-
pling well A1 (in Channel 1, exposed to ethanol and B/T).
Sampling ports are depicted in Figure 1. Day 0 corresponds
to August 17, 2009.
0 100 150 200 250 300 350
0.001
0.01
0.1
1
10
(C/C
0
)
i
/(C/C
0
)
Br
Days after B/T/(E) release
Ethanol
Benzene
Toluene
0
5
10
15
20
25
30
35
Groundwater
Temperature
Temperature (°C)
52 J. Ma et al./ Ground Water Monitoring & Remediation 31, no. 3: 47–54 NGWA.org
For simplicity, we assumed that only acetic acid, pro-
pionic acid, and n-butyric acid contribute to the odor in the
groundwater sample. The TON of the summer sample (A1,
May 29th; 1045 TON) was much larger than the SMCL, and
n-butyric acid was the major contributor to odor generation.
The TON of the winter sample (A1, Jan 8th; less than 0.4
TON), however, was lower than the SMCL. As discussed
previously, lower temperatures decreased microbial activi-
ties (including transformation of ethanol into VFAs) that
mitigated odor generation. Overall, the results indicate that
near a source, ethanol-blend releases to groundwater can
generate odor problems that compromise water quality, but
the level of impact would likely vary seasonally.
Conclusions
A strong correlation was observed between groundwater
temperature and CH
4
/VFAs concentrations (p less than 0.05)
and associated odor generation within the channel exposed
to continuously released ethanol. The main contributor to
water odor was n-butyric acid, which accumulated at levels
C(mol/L)=
C(mg/L)10 (g/mg)
MW (g/ mo
HA
aq
3
ϫ
Ϫ
ll) (1 K / 10 )
a
pH
ϫϩ
Ϫ
(2)
C
gas
can be calculated using Henry’s law (Equation 3), where
K
H
is Henry’s law constant:
C
gas
(ppm
v
) =
C
HA
(mol / L) × 10
3
(L / m
3
) × K
H
(atm
.m
3
/ mol
)
________________________________
1 atm
×10
6
(3)
Two representative samples of different seasons (A1, Jan
8th and A1, May 29th) were chosen to assess the seasonal
variation of odor generation. The groundwater temperature
and pH for these two samples were 6.6 °C, pH 6.6 for A1
(Jan 8th) and 26.9 °C, pH 4.6 for A1 (May 29th). Table 2
summarizes the calculated C
gas
values, and Table 3 depicts
the odor threshold value for each VFAs and the TON values
for each sample. Specific odor occurrence and impact will
vary between direct testing methods and specific use scenar-
ios (drinking, cooking, washing, showering, and so forth).
Table 3
VFAs TON
VFAs
Odor Threshold Value
(ppm
v
)
C
gas
(ppm
v
)
TON
Summer (sampled at A1, May 29th, 26.9 °C)
Acetic acid 1
a
1.10×10
−1
0.1
Propionic acid 0.0057
b
2.29×10
−2
4.4
n-Butyric acid 0.001
b
1.04 1045
Winter (sampled at A1, Jan 8th, 6.6 °C)
Acetic acid 1
a
2.66×10
−4
Less than 0.1
Propionic acid 0.0057
b
2.15×10
−4
Less than 0.1
n-Butyric acid 0.001
b
1.92×10
−4
0.2
a
Source: Cheremisinoff (1999).
b
Source: Nagata (2003).
Table 2
Calculated VFAs C
gas
VFAs
Measured
C
aq
(mg/L)
pKa
C
HA
(mol/L)
Henry’s Law
Constant
(atm m
3
/mol)
a
C
gas
(ppm
v
)
Summer (sampled at A1, May 29th, 26.9 °C)
Acetic acid 116 4.75
b
1.02×10
−3
1.08×10
−7
1.10×10
−1
Propionic acid 7 4.87
b
5.64×10
−5
4.42×10
−7
2.49×10
−2
Butyric acid 280 4.85
b
1.86×10
−3
5.62×10
−7
1.04
Winter (sampled at A1, Jan 8th, 6.6 °C)
Acetic acid 25 4.75
b
5.80×10
−6
4.58×10
−8
2.66×10
−4
Propionic acid 4 4.87
b
9.87×10
−7
2.17×10
−7
2.15×10
−4
Butyric acid 3 4.85
b
5.95×10
−7
3.23×10
−7
1.92×10
−4
a
Henry’s constants were obtained from (Howard 1990) for acetic acid, and from (Howard 1997) for propionic and butyric acids. These constants were corrected for the cor-
responding temperature using the Van’t Hoff equation, using standard enthalpy values from Haynes (2010).
b
Source: Schwarzenbach et al. (2002).
NGWA.org J. Ma et al./ Ground Water Monitoring & Remediation 31, no. 3: 47–54 53
mixtures in bioaugmented aquifer columns. Applied and
Environmental Microbiology 70, no. 8: 4720–4726.
Dakhel, N., G. Pasteris, D. Werner, and P. Hohener. 2003. Small-
volume releases of gasoline in the vadose zone: Impact of
the additives MTBE and ethanol on groundwater quality.
Environmental Science & Technology 37, no. 10: 2127–2133.
Feris, K., D. Mackay, N. de Sieyes, I. Chakraborty, M. Einarson,
K. Hristova, and K. Scow. 2008. Effect of ethanol on microbial
community structure and function during natural attenuation of
benzene, toluene, and o-xylene in a sulfate-reducing aquifer.
Environmental Science & Technology 42, no. 7: 2289–2294.
Freitas, J.G., B. Fletcher, R. Aravena, and J.F. Barker. 2010.
Methane production and isotopic fingerprinting in ethanol fuel
contaminated sites. Ground Water, 48, no.6: 844–857.
Gibson, D.M. 1965. Biosynthesis of fatty acids. Journal of
Chemical Education 42, no. 5: 236–243.
Greenberg, A.E., L.S. Clesceri, and A.D. Eaton. 1992. Standard
Methods for the Examination of Water and Wastewater, 18th ed.
American Public Health Association: Washington, DC.
Haynes, W.M. 2010. CRC Handbook of Chemistry and Physics,
91st Edition, New York: CRC Press.
Heath, R.C. 1983. Basic ground-water hydrology. Water Supply
Paper 2220. Reston, VA: U.S. Geological Survey.
Hillel, D. 2004. Encyclopedia of Soils in the Environment.
Maryland Heights, Missouri: Elsevier/Academic Press.
Howard, P.H. 1990. Handbook of Environmental Fate and Exposure
Data for Organic Chemicals. Boca Raton, Florida: CRC Press.
Howard, P.H. 1997. Handbook of Environmental Fate and Exposure
Data for Organic Chemicals. CRC Press.
King, G.M. 1997. Responses of atmospheric methane consumption
by soils to global climate change. Global Change Biology 3, no.
4: 351–362.
Lovanh, N., C.S. Hunt, and P.J.J. Alvarez. 2002. Effect of ethanol
on BTEX biodegradation kinetics: Aerobic continuous culture
experiments. Water Research 36, no. 15: 3739–3746.
Mackay, D.M., N.R. De Sieyes, M.D. Einarson, K.P. Feris,
A.A. Pappas, I.A. Wood, L. Jacobson, L.G. Justice, M.N. Noske,
K.M. Scow, and J.T. Wilson. 2006. Impact of ethanol on the nat-
ural attenuation of benzene, toluene, and o-xylene in a normally
sulfate-reducing aquifer. Environmental Science & Technology
40, no. 19: 6123–6130.
McDowell, C.J., T. Buscheck, and S.E. Powers. 2003a. Behavior
of gasoline pools following a denatured ethanol spill. Ground
Water 41, no. 6: 746–757.
McDowell, C.J., and S.E. Powers. 2003b. Mechanisms affecting
the infiltration and distribution of ethanol-blended gasoline in
the vadose zone. Environmental Science & Technology 37, no.
9: 1803–1810.
Nagata, Y. 2003. Measurement of odor threshold by triangle odor
bag method. Odor Measurement Review, 118–127. Japan:
Japan Ministry of the Environment.
Nelson, D.K., T.M. Lapara, and P.J. Novak. 2010. Effects of
ethanol-based fuel contamination: Microbial community
changes, production of regulated compounds, and methane
generation. Environmental Science & Technology 44, no. 12:
4525–4530.
Powers, S.E., C.S. Hunt, S.E. Heermann, H.X. Corseuil, D. Rice,
and P.J.J. Alvarez. 2001. The transport and fate of ethanol
and BTEX in groundwater contaminated by gasohol. Critical
Reviews in Environmental Science and Technology 31, no. 1:
79–123.
Ruiz-Aguilar, G.M.L., K. O’Reilly, and P.J.J. Alvarez. 2003. A
comparison of benzene and toluene plume lengths for sites con-
taminated with regular vs. ethanol-amended gasoline. Ground
Water Monitoring and Remediation 23, no. 1: 48–53.
that exceeded the SMCL stipulated by National Secondary
Drinking Water Regulations. The production of CH
4
up to
C
aq
of 17.9 mg/L did not result in detectable concentrations
at the surface (40 cm above the water table). The potential
for transport and accumulation of CH
4
gas from groundwa-
ter to subsurface confined spaces without adequate mecha-
nisms for dilution and attenuation needs further evaluation.
Overall, these results show that groundwater tempera-
ture fluctuations can influence CH
4
and VFAs generation.
Therefore, seasonal variation of odor generation and CH
4
accumulation in the subsurface (or subsurface confined
spaces) should be considered at sites contaminated with fuel
ethanol blends.
References
Alvarez, P.J., and W.A. Illman. 2005. Bioremediation and Natural
Attenuation: Process Fundamentals and Mathematical Models.
Hoboken, New Jersey: Wiley-Interscience.
Atlas, R.M., and R. Bartha. 1993. Microbial Ecology: Fundamentals
and Applications. San Francisco, California: Benjamin/
Cummings Publishing Company Inc.
Barker, H.A., M.D. Kamen, and B.T. Bornstein. 1945. The syn-
thesis of butyric and caproic acids from ethanol and acetic
acid by Clostridium kluyveri. Proceedings of the National
Academy of Sciences of the United States of America 31, no.
12: 373–381.
Beller, H.R., S.R. Kane, T.C. Legler, J.R. McKelvie, B.S. Lollar,
F. Pearson, L. Balser, and D.M. MacKay. 2008. Comparative
assessments of benzene, toluene, and xylene natural attenu-
ation by quantitative polymerase chain reaction analysis of a
catabolic gene, signature metabolites, and compound-specific
isotope analysis. Environmental Science & Technology 42, no.
16: 6065–6072.
Bull, I.D., N.R. Parekh, G.H. Hall, P. Ineson, and R.P. Evershed.
2000. Detection and classification of atmospheric methane oxi-
dizing bacteria in soil. Nature 405, no. 6783: 175–178.
Capiro, N.L., M.L.B. Da Silva, B.P. Stafford, W.G. Rixey, and P.J.J.
Alvarez. 2008. Microbial community response to a release of
neat ethanol onto residual hydrocarbons in a pilot-scale aquifer
tank. Environmental Microbiology 10, no. 9: 2236–2244.
Capiro, N.L., B.P. Stafford, W.G. Rixey, P.B. Bedient, and P.J.J.
Alvarez. 2007. Fuel-grade ethanol transport and impacts to
groundwater in a pilot-scale aquifer tank. Water Research 41,
no. 3: 656–664.
Cheremisinoff, N.P. 1999. Handbook of Industrial Toxicology and
Hazardous Materials, 1st ed. New York: CRC Press.
Conrad, R., H. Schutz, and M. Babbel. 1987. Temperature limita-
tion of hydrogen turnover and methanogenesis in anoxic paddy
soil. Fems Microbiology Ecology 45, no. 5: 281–289.
Corseuil, H.X., C.S. Hunt, R.C.F. Dos Santos, and P.J.J. Alvarez.
1998. The influence of the gasoline oxygenate ethanol on aero-
bic and anaerobic BTX biodegradation. Water Research 32, no.
7: 2065–2072.
Corseuil, H.X., B.I.A. Kaipper, and M. Fernandes. 2004.
Cosolvency effect in subsurface systems contaminated with
petroleum hydrocarbons and ethanol. Water Research 38, no.
6: 1449–1456.
Cullimore, D.R., A. Maule, and N. Mansuy. 1985. Ambient-
temperature methanogenensis from pig manure waste lagoons:
Thermal gradient incubator studies incubator studies.
Agricultural Wastes 12, no. 2: 147–157.
Da Silva, M.L.B., and P.J.J. Alvarez. 2004. Enhanced anaerobic bio-
degradation of benzene-toluene-ethylbenzene-xylene-ethanol
54 J. Ma et al./ Ground Water Monitoring & Remediation 31, no. 3: 47–54 NGWA.org
Schwarzenbach, R.P., P.M. Gschwend, and D.M. Imboden. 2002.
Environmental Organic Chemistry, 2nd ed. Hoboken, New
Jersey: Wiley-Interscience.
Stafford, B.P. 2007. Impacts to groundwater from releases of fuel-
grade ethanol: Source behavior. Ph.D. dissertation, Engineering
Graduate Program, University of Houston, Houston, Texas.
Stafford, B.P., N.L. Capiro, P.J.J. Alvarez, and W.G. Rixey. 2009.
Pore water characteristics following a release of neat etha-
nol onto pre-existing NAPL. Ground Water Monitoring and
Remediation 29, no. 3: 93–104.
Westermann, P. 1993. Temperature regulation of methanogenesis
in wetlands. Chemosphere 26, no. 1–4: 321–328.
Yamamoto, S., J.B. Alcauskas, and T.E. Crozier. 1976. Solubility
of methane in distilled water and seawater. Journal of Chemical
and Engineering Data 21, no. 1: 78–80.
Biographical Sketches
Jie Ma, Ph.D. student, is with the Department of Civil and
Environmental Engineering, Rice University, 6100 Main St., MS
519, Houston,TX 77005.
Zongming Xiu, Ph.D., is a postdoctoral fellow with the
Department of Civil and Environmental Engineering, Rice
University, 6100 Main St., MS 519, Houston, TX 77005.
Amy L. Monier, Ph.D. student, is with the Department of Civil
and Environmental Engineering, Rice University, 6100 Main St.,
MS 519, Houston, TX 77005.
Irina Mamonkina, graduate student, is with the Department
of Civil and Environmental Engineering, University of Houston,
4800 Calhoun Rd., Houston, TX 77204-4003.
Yi Zhang, Ph.D. student, is with the Department of Civil and
Environmental Engineering, University of Houston, 4800 Calhoun
Rd., Houston, TX 77204-4003.
Yongzhi He, graduate student, is with the Department of Civil
and Environmental Engineering, University of Houston, 4800
Calhoun Rd., Houston, TX 77204-4003.
Brent P. Stafford, Ph.D., is an Environmental Engineer with
Shell Global Solutions (US) Inc., 3333 Hwy 6 S., Houston, TX
77082.
William G. Rixey, Ph.D., is an associate professor with the
Department of Civil and Environmental Engineering, University of
Houston, 4800 Calhoun Rd., Houston, TX 77204-4003.
Pedro J.J. Alvarez, Ph.D., corresponding author, is the
Department Chair and George R. Brown Professor of Engineering
at the Department of Civil and Environmental Engineering, Rice
University, 6100 Main St., MS 519, Houston, TX 77005; (713) 348-
5903; fax: (713) 348-5203;
®
“Step Ahead”
www.NGWA.org
800 551.7379 t 614 898.7791
JOIN YOUR FELLOW GROUNDWATER PROFESSIONALS
It’s here at the NGWA Ground Water Expo and
Annual Meeting that professionals from all sectors
of the industry—scientists and engineers, water
well contractors, manufacturers and suppliers—
gather in one setting to work together to advance
groundwater knowledge.
s3ESSIONS
s0ANELPRESENTATIONS
s7ORKSHOPS
s.'72%&LECTURERS
s.ETWORKINGEVENTS
s!WARDPRESENTATIONS
s%XHIBITHALL
s.EWPRODUCTS
s!NDMORE
0HOTOCOURTESYOF,AS6EGAS.EWS"UREAU