Báo cáo khoa học: Autonomous oscillations in Saccharomyces cerevisiae during batch cultures on trehalose pot
Bạn đang xem bản rút gọn của tài liệu. Xem và tải ngay bản đầy đủ của tài liệu tại đây (573.12 KB, 11 trang )
Autonomous oscillations in Saccharomyces cerevisiae
during batch cultures on trehalose
Matthieu Jules, Jean Franc¸ois and Jean Luc Parrou
Centre de Bioingenierie Gilbert Durand, UMR-CNRS 5504, UMR-INRA 792, Institut National des Sciences Applique
´
es, Toulouse, France
Oscillatory dynamics have been extensively described
in micro-organisms, in particular the yeast Saccharo-
myces cerevisiae (for recent reviews, see [1–3]). They
are usually undesirable and constitute a severe limita-
tion in industrial processes. Two types of oscillation
have been reported in this yeast species. The first type
are the glycolytic oscillations identified in intact yeast
cells as well as in cell-free extract as transient and
highly damped events after perturbation. However,
sustained glycolytic oscillations have been observed in
intact cells under specific conditions [4,5]. Their fre-
quency is around 1 min in intact cells, and the syn-
chronizing agent is thought to be acetaldehyde [2].
Oscillations of the second type are observed in
glucose-limited continuous cultures of yeast, and are
referred to as autonomous or ‘ultradian’ (i.e. cycles
shorter than 24 h). These oscillations are dependent
on a respiratory regimen and are classified into two
groups [2]. Oscillations of the first group are related to
the cell cycle. They are characterized by highly repro-
ducible and sustained oscillations of dissolved oxygen
uptake rate and CO
2
evolution rate, with periods that
are dependent on the dilution rate [6]. Other metabolic
parameters also oscillate in phase, such as biomass
concentration, content of storage carbohydrates, and
ethanol and acetate production. The molecular basis of
the relationship of these oscillations to the cell cycle is
still poorly understood [1,2]. In contrast, oscillations
of the second group are growth rate independent.
They exhibit shorter periods than the cell-cycle-related
Keywords
acid trehalase (Ath1p); batch culture; Fourier
transform; oscillations; trehalose
Correspondence
J. Franc¸ois, Centre de Bioingenierie Gilbert
Durand, UMR-CNRS 5504, UMR-INRA 792,
Institut National des Sciences Applique
´
es,
135 Avenue de Rangeuil, 31077 Toulouse
cedex 04, France
Fax: 00 33 5 61 559400
Tel : 00 33 5 61 559492
E-mail:
Web site: />jmflab
(Received 15 December 2004, revised 21
January 2005, accepted 31 January 2005)
doi:10.1111/j.1742-4658.2005.04588.x
We report that autonomous oscillations, which usually happen in aerobic
glucose-limited continuous cultures of yeast at low dilution rate, were also
observed in trehalose discontinuous cultures of Saccharomyces cerevisiae.
This unexpected oscillatory behaviour was therefore examined using fast
Fourier transformation of online gas measurements. This robust mathemat-
ical analysis underlined the existence of two types of oscillation. The first
was found to be linked to the cell cycle because (a) the periodicity corres-
ponded to a fraction of the generation time and (b) the oscillations were
accompanied by a transient increase in the budding index, mobilization of
storage carbohydrates, and fermentative activity. Moreover, these oscilla-
tions occurred in a range of specific growth rates between 0.04 and
0.15 h
)1
. All these criteria were consistent with the cell-cycle-related meta-
bolic oscillations observed in the same range of growth rates in glucose-
limited continuous cultures. The second type were short-period respiratory
oscillations, independent of the specific growth rate. Both types of oscilla-
tion were found to take place consecutively and ⁄ or simultaneously during
batch culture on trehalose. In addition, mobilization of intracellular treha-
lose emerged as a key parameter for the sustainability of these autonomous
oscillations as they were no longer observed in a mutant defective in neut-
ral trehalase activity. We propose that batch culture on trehalose may be
an excellent device for further investigation of the molecular mechanisms
that underlie autonomous oscillations in yeast.
Abbreviations
Ath1p, acid trehalase; FFT, fast Fourier transform; RQ, respiratory quotient.
1490 FEBS Journal 272 (2005) 1490–1500 ª 2005 FEBS
oscillations and are found in yeast growing in acid
conditions [7–9]. This group of oscillations also shows
robust temperature and nutrient-compensation proper-
ties, i.e. their period is barely affected by variations in
temperature or cell doubling rate. They have been
shown to be under the control of a respiratory clock
the main property of which is the time-keeping func-
tion [1,9,10].
Until now, autonomous oscillations have been des-
cribed only in aerobic chemostat cultures of S. cerevi-
siae at low dilution rates. In this work, we have
identified for the first time oscillatory behaviour in
S. cerevisiae during discontinuous culture on trehalose.
The purpose of this work was to examine these oscilla-
tory patterns and compare them with those identified
in continuous cultures. To this end, we exploited
online gas data (O
2
and CO
2
) with the fast Fourier
transformation (FFT), as this algorithm has been
shown to be extremely robust for analysis of autonom-
ously oscillating yeast chemostat cultures [9,11]. Hence,
we were able to identify in batch cultures on trehalose
the existence of both cell-cycle-related and short-period
oscillations which, contrary to previous reports in che-
mostat cultures [7,12], can take place consecutively
and ⁄ or simultaneously. Moreover, we have shown that
carbon flow and intracellular trehalose mobilization
are two key parameters in the occurrence and sustaina-
bility of these autonomous oscillations under our
growth conditions.
Results
Autonomous oscillations during batch culture
on trehalose
With trehalose as the carbon source, the growth of the
CEN.PK113-7D wild-type strain in a batch reactor
started after a lag phase of % 30 h with a maximal
growth rate (l
m
) close to 0.07 h
)1
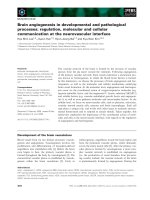
. The respiratory
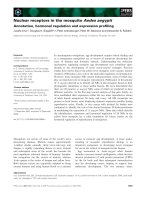
quotient (RQ) of % 1 and the absence of byproducts
indicated a purely oxidative metabolism (Fig. 1A), in
agreement with previous reports [13,14]. From the
65th hour to the end of the culture, the CO
2
produc-
tion rate (rCO
2
) exhibited oscillatory behaviour remi-
niscent of the oscillatory patterns described in aerobic
glucose-limited continuous cultures of S. cerevisiae
[1,6,15]. This similarity became even more striking
when the rCO
2
was converted into specific CO
2
pro-
duction rate (qCO
2
), which is independent of the bio-
mass concentration in the fermentor (Fig. 1C). The
qCO
2
pattern was divided into two regions that
showed different oscillatory properties. In region 1, the
qCO
2
steadily oscillated with a period of 1.8 ± 0.1 h,
around a mean value of % 2 mmolÆg
)1
Æh
)1
with an
amplitude of 1.1 mmolÆg
)1
Æh
)1
. In contrast, the qCO
2
signal gradually damped down over region 2 and
decreased to % 0.5 mmolÆg
)1
Æh
)1
, although the perio-
dicity remained stable (0.8 ± 0.1 h). Interestingly, a
transition in the oscillatory pattern could be observed
Fig. 1. Growth of CEN.PK113-7D in batch
culture on trehalose. (A) RQ. (B) CO
2
production rate (rCO
2
, mmolÆh
)1
). The oscil-
lations started at % 70 h (region 1) and pro-
gressively damped down to end up after
93 h of growth (region 2). (C) CO
2
specific
production rate (qCO
2
, mmolÆg
)1
Æh
)1
)in
regions 1 and 2.
M. Jules et al. Oscillating batch cultures on trehalose
FEBS Journal 272 (2005) 1490–1500 ª 2005 FEBS 1491
between the two regions, with the decline of one oscil-
lation pattern and the onset of the next one with a dif-
ferent frequency. In summary, autonomous oscillations
were identified for the first time during discontinuous,
oxidative growth on trehalose, which could be split
into two different types of consecutive oscillations.
Furthermore, this oscillatory behaviour is probably
due to the low growth rate on trehalose, which is a
consequence of the low rate of trehalose hydrolysis by
the periplasmic acid trehalase, Ath1p [14].
Occurrence of ‘cell-cycle’ and ‘short-period’
oscillations
The overall qCO
2
data from Fig. 1C were subjected to
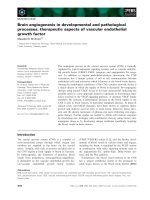
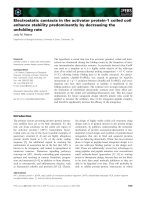
FFT analysis. As shown in Fig. 2A, the periodicity
spectrum exhibits two maxima, one peak at 1.78 h and
a doublet at % 0.8 h, which may reveal the presence of
two different oscillations. A refinement of the mathe-
matical treatment of qCO
2
signal applied independ-
ently to regions 1 (71–81 h) and 2 (83–93 h) showed
that the doublet corresponded to the half-period har-
monic (0.84 h) of the peak at 1.76 h (Fig. 2B) and to a
peak at 0.78 h (Fig. 2C), respectively. Moreover, plot-
ting qCO
2
data from region 1 for six cycles against the
same qCO
2
shifted by p ⁄ 2 gave rise to a kind of limit
circle, which characterizes relatively stable and well-
organized oscillations (Fig. 2D). In contrast, this
graphical representation of qCO
2
data from region 2
showed a damped down spiral trajectory (Fig. 2E).
This behaviour was consistent with both a progressive
decrease in the amplitude and a gradual decrease in
the respiratory activity due to growth arrest (Fig. 1C).
It is worth noting that the FFT analysis of the oxygen
signal was in total agreement with those obtained with
the qCO
2
analysis (Table 1). Interestingly, region 1
was characterized by a constant specific growth rate
(l) close to 0.065 h
)1
, and the period of the oscillation
could be determined as a fraction of the cell doubling
time. On the other hand, the oscillation period in
region 2 was barely affected by the gradual decrease
in the specific growth rate (Table 1). Altogether, this
mathematical analysis confirmed the existence of two
types of oscillations during batch cultures on trehalose.
According to the period and dependence on growth
rate, one type probably corresponded to cell-cycle-rela-
ted oscillations (region 1), and the other to short-term
oscillations (region 2).
Cell-cycle and short-period oscillations can occur
simultaneously
In a previous study, we showed that the trehalose
assimilation in yeast takes place by two independent
pathways. One route relies on the hydrolysis of exo-
genous trehalose by acid trehalase, Ath1p, localized in
the periplasmic space. The second pathway requires
the coupling of the trehalose uptake by a sugar trans-
porter encoded by AGT1 and its intracellular hydroly-
sis by neutral trehalase encoded by NTH1. We found
that elimination of this second route by deletion of
AGT1 or NTH1 resulted in mutant strain that grew
AB C
DE
Fig. 2. Analysis of qCO
2
signal of the
CEN.PK113-7D strain. (A, B and C) Power
spectra from different qCO2 data sets: (A)
overall data from Fig. 1C; (B) region 1; (C)
data from region 2. The period values (in h)
are the maxima (m) from the Gaussian
curves fitting the peaks. (D, E) Phase
portrait diagrams of [qCO
2
] vs. [qCO
2
advanced p ⁄ 2] data obtained from regions 1
(D) and 2 (E).
Oscillating batch cultures on trehalose M. Jules et al.
1492 FEBS Journal 272 (2005) 1490–1500 ª 2005 FEBS
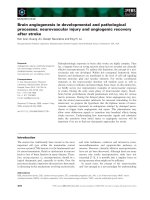
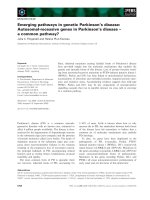
half as fast as the wild-type [14]. This finding was fur-
ther illustrated in Fig. 3, which shows that the agt1
mutant started to grow after a lag phase of % 50 h and
reached a maximal specific growth rate of 0.04 h
)1
.
Interestingly, autonomous oscillations could be recor-
ded almost immediately at the start of growth, with
a peak-to-peak periodicity of 10 ± 2 h (Fig. 3B). In
spite of the fact that the growth was essentially oxida-
tive, the RQ showed sudden and transient bursts over
a value of 1.0, coincidentally with the peak of the
A
B
C
D
Fig. 3. Growth of the agt1 mutant in batch
culture on trehalose. (A) RQ. (B) CO
2
pro-
duction rate (rCO
2
, mmolÆh
)1
). The signal
was partitioned into region 1 (47–89 h),
region 2 (89–125 h) and region 3 (125–
177 h). (C) CO
2
specific production rate
(qCO
2
, mmolÆg
)1
Æh
)1
) over regions 1, 2 and
3. (D) Zoom of CO
2
specific production rate
(3a, delimited area from region 3).
Table 1. Oscillation characteristics in the wild-type and agt1 mutant strains. Periods were calculated using FFT.
Strain Region
Periods from qCO
2
Periods from qO
2
Specific growth
rates, l
max
(h
)1
) *Tg ⁄ cell cycle period
Cell cycle Short-term Cell cycle Short-term
Wild-type Region 1 1.76 No 1.76 No 0.065 ± 0.004 6.04
Region 2 No 0.78 No 0.79 –
a
–
Overall 1.78 0.79 1.78 0.79 0.061 ± 0.008 –
agt1 Region 1 9.50 No
b
9.45 No§ 0.036 ± 0.003 2.03
Region 2 9.28 1.15 ± 0.30 9.27 1.05 ± 0.35 0.039 ± 0.001 1.91
Region 3 11.02 1.20 ± 0.40 11.03 1.25 ± 0.35 0.033 ± 0.004 1.89
Overall 8.70 ⁄ 9.73 1.20 ± 0.40 8.70 ⁄ 9.65 1.20 ± 0.40 0.036 ± 0.004 2.23 ⁄ 2.00
a
Specific growth rate decreasing from 0.065 to 0.055 h
)1
.
b
Not estimated, as the signal was buried in the noise. *Tg, doubling times.
M. Jules et al. Oscillating batch cultures on trehalose
FEBS Journal 272 (2005) 1490–1500 ª 2005 FEBS 1493
oscillations. This transient increase in RQ indicated a
weak deviation of the carbon flow to the fermentation,
although concentrations of acetate or ethanol were
below detection.
Conversion of rCO
2
into the specific evolution rate
of CO
2
even better illustrated the oscillatory dynamics
of the agt1 mutant in batch culture on trehalose,
which was resolved into three main regions (Fig. 3C).
The qCO
2
(as well as qO
2
) signal was subjected to
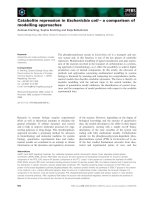
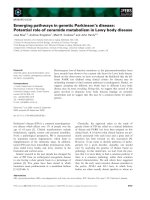
FFT analysis. As indicated in Fig. 4A, the spectrum
from overall qCO
2
data presented a doublet with two
local maxima at 8.70 and 9.73 h, respectively, and a
multitude of harmonics that were not well separated.
This doublet could be interpreted as oscillations
exhibiting two fundamental periodicities, although we
rather believe that it corresponded to a transient shift
in the oscillation period along the growth. When the
qCO
2
signal was studied in separate nonoverlapping
time windows (regions 1–3), sharp fundamental fre-
quencies associated with the oscillation period of the
signal showed up (Fig. 4B, Table 1). As an example,
the spectrum from region 3 showed a parental peak
(11.02 h) and its harmonics (05.51, 03.51 and
02.70 h), together with a multitude of peaks of peri-
ods below 2 h (Fig. 4B). It can be seen in Table 1
that a slight increase in the length of the oscillation
period was correlated with a decrease in the specific
growth rate. As a consequence, one can reasonably
assume that these oscillations are related to the cell
division cycle.
Region 3 (125–160 h) deserves further investigation
because of the presence of an irregular oscillatory pat-
tern composed of very short and unstable periods
(Fig. 3D). As indicated in Fig. 4C, the FFT analysis of
this signal gave rise to a large number of peaks ran-
ging from 0.8 to 1.6 h and their half-period harmonics
(0.4–0.8 h time window). Therefore, a fundamental
periodicity of % 1.20 ± 0.4 h (72 ± 24 min) could be
estimated. This oscillation pattern was also found in
region 2, but not in region 1, largely because the signal
was buried in the noise (Fig. 3C; Table 1). To sum-
marize, batch growth of the agt1 mutant on trehalose
displayed a complex oscillatory pattern that is com-
posed of two distinct types of oscillations. As in the
wild-type, we further consider that one type of oscilla-
tion is related to the cell cycle, and the other could
correspond to clock-controlled ultradian respiratory
oscillations [1,9].
Role of storage carbohydrate and carbon flux
in oscillations
It is well established that oscillating continuous cul-
tures of yeast at low dilution rates are characterized by
periodic changes in cellular content of storage carbo-
hydrates and budding index [15–18]. As shown in
Fig. 5, similar behaviour was also found in the agt1
mutant during batch growth on trehalose. During a
typical oscillatory event (between 160 and 164 h),
A
B
C
Fig. 4. Analysis of qCO
2
signal from the agt1 mutant strain. (A, B)
Power spectra of the overall qCO2 signal presented in Fig. 3C (A)
and Fig. 3D (B). Values of the period (in h) are maxima (m) from the
Gaussian curves fitting the peaks. (C) Zoom of the power spectrum
from (B) corresponding to periods below 2 h.
Oscillating batch cultures on trehalose M. Jules et al.
1494 FEBS Journal 272 (2005) 1490–1500 ª 2005 FEBS
about 37% (of dry mass) of storage carbohydrates
were mobilized, which corresponded to 2.51 mmol
CÆg
)1
(dry mass), i.e. 0.85 mmol CÆg
)1
from trehalose
and 1.66 mmol CÆg
)1
from glycogen. This increase in
carbon flux was closely equivalent to that of the qCO
2
(% 2.37 mmol CÆg
)1
dry mass) measured within the
same time window, and thus, it could account for the
transient increase in RQ during these oscillations
(Fig. 3A). In addition, this transient increase was
accompanied by a transient burst of budding (163–
164 h) (Fig. 5).
In aerobic glucose-limited continuous cultures, the
intracellular glycogen was shown to be important for
both short-period [8] and cell-cycle-related oscillations
[17,19], whereas the importance of trehalose was not
so clear-cut. In this work, we found that these autono-
mous oscillations were not observed in a nth1 mutant
deficient for intracellular trehalose mobilization,
whereas this mutant did show similar macrokinetic
properties to those of an agt1 mutant [14]. As cell-
cycle-related oscillations have been reported to occur
in a range of dilution rates of 0.03–0.15 h
)1
[9,16,19],
the specific growth rate was proposed as another
critical factor for their occurrence and sustainability.
Likewise, in batch cultures on trehalose, oscillatory
dynamics as well as intracellular accumulation of stor-
age carbohydrate were abolished by increasing the
specific growth rate from 0.07 to 0.15 h
)1
(data not
shown). This increase in specific growth rate was
achieved by overexpressing ATH1 which encodes the
periplasmic-localized acid trehalase [14]. Conversely,
deletion of ATH1 resulted in a reduction of specific
growth rate on trehalose below < 0.030 h
)1
, and inter-
estingly, this mutant no longer exhibited oscillations
(data not shown).
Discussion
In this work, we show for the first time the existence
of autonomous oscillations in batch cultures on treha-
lose. This behaviour is similar to what is observed in
aerobic glucose-limited continuous cultures at low dilu-
tion rates (for reviews, see [1,2]). In a previous study
[14], we have shown that the rate-limiting hydrolysis of
trehalose by the periplasmic acid trehalase, Ath1p,
resulted in both obligatory oxidative metabolism and
weak, steady-state glucose flux into the yeast cells. This
situation is therefore comparable to aerobic glucose-
limited chemostat cultures in which the glucose feed
rate is fixed by the dilution rate. Moreover, the oscilla-
tory behaviour in trehalose batch culture was recorded
at growth rates of 0.04–0.15 h
)1
, which remarkably
corresponds to the range of dilution rates in which
autonomous oscillations have been reported in con-
tinuous cultures [9,16,19]. As reviewed by Richard [2]
continuous culture of yeast cells can exhibit two types
of autonomous oscillations: one type is partly related
to the cell cycle, and the other, which is related to a
shorter period, is clock-dependent. These two types of
oscillation were also encountered in batch cultures on
trehalose as discussed below.
The first type of oscillation was characterized by an
oscillatory period, which was 105.6 min (01.76 h) in
the wild-type and % 600 min (% 10 h) in the agt1
Fig. 5. Storage carbohydrate profile during
one typical oscillation. Parameters were
measured during one oscillation period (time
window 158–170 h from Fig. 3C). Intracellu-
lar glycogen (h) and trehalose (n), qO
2
(d)
and qCO
2
(s). The area between dashed
lines corresponds to the burst of budding.
M. Jules et al. Oscillating batch cultures on trehalose
FEBS Journal 272 (2005) 1490–1500 ª 2005 FEBS 1495
mutant strains. These values corresponded to a frac-
tion of the cell doubling times, i.e. one-sixth in the
wild-type and a half in the agt1 mutant. This indicates
that this type of oscillation was probably linked to the
cell cycle [6]. Moreover, as observed in aerobic glu-
cose-limited continuous culture [19], these oscillations
triggered rapid and transient mobilization of storage
carbohydrates which was accompanied by an increase
in the fermentative activity. In conclusion, this type of
oscillatory behaviour is consistent with the model of
Stra
¨
ssle and coworkers [16,17] which described the
integration between cell-cycle-related oscillations,
storage carbohydrate mobilization, and fermentative
activity.
The second type of oscillation, which was also
observed in both wild-type and agt1 mutant strains,
had a shorter period that was independent of the
specific growth rate. Accordingly, the period of the
oscillations in the wild-type remained stable around
47 min (0.79 h), and only the amplitude decreased with
the decline in l that occurred during the growth of the
agt1 mutant. This decrease in the specific growth rate
was mainly attributed to the inactivation process of
the Agt1p trehalose transporter, as reported previously
[14]. Taken together, these criteria are typical of short-
term, so-called ‘respiratory’, oscillations which are cou-
pled to an ultradian clock [9]. Murray et al. [9] showed
that, in continuous cultures, this type of oscillation
had a periodicity of 48 ± 3 min at a specific growth
rate (or dilution rate) of 0.06 h
)1
, and an unstable
periodicity of 67 ± 14 min for l below 0.05 h
)1
.In
our study, similar values were obtained with a stable
period of 47 min for the wild-type (l % 0.065 h
)1
) and
an unstable period of 72 ± 21 min for the agt1
mutant (l % 0.04 h
)1
). Wolf et al. [20] developed a
mathematical model that integrated the critical role of
the sulfate assimilation pathway in the mechanism of
short-term oscillations in chemostat cultures. It would
be interesting to test whether this model can be applied
to the oscillatory events that have been observed in
batch growth on trehalose, and for which their tran-
sient characters reveal rather complex dynamics.
Experiments on oscillating continuous cultures led
to the suggestion that cell-cycle-related and short-term
oscillations cannot occur simultaneously [12,21]. In
contrast with this idea, we found that both types of
oscillation take place either consecutively or simulta-
neously during batch culture on trehalose. In the
wild-type strain, these two oscillatory events were con-
secutive even if they overlapped for a short transition
phase, at the moment when the specific growth rate
fell. This fall may explain the extinction of the cell-
cycle-related oscillations, as the quenching of this type
of oscillation has been shown to occur in chemostat
cultures by decreasing the dilution rate between two
operating points [22]. Alternatively, the period of
short-term oscillations is about half that of the cell
cycle related oscillations, which may lead to phase
interferences. This makes the coexistence of these two
oscillatory events unlikely [12,21]. The coexistence of
the two types of oscillation was nevertheless observed
in batch growth of agt1 mutant on trehalose, probably
because their oscillation periods were very different
(% 70 min vs. % 600 min). Interestingly, Lloyd et al. [1]
pointed out that short-period oscillations are only pre-
sent in continuous cultures of yeast growing under acid
conditions (pH < 4). Otherwise in the pH range 5.0–
6.5, only autonomous cell cycle oscillations have been
observed [15,19,23,24]. The fact that we observed both
types of oscillation may therefore rely on an intermedi-
ate pH value, i.e. 4.75, which is the optimum pH for
trehalose assimilation [14]. Although suboptimal, the
growth on trehalose remains possible in a broader
range of pH (4.8 ± 1.0), and it would be of interest to
test whether lower or higher pH directs the oscillations
towards short-term or cell-cycle types.
Mobilization of glycogen is an important parameter
to sustain both cell-cycle-related [17] and short-term
oscillations [8]. In this work, we observed that cell-
cycle-related oscillations were accompanied by tran-
sient degradation of glycogen and trehalose. However,
we found that a mutant defective in trehalose mobil-
ization did not harbour any oscillatory behaviour dur-
ing growth on trehalose, although it still accumulated
glycogen. This finding not only confirmed the role of
storage carbohydrates in the sustainability of cell-
cycle-related oscillations, but it showed for the first
time that mobilization of trehalose was indispensable
to obtain this type of oscillation under our growth
conditions. Early reports have related cyclic changes in
reserve carbohydrates together with trehalase activity
in phase with budding in chemostat cultures under glu-
cose limitation [25,26]. More recently, a genome-wide
analysis of transcript levels during the cell cycle of
yeast retrieved cycling candidates, including NTH1 and
other genes in the metabolism of reserve carbohydrates
(TSL1, GSY1, GPH1) [27]. Although this global study
did not reveal TPS1 (encoding trehalose-6-phosphate
synthase), more recent work using continuous cultures
showed oscillatory behaviour of TPS1 that is appar-
ently under the control of Gts1p [28]. Interestingly,
this protein was reported to affect the timing of the
budding and cell size of the yeast [24,29] and to stabil-
ize short-term oscillations [30]. As proposed by these
authors, it is possible that the entire metabolome is
co-ordinated to produce the oscillations, and any dele-
Oscillating batch cultures on trehalose M. Jules et al.
1496 FEBS Journal 272 (2005) 1490–1500 ª 2005 FEBS
tion of gene products associated with the central oscil-
lating loop could theoretically be fatal [30]. This is the
case with the key regulator Gts1p. Our results suggest
that the neutral trehalase, and more likely other key
factors from the metabolism of reserve carbohydrates,
may be associated with this putative central oscillating
loop.
Conclusion
In this work, we show that oscillatory dynamics are
not restricted to aerobic glucose-limited continuous
cultures, but can also occur in batch cultures. How-
ever, the general traits that allow the existence of
autonomous oscillations seem to be identical in the
two modes of cultivation. These are (a) oxidative
metabolism and (b) a low glucose feeding rate. The
latter is guaranteed in batch cultures on trehalose by
the rate-limiting periplasmic acid trehalase-dependent
hydrolysis of the disaccharide. Contrary to results
obtained in continuous cultures, the two types of
autonomous oscillation, namely the cell-cycle-related
and short-period oscillations, can coexist in batch cul-
tures on trehalose. Taken together, the use of this
growth condition may be a useful alternative to time-
consuming continuous cultures to further dissect the
molecular mechanisms of autonomous oscillations in
yeast cells.
Experimental procedures
Plasmid and strains
The haploid strain CEN.PK113-7D (MATa MAL2–8
c
SUC2), a prototrophic MAL constitutive strain from
P. Ko
¨
tter (Institute of Microbiology, University of Frank-
furt, Germany [31]), and its auxotrophic ura3_52 leu2 his3
derivative were used as the wild-type and host for transfor-
mation (Table 2). The construction of the mutant strains
(agt1, nth1 and ath1) and pATH1 (URA3 auxotrophic
marker) which bears ATH1 under TDH1 promoter have
been described [14]. The in vitro activity of acid trehalase
was increased by 10–20-fold on transformation of the wild-
type by this plasmid [14].
Shake flask culture conditions
Yeast precultures were routinely prepared in 1-L shake
flasks containing 200 mL YN synthetic medium (yeast
nitrogen base without amino acids; Difco Laboratories
(Sparks, MD, USA); 1.7 gÆL
)1
; plus ammonium sulphate
5gÆL
)1
) containing 2% (w ⁄ v) trehalose as the carbon
source, buffered at pH 4.8 by the addition of 14.3 gÆL
)1
succinic acid and 6 gÆL
)1
NaOH. Growth was followed by
measuring A
600
with an Easyspec IV spectrophotometer
(Safas, Monaco, France). A
600
values were converted into
cell dry mass using a calibration curve established for the
CEN.PK113-7D strain (1 A
600
unit corresponds to 0.41 g
dry cellÆ L
)1
). The maximal specific growth rate (l
max
)of
the cultures was calculated by fitting an exponential regres-
sion over the experimental points [32]. These points were
selected to yield a correlation coefficient (r
2
) higher than
0.998. The l constant from the equation A
600
¼ bexp(lt) is
the maximal specific growth rate.
Batch culture conditions
Batch cultures were performed in 2-L bioreactors (Setric
Genie Industriel, Toulouse, France) with an initial work-
ing volume of 1.5 L of YN medium containing trehalose
2% (w ⁄ v) at pH 4.8 (set by the addition of pure ortho-
phosphoric acid). The temperature was kept constant at
30 °C, and the pH of the medium was maintained at 4.8
by the addition of 2 m NaOH. The dissolved oxygen con-
centration was set above 20% of air saturation in the
liquid phase by using a dry air flow of 10 LÆh
)1
and
variable agitation. Growth was monitored independently
by gas analysis, A
600
, and cell dry mass. After correlating
A
600
with cell dry mass, biomass (X,gÆL
)1
) was used to
calculate the growth rate (dX ⁄ dt, r
x
,gÆL
)1
Æh
)1
) as well as
the specific growth rate (1 ⁄ X · dX ⁄ dt, l,h
)1
). The aver-
age specific growth rate (l
a
,h
)1
) is defined as an average
of l data on the targeted time window and is given with
its expected standard deviation.
Determination of trehalose, glycogen and
extracellular metabolites
Samples (2 mL) were quickly harvested from the fermen-
tor using a syringe, quickly transferred to Eppendorf
tubes, and centrifuged for 2 min at 4000 g. The pellet
was used for glycogen and trehalose determination as
described previously [33]. Storage carbohydrates were
expressed as percentage of dry mass (g storage carbohy-
drate per g dry biomass) or mmol CÆg
)1
(mmol carbon
per g dry biomass). Extracellular trehalose, glucose, acetic
acid, ethanol and other byproducts were measured in the
cell-free supernatant by HPLC using an AminexÒ HPX-
87H column (Bio-Rad Laboratories). The column was
Table 2. Strains used in this work.
Yeast strains Source
CEN.PK113-7D a MAL2-8
c
SUC2 P. Ko
¨
tter [31]
CEN.PK113-1A a MAL2-8
c
SUC2 P. Ko
¨
tter [31]
CEN.PK113-5D a MAL2-8
c
SUC2 HIS3 LEU2 ura3–52 P. Ko
¨
tter [31]
nth1 a MAL2-8
c
SUC2 nth1D::kanMX4 M. Jules [14]
agt1 a MAL2-8
c
SUC2 agt1D::kanMX4 M. Jules [14]
ath1 a MAL2-8
c
SUC2 ath1D::kanMX4 M. Jules [14]
M. Jules et al. Oscillating batch cultures on trehalose
FEBS Journal 272 (2005) 1490–1500 ª 2005 FEBS 1497
eluted at 48 °C with 5 mm H
2
SO
4
at a flow rate of
0.5 mLÆmin
)1
. Concentrations of these compounds were
determined by using a Waters model 410 refractive index
detector.
Other analytical procedures
Online estimation of O
2
,CO
2
, and N
2
molar fractions of
inlet and exhaust gases was performed by MS (PRIMA
600S; VG gas, Manchester, UK) with a relative accuracy of
0.1%. Rates of gas consumption or production (rO
2
and
rCO
2
in mmolÆh
)1
) were used for the calculation of the res-
piratory quotient (RQ, where RQ ¼ rO
2
⁄ rCO
2
). Specific
rates of gas consumption or production (qO
2
and qCO
2
in
mmolÆg
)1
Æh
)1
) were used for oscillatory dynamic analysis
and periodicity determination.
Computational methods
Analysis of biological oscillatory dynamics were performed
using FFT, a robust method used to characterize the fre-
quency spectrum of the underlying process [11]. Exhaust
gaseous data (i.e. qCO
2
) were treated with xnumbers.xla
software (version 3.0, October 2003), which is an Excel
add-in (xla) consisting of a set of hundreds of mathematical
functions. Among these, the DFSP function corresponds to
the so-called ‘Fourier spectrum’ which leads to the periodic-
ity (1 ⁄ frequency) of the oscillatory phenomenon.
As biological data are not continuous but discrete, the
FFT analysis usually leads to an under-sampled distribu-
tion through the period axis and therefore to an approxi-
mate periodicity determination. A better estimation of the
periodicity can be obtained by fitting on this FFT distribu-
tion a Gaussian curve with weighting to centralized points
using the following equation:
y ¼ y
0
e
À
ðxÀlÞ
2
2r
2
where, x is the period, l the ‘mean’ or period of the phenom-
enon under investigation, r
2
the variance, y the amplitude,
and y
0
the amplitude of the mean. As an example, Fig. 6
shows the FFT analysis of an oscillatory phenomenon, which
is the sum of two sine functions [y ¼ sin (3x ⁄ 2) + sin x] the
theoretical periods of which are P
1
¼ 3p ⁄ 2 (4.189 h) and
P
2
¼ 2p (6.283 h), respectively (vertical lines, Fig. 6A). Two
peaks can be visualized on the graph, one at % 4.215 h corres-
ponding to the period of sin (3x ⁄ 2), and the second between
6.117 and 6.476 h and corresponding to the period of sin x .
For the second peak (Fig. 6B), any Gaussian estimation of
the peak’s maximum approximates the theoretical period P
2
(2p). Therefore, this method applied to the above equation
reduces the period’s error to 1%. When applied to our biolo-
gical data, this method led to an accuracy for the periodicity
of > 95%. To examine the stability of oscillations, we
embedded the time series (qCO
2
and qO
2
) data in a two-
dimensional space: [qCO
2
]¢ (¼ qCO
2
data advanced p ⁄ 2) vs.
[qCO
2
]. This will align as a closed trajectory if the data have
periodicity [24,30,34] (Fig. 2D).
Acknowledgements
This work was supported in part by the Microbiology
and Pathogenicity program of the French Ministry of
Education. M.J. was supported by a doctoral grant
from the French Ministry of Education and Research.
We also thank Lutz Brush and Sergei Sokol for their
help with the fast Fourier transform.
References
1 Lloyd D, Lemar KM, Salgado EJ, Gould TM &
Murray DB (2003) Respiratory oscillations in yeast:
Fig. 6. Power spectrum of the equation y ¼ sin (3x ⁄ 2) + sin x.
(A) FFT of two discrete data sets, the first with 1000 points (h)
and the second with 2000 points (e), over a 100 h time window.
Vertical lines cross the x-axis at the theoretical periods of the two
sinusoids from the equation P
1
¼ 3p ⁄ 2 (4.189 h) and P
2
¼ 2p
(6.283 h). Other values on the figure (expressed in h) are those
obtained from FFT of the equation. (B) The values of the periods
(in hours) are the maxima (m) of the Gaussian fitting curves drawn
from points a, b, c (e, plain line); b, c, d (e, dashed line) or e, f, g
(h, dashed line).
Oscillating batch cultures on trehalose M. Jules et al.
1498 FEBS Journal 272 (2005) 1490–1500 ª 2005 FEBS
mitochondrial reactive oxygen species, apoptosis and
time; a hypothesis. FEMS Yeast Res 3, 333–339.
2 Richard P (2003) The rhythm of yeast. FEMS Microbiol
Rev 27, 547–557.
3 Patnaik PR (2003) Oscillatory metabolism of Saccharo-
myces cerevisiae: an overview of mechanisms and mod-
els. Biotechnol Adv 21, 183–192.
4 Dano S, Sorensen PG & Hynne F (1999) Sustained
oscillations in living cells. Nature 402, 320–322.
5 Poulsen AK, Lauritsen FR & Folke Olsen L (2004) Sus-
tained glycolytic oscillations: no need for cyanide.
FEMS Microbiol Lett 236, 261–266.
6 Beuse M, Bartling R, Kopmann A, Diekmann H &
Thoma M (1998) Effect of the dilution rate on the mode
of oscillation in continuous cultures of Saccharomyces
cerevisiae. J Biotechnol 61, 15–31.
7 Keulers M, Satroutdinov AD, Suzuki T & Kuriyama H
(1996) Synchronization affector of autonomous short-
period-sustained oscillation of Saccharomyces cerevisiae.
Yeast 12, 673–682.
8 Satroutdinov AD, Kuriyama H & Kobayashi H (1992)
Oscillatory metabolism of Saccharomyces cerevisiae in
continuous culture. FEMS Microbiol Lett 77, 261–267.
9 Murray DB, Roller S, Kuriyama H & Lloyd D (2001)
Clock control of ultradian respiratory oscillation found
during yeast continuous culture. J Bacteriol 183, 7253–
7259.
10 Lloyd D (2003) Effects of uncoupling of mitochondrial
energy conservation on the ultradian clock-driven oscil-
lations in Saccharomyces cerevisiae continuous culture.
Mitochondrion 3, 139–146.
11 Birol G, Zamamiri AQ & Hjortso A (2000) Frequency
analysis of autonomously oscillating yeast cultures.
Process Biochem 35, 1085–1091.
12 Beuse M, Kopmann A, Diekmann H & Thoma M
(1999) Oxygen, pH values, and carbon source induced
changes of the mode of oscillation in Synchronous con-
tinuous culture of Saccharomyces cerevisiae. Biotechnol
Bioeng 63, 410–417.
13 Malluta EF, Decker P & Stambuk BU (2000) The Kluy-
ver effect for trehalose in Saccharomyces cerevisiae.
J Basic Microbiol 40, 199–205.
14 Jules M, Guillou V, Francois J & Parrou JL (2004)
Two distinct pathways for trehalose assimilation in the
yeast Saccharomyces cerevisiae. Appl Environ Microbiol
70, 2771–2778.
15 Duboc P, Marison I & von Stockar U (1996) Physiol-
ogy of Saccharomyces cerevisiae during cell cycle oscilla-
tions. J Biotechnol 51, 57–72.
16 Stra
¨
ssle C, Sonnleitner B & Fiechter A (1989) A predic-
tive model for the spontaneous synchronization of
Saccharomyces cerevisiae grown in continuous culture.
II. Experimental verification. J Biotechnol 9, 191–208.
17 Stra
¨
ssle C, Sonnleitner B & Fiechter A (1988) A predic-
tive model for the spontaneous synchronization of Sac-
charomyces cerevisiae grown in continuous culture. I.
Concept. J Biotechnol 7, 299–317.
18 Mu
¨
ller D, Exler S, Aguilera-Va
´
zquez L, Guerrero-Mart-
ı
´
n S & Reuss M (2003) Cyclic AMP mediates the cell
cycle dynamics of energy metabolism in Saccharomyces
cerevisiae. Yeast 20, 351–367.
19 Munch T, Sonnleitner B & Fiechter A (1992) The deci-
sive role of the Saccharomyces cerevisiae cell cycle beha-
viour for dynamic growth characterization. J Biotechnol
22, 329–351.
20 Wolf J, Sohn HY, Heinrich R & Kuriyama H (2001)
Mathematical analysis of a mechanism for autonomous
metabolic oscillations in continuous culture of Saccharo-
myces cerevisiae. FEBS Lett 499, 230–234.
21 Keulers M, Suzuki T, Satroutdinov AD & Kuriyama H
(1996) Autonomous metabolic oscillation in continuous
culture of Saccharomyces cerevisiae grown on ethanol.
FEMS Microbiol Lett 142, 253–258.
22 Zamamiri AQ, Birol G & Hjortso A (2001) Multiple
stable states and hysteresis in continuous, oscillating
cultures of budding yeast. Biotechnol Bioeng 75, 305–
312.
23 Schena M, Freedman LP & Yamamoto KR (1989)
Mutations in the glucocorticoid receptor zinc finger
region that distinguish interdigitated DNA binding and
transcriptional enhancement activities. Genes Dev 3,
1590–1601.
24 Akiyama S & Tsurugi K (2003) The GTS1 gene product
facilitates the self-organization of the energy metabolism
oscillation in the continuous culture of the yeast Sac-
charomyces cerevisiae. FEMS Microbiol Lett 228, 105–
110.
25 Kuenzi MT & Fiechter A (1969) Changes in carbohy-
drate composition and trehalase-activity during the bud-
ding cycle of Saccharomyces cerevisiae. Arch Microbiol
64, 396–407.
26 Van Doorn J, Scholte ME, Postma PW, Van Driel R &
van Dam K (1988) Regulation of trehalase activity dur-
ing the cell cycle of Saccharomyces cerevisiae. J Gen
Microbiol 134, 785–790.
27 Spellman PT, Sherlock G, Zhang MQ, Iyer VR,
Anders K, Eisen MB, Brown PO, Botstein D &
Futcher B (1998) Comprehensive identification of cell
cycle-regulated genes of the yeast Saccharomyces cerevi-
siae by microarray hybridization. Mol Biol Cell 9,
3273–3297.
28 Xu Z, Yaguchi S & Tsurugi K (2004) Gts1p stabilizes
oscillations in energy metabolism by activating the tran-
scription of TPS1 encoding trehalose-6-phosphate
synthase 1 in the yeast Saccharomyces cerevisiae. Bio-
chem J 383, 171–178.
29 Mitsui K, Yaguchi S & Tsurugi K (1994) The GTS1
gene, which contains a Gly-Thr repeat, affects the tim-
ing of budding and cell size of the yeast Saccharomyces
cerevisiae. Mol Cell Biol 14, 5569–5578.
M. Jules et al. Oscillating batch cultures on trehalose
FEBS Journal 272 (2005) 1490–1500 ª 2005 FEBS 1499
30 Adams CA, Kuriyama H, Lloyd D & Murray DB
(2003) The Gts1 protein stabilizes the autonomous oscil-
lator in yeast. Yeast 20, 463–470.
31 van Dijken JP, Bauer J, Brambilla L, Duboc P, Franc-
ois JM, Gancedo C, Giuseppin ML, Heijnen JJ, Hoare
M, Lange HC et al. (2000) An interlaboratory compar-
ison of physiological and genetic properties of four Sac-
charomyces cerevisiae strains. Enzyme Microb Technol
26, 706–714.
32 Parrou JL, Enjalbert B, Plourde L, Bauche A, Gonzalez
B & Franc¸ ois J (1999) Dynamic responses of reserve
carbohydrate metabolism under carbon and nitrogen
limitations in Saccharomyces cerevisiae. Yeast 15, 191–
203.
33 Parrou JL & Franc¸ ois J (1997) A simplified procedure
for a rapid and reliable assay of both glycogen and tre-
halose in whole yeast cells. Anal Biochem 248, 186–188.
34 Hans MA, Heinzle E & Wittmann C (2003) Free intra-
cellular amino acid pools during autonomous oscilla-
tions in Saccharomyces cerevisiae. Biotechnol Bioeng 82,
143–151.
Oscillating batch cultures on trehalose M. Jules et al.
1500 FEBS Journal 272 (2005) 1490–1500 ª 2005 FEBS