Báo cáo khoa học: "Learning From Collective Human Behavior to Introduce Diversity in Lexical Choice" potx
Bạn đang xem bản rút gọn của tài liệu. Xem và tải ngay bản đầy đủ của tài liệu tại đây (262.92 KB, 11 trang )
Proceedings of the 49th Annual Meeting of the Association for Computational Linguistics, pages 1098–1108,
Portland, Oregon, June 19-24, 2011.
c
2011 Association for Computational Linguistics
Learning From Collective Human Behavior to
Introduce Diversity in Lexical Choice
Vahed Qazvinian
Department of EECS
University of Michigan
Ann Arbor, MI
Dragomir R. Radev
School of Information
Department of EECS
University of Michigan
Ann Arbor, MI
Abstract
We analyze collective discourse, a collective
human behavior in content generation, and
show that it exhibits diversity, a property of
general collective systems. Using extensive
analysis, we propose a novel paradigm for de-
signing summary generation systems that re-
flect the diversity of perspectives seen in real-
life collective summarization. We analyze 50
sets of summaries written by human about the
same story or artifact and investigate the diver-
sity of perspectives across these summaries.
We show how different summaries use vari-
ous phrasal information units (i.e., nuggets) to
express the same atomic semantic units, called
factoids. Finally, we present a ranker that em-
ploys distributional similarities to build a net-
work of words, and captures the diversity of
perspectives by detecting communities in this
network. Our experiments show how our sys-
tem outperforms a wide range of other docu-
ment ranking systems that leverage diversity.
1 Introduction
In sociology, the term collective behavior is used to
denote mass activities that are not centrally coordi-
nated (Blumer, 1951). Collective behavior is dif-
ferent from group behavior in the following ways:
(a) it involves limited social interaction, (b) mem-
bership is fluid, and (c) it generates weak and un-
conventional norms (Smelser, 1963). In this paper,
we focus on the computational analysis of collective
discourse, a collective behavior seen in interactive
content contribution and text summarization in on-
line social media. In collective discourse each in-
dividual’s behavior is largely independent of that of
other individuals.
In social media, discourse (Grosz and Sidner,
1986) is often a collective reaction to an event. One
scenario leading to collective reaction to a well-
defined subject is when an event occurs (a movie is
released, a story occurs, a paper is published) and
people independently write about it (movie reviews,
news headlines, citation sentences). This process of
content generation happens over time, and each per-
son chooses the aspects to cover. Each event has
an onset and a time of death after which nothing is
written about it. Tracing the generation of content
over many instances will reveal temporal patterns
that will allow us to make sense of the text gener-
ated around a particular event.
To understand collective discourse, we are inter-
ested in behavior that happens over a short period
of time. We focus on topics that are relatively well-
defined in scope such as a particular event or a single
news event that does not evolve over time. This can
eventually be extended to events and issues that are
evolving either in time or scope such as elections,
wars, or the economy.
In social sciences and the study of complex sys-
tems a lot of work has been done to study such col-
lective systems, and their properties such as self-
organization (Page, 2007) and diversity (Hong and
Page, 2009; Fisher, 2009). However, there is little
work that studies a collective system in which mem-
bers individually write summaries.
In most of this paper, we will be concerned with
developing a complex systems view of the set of col-
lectively written summaries, and give evidence of
1098
the diversity of perspectives and its cause. We be-
lieve that out experiments will give insight into new
models of text generation, which is aimed at model-
ing the process of producing natural language texts,
and is best characterized as the process of mak-
ing choices between alternate linguistic realizations,
also known as lexical choice (Elhadad, 1995; Barzi-
lay and Lee, 2002; Stede, 1995).
2 Prior Work
In summarization, a number of previous methods
have focused on diversity. (Mei et al., 2010) in-
troduce a diversity-focused ranking methodology
based on reinforced random walks in information
networks. Their random walk model introduces the
rich-gets-richer mechanism to PageRank with rein-
forcements on transition probabilities between ver-
tices. A similar ranking model is the Grasshopper
ranking model (Zhu et al., 2007), which leverages
an absorbing random walk. This model starts with
a regular time-homogeneous random walk, and in
each step the node with the highest weight is set
as an absorbing state. The multi-view point sum-
marization of opinionated text is discussed in (Paul
et al., 2010). Paul et al. introduce Compar-
ative LexRank, based on the LexRank ranking
model (Erkan and Radev, 2004). Their random walk
formulation is to score sentences and pairs of sen-
tences from opposite viewpoints (clusters) based on
both their representativeness of the collection as well
as their contrastiveness with each other. Once a lex-
ical similarity graph is built, they modify the graph
based on cluster information and perform LexRank
on the modified cosine similarity graph.
The most well-known paper that address diver-
sity in summarization is (Carbonell and Goldstein,
1998), which introduces Maximal Marginal Rele-
vance (MMR). This method is based on a greedy
algorithm that picks sentences in each step that are
the least similar to the summary so far. There are
a few other diversity-focused summarization sys-
tems like C-LexRank (Qazvinian and Radev, 2008),
which employs document clustering. These papers
try to increase diversity in summarizing documents,
but do not explain the type of the diversity in their in-
puts. In this paper, we give an insightful discussion
on the nature of the diversity seen in collective dis-
course, and will explain why some of the mentioned
methods may not work under such environments.
In prior work on evaluating independent contri-
butions in content generation, Voorhees (Voorhees,
1998) studied IR systems and showed that rele-
vance judgments differ significantly between hu-
mans but relative rankings show high degrees of sta-
bility across annotators. However, perhaps the clos-
est work to this paper is (van Halteren and Teufel,
2004) in which 40 Dutch students and 10 NLP re-
searchers were asked to summarize a BBC news re-
port, resulting in 50 different summaries. Teufel
and van Halteren also used 6 DUC
1
-provided sum-
maries, and annotations from 10 student participants
and 4 additional researchers, to create 20 summaries
for another news article in the DUC datasets. They
calculated the Kappa statistic (Carletta, 1996; Krip-
pendorff, 1980) and observed high agreement, indi-
cating that the task of atomic semantic unit (factoid)
extraction can be robustly performed in naturally oc-
curring text, without any copy-editing.
The diversity of perspectives and the unprece-
dented growth of the factoid inventory also affects
evaluation in text summarization. Evaluation meth-
ods are either extrinsic, in which the summaries are
evaluated based on their quality in performing a spe-
cific task (Sp
¨
arck-Jones, 1999) or intrinsic where the
quality of the summary itself is evaluated, regardless
of any applied task (van Halteren and Teufel, 2003;
Nenkova and Passonneau, 2004). These evaluation
methods assess the information content in the sum-
maries that are generated automatically.
Finally, recent research on analyzing online so-
cial media shown a growing interest in mining news
stories and headlines because of its broad appli-
cations ranging from “meme” tracking and spike
detection (Leskovec et al., 2009) to text summa-
rization (Barzilay and McKeown, 2005). In sim-
ilar work on blogs, it is shown that detecting top-
ics (Kumar et al., 2003; Adar et al., 2007) and sen-
timent (Pang and Lee, 2004) in the blogosphere can
help identify influential bloggers (Adar et al., 2004;
Java et al., 2006) and mine opinions about prod-
ucts (Mishne and Glance, 2006).
1
Document Understanding Conference
1099
3 Data Annotation
The datasets used in our experiments represent two
completely different categories: news headlines, and
scientific citation sentences. The headlines datasets
consist of 25 clusters of news headlines collected
from Google News
2
, and the citations datasets have
25 clusters of citations to specific scientific papers
from the ACL Anthology Network (AAN)
3
. Each
cluster consists of a number of unique summaries
(headlines or citations) about the same artifact (non-
evolving news story or scientific paper) written by
different people. Table 1 lists some of the clusters
with the number of summaries in them.
ID type Name Story/Title #
1 hdl miss Miss Venezuela wins miss universe’09 125
2 hdl typhoon Second typhoon hit philippines 100
3 hdl russian Accident at Russian hydro-plant 101
4 hdl redsox Boston Red Sox win world series 99
5 hdl gervais “Invention of Lying” movie reviewed 97
· · · · · · · · ·
25 hdl yale Yale lab tech in court 10
26 cit N03-1017 Statistical Phrase-Based Translation 172
27 cit P02-1006 Learning Surface Text Patterns 72
28 cit P05-1012 On-line Large-Margin Training 71
29 cit C96-1058 Three New Probabilistic Models 66
30 cit P05-1033 A Hierarchical Phrase-Based Model 65
· · · · · · · · ·
50 cit H05-1047 A Semantic Approach to Recognizing 7
Table 1: Some of the annotated datasets and the number
of summaries in each of them (hdl = headlines; cit = cita-
tions)
3.1 Nuggets vs. Factoids
We define an annotation task that requires explicit
definitions that distinguish between phrases that rep-
resent the same or different information units. Un-
fortunately, there is little consensus in the literature
on such definitions. Therefore, we follow (van Hal-
teren and Teufel, 2003) and make the following dis-
tinction. We define a nugget to be a phrasal infor-
mation unit. Different nuggets may all represent
the same atomic semantic unit, which we call as a
factoid. In the following headlines, which are ran-
domly extracted from the redsox dataset, nuggets
are manually underlined.
red sox win 2007 world series
boston red sox blank rockies to clinch world series
2
news.google.com
3
/>boston fans celebrate world series win; 37 arrests re-
ported
These 3 headlines contain 9 nuggets, which rep-
resent 5 factoids or classes of equivalent nuggets.
f
1
: {red sox, boston, boston red sox}
f
2
: {2007 world series, world series win, world series}
f
3
: {rockies}
f
4
: {37 arrests}
f
5
: {fans celebrate}
This example suggests that different headlines on
the same story written independently of one an-
other use different phrases (nuggets) to refer to the
same semantic unit (e.g., “red sox” vs. “boston” vs.
“boston red sox”) or to semantic units corresponding
to different aspects of the story (e.g., “37 arrests” vs.
“rockies”). In the former case different nuggets are
used to represent the same factoid, while in the latter
case different nuggets are used to express different
factoids. This analogy is similar to the definition of
factoids in (van Halteren and Teufel, 2004).
The following citation sentences to Koehn’s work
suggest that a similar phenomenon also happens in
citations.
We also compared our model with pharaoh (Koehn et al,
2003).
Koehn et al (2003) find that
phrases longer than three words improve per-
formance little.
Koehn et al (2003) suggest limiting phrase length
to three words or less.
For further information on these parameter settings,
confer (koehn et al, 2003).
where the first author mentions “pharaoh” as a
contribution of Koehn et al, but the second and third
use different nuggets to represent the same contribu-
tion: use of trigrams. However, as the last citation
shows, a citation sentence, unlike news headlines,
may cover no information about the target paper.
The use of phrasal information as nuggets is an es-
sential element to our experiments, since some head-
line writers often try to use uncommon terms to re-
fer to a factoid. For instance, two headlines from the
redsox cluster are:
Short wait for bossox this time
Soxcess started upstairs
1100
Following these examples, we asked two anno-
tators to annotate all 1, 390 headlines, and 926 ci-
tations. The annotators were asked to follow pre-
cise guidelines in nugget extraction. Our guidelines
instructed annotators to extract non-overlapping
phrases from each headline as nuggets. Therefore,
each nugget should be a substring of the headline
that represents a semantic unit
4
.
Previously (Lin and Hovy, 2002) had shown that
information overlap judgment is a difficult task for
human annotators. To avoid such a difficulty, we
enforced our annotators to extract non-overlapping
nuggets from a summary to make sure that they are
mutually independent and that information overlap
between them is minimized.
Finding agreement between annotated well-
defined nuggets is straightforward and can be cal-
culated in terms of Kappa. However, when nuggets
themselves are to be extracted by annotators, the
task becomes less obvious. To calculate the agree-
ment, we annotated 10 randomly selected head-
line clusters twice and designed a simple evalua-
tion scheme based on Kappa
5
. For each n-gram,
w, in a given headline, we look if w is part of any
nugget in either human annotations. If w occurs
in both or neither, then the two annotators agree
on it, and otherwise they do not. Based on this
agreement setup, we can formalize the κ statistic
as κ =
Pr(a)−Pr(e)
1−Pr(e)
where P r(a) is the relative ob-
served agreement among annotators, and P r(e) is
the probability that annotators agree by chance if
each annotator is randomly assigning categories.
Table 2 shows the unigram, bigram, and trigram-
based average κ between the two human annotators
(Human1, Human2). These results suggest that
human annotators can reach substantial agreement
when bigram and trigram nuggets are examined, and
has reasonable agreement for unigram nuggets.
4 Diversity
We study the diversity of ways with which human
summarizers talk about the same story or event and
explain why such a diversity exists.
4
Before the annotations, we lower-cased all summaries and
removed duplicates
5
Previously (Qazvinian and Radev, 2010) have shown high
agreement in human judgments in a similar task on citation an-
notation
Average κ
unigram bigram trigram
Human1 vs. Human2
0.76 ± 0.4 0.80 ± 0.4 0.89 ± 0.3
Table 2: Agreement between different annotators in terms
of average Kappa in 25 headline clusters.
10
0
10
1
10
2
10
−2
10
−1
10
0
Pr(X ≥ c)
c
headlines
Pr(X ≥ c)
10
0
10
1
10
2
10
−2
10
−1
10
0
Pr(X ≥ c)
c
citations
Pr(X ≥ c)
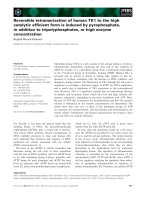
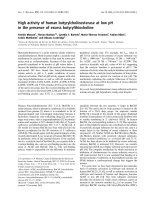
Figure 1: The cumulative probability distribution for the
frequency of factoids (i.e., the probability that a factoid
will be mentioned in c different summaries) across in
each category.
4.1 Skewed Distributions
Our first experiment is to analyze the popularity of
different factoids. For each factoid in the annotated
clusters, we extract its count, X, which is equal to
the number of summaries it has been mentioned in,
and then we look at the distribution of X. Fig-
ure 1 shows the cumulative probability distribution
for these counts (i.e., the probability that a factoid
will be mentioned in at least c different summaries)
in both categories.
These highly skewed distributions indicate that a
large number of factoids (more than 28%) are only
mentioned once across different clusters (e.g., “poor
pitching of colorado” in the redsox cluster), and
that a few factoids are mentioned in a large number
of headlines (likely using different nuggets). The
large number of factoids that are only mentioned in
one headline indicates that different summarizers in-
crease diversity by focusing on different aspects of
a story or a paper. The set of nuggets also exhibit
similar skewed distributions. If we look at individ-
ual nuggets, the redsox set shows that about 63
(or 80%) of the nuggets get mentioned in only one
headline, resulting in a right-skewed distribution.
The factoid analysis of the datasets reveals two
main causes for the content diversity seen in head-
lines: (1) writers focus on different aspects of the
story and therefore write about different factoids
1101
(e.g., “celebrations” vs. “poor pitching of col-
orado”). (2) writer use different nuggets to represent
the same factoid (e.g., “redsox” vs. “bosox”). In the
following sections we analyze the extent at which
each scenario happens.
10
0
10
1
10
2
10
3
0
200
400
600
800
1000
number of summaries
Inventory size
headlines
Nuggets
Factoids
10
0
10
1
10
2
10
3
0
50
100
150
200
250
300
350
number of summaries
Inventory size
citations
Nuggets
Factoids
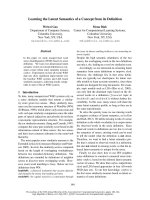
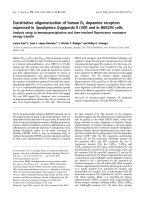
Figure 2: The number of unique factoids and nuggets ob-
served by reading n random summaries in all the clusters
of each category
4.2 Factoid Inventory
The emergence of diversity in covering different fac-
toids suggests that looking at more summaries will
capture a larger number of factoids. In order to ana-
lyze the growth of the factoid inventory, we perform
a simple experiment. We shuffle the set of sum-
maries from all 25 clusters in each category, and then
look at the number of unique factoids and nuggets
seen after reading n
th
summary. This number shows
the amount of information that a randomly selected
subset of n writers represent. This is important to
study in order to find out whether we need a large
number of summaries to capture all aspects of a
story and build a complete factoid inventory. The
plot in Figure 4.1 shows, at each n, the number of
unique factoids and nuggets observed by reading n
random summaries from the 25 clusters in each cat-
egory. These curves are plotted on a semi-log scale
to emphasize the difference between the growth pat-
terns of the nugget inventories and the factoid inven-
tories
6
.
This finding numerically confirms a similar ob-
servation on human summary annotations discussed
in (van Halteren and Teufel, 2003; van Halteren
and Teufel, 2004). In their work, van Halteren and
Teufel indicated that more than 10-20 human sum-
maries are needed for a full factoid inventory. How-
ever, our experiments with nuggets of nearly 2, 400
independent human summaries suggest that neither
the nugget inventory nor the number of factoids will
be likely to show asymptotic behavior. However,
these plots show that the nugget inventory grows at
a much faster rate than factoids. This means that a
lot of the diversity seen in human summarization is
a result of the so called different lexical choices that
represent the same semantic units or factoids.
4.3 Summary Quality
In previous sections we gave evidence for the diver-
sity seen in human summaries. However, a more
important question to answer is whether these sum-
maries all cover important aspects of the story. Here,
we examine the quality of these summaries, study
the distribution of information coverage in them,
and investigate the number of summaries required
to build a complete factoid inventory.
The information covered in each summary can be
determined by the set of factoids (and not nuggets)
and their frequencies across the datasets. For exam-
ple, in the redsox dataset, “red sox”, “boston”, and
“boston red sox” are nuggets that all represent the
same piece of information: the red sox team. There-
fore, different summaries that use these nuggets to
refer to the red sox team should not be seen as very
different.
We use the Pyramid model (Nenkova and Pas-
sonneau, 2004) to value different summary factoids.
Intuitively, factoids that are mentioned more fre-
quently are more salient aspects of the story. There-
fore, our pyramid model uses the normalized fre-
quency at which a factoid is mentioned across a
dataset as its weight. In the pyramid model, the in-
dividual factoids fall in tiers. If a factoid appears in
more summaries, it falls in a higher tier. In princi-
ple, if the term w
i
appears |w
i
| times in the set of
6
Similar experiment using individual clusters exhibit similar
behavior
1102
headlines it is assigned to the tier T
|w
i
|
. The pyra-
mid score that we use is computed as follows. Sup-
pose the pyramid has n tiers, T
i
, where tier T
n
is
the top tier and T
1
is the bottom. The weight of
the factoids in tier T
i
will be i (i.e. they appeared
in i summaries). If |T
i
| denotes the number of fac-
toids in tier T
i
, and D
i
is the number of factoids in
the summary that appear in T
i
, then the total factoid
weight for the summary is D =
n
i=1
i × D
i
. Ad-
ditionally, the optimal pyramid score for a summary
is Max =
n
i=1
i × |T
i
|. Finally, the pyramid score
for a summary can be calculated as
P =
D
Max
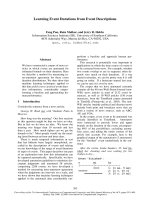
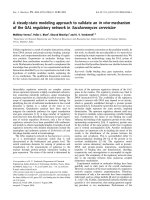
Based on this scoring scheme, we can use the an-
notated datasets to determine the quality of individ-
ual headlines. First, for each set we look at the vari-
ation in pyramid scores that individual summaries
obtain in their set. Figure 3 shows, for each clus-
ter, the variation in the pyramid scores (25th to 75th
percentile range) of individual summaries evaluated
against the factoids of that cluster. This figure in-
dicates that the pyramid score of almost all sum-
maries obtain values with high variations in most of
the clusters For instance, individual headlines from
redsox obtain pyramid scores as low as 0.00 and
as high as 0.93. This high variation confirms the pre-
vious observations on diversity of information cov-
erage in different summaries.
Additionally, this figure shows that headlines gen-
erally obtain higher values than citations when con-
sidered as summaries. One reason, as explained be-
fore, is that a citation may not cover any important
contribution of the paper it is citing, when headlines
generally tend to cover some aspects of the story.
High variation in quality means that in order to
capture a larger information content we need to read
a greater number of summaries. But how many
headlines should one read to capture a desired level
of information content? To answer this question,
we perform an experiment based on drawing random
summaries from the pool of all the clusters in each
category. We perform a Monte Carlo simulation, in
which for each n, we draw n random summaries,
and look at the pyramid score achieved by reading
these headlines. The pyramid score is calculated us-
ing the factoids from all 25 clusters in each cate-
gory
7
. Each experiment is repeated 1, 000 times to
find the statistical significance of the experiment and
the variation from the average pyramid scores.
Figure 4.3 shows the average pyramid scores over
different n values in each category on a log-log
scale. This figure shows how pyramid score grows
and approaches 1.00 rapidly as more randomly se-
lected summaries are seen.
10
0
10
1
10
2
10
3
10
−2
10
−1
10
0
number of summaries
Pyramid Score
headlines
citations
Figure 4: Average pyramid score obtained by reading n
random summaries shows rapid asymptotic behavior.
5 Diversity-based Ranking
In previous sections we showed that the diversity
seen in human summaries could be according to dif-
ferent nuggets or phrases that represent the same fac-
toid. Ideally, a summarizer that seeks to increase di-
versity should capture this phenomenon and avoid
covering redundant nuggets. In this section, we use
different state of the art summarization systems to
rank the set of summaries in each cluster with re-
spect to information content and diversity. To evalu-
ate each system, we cut the ranked list at a constant
length (in terms of the number of words) and calcu-
late the pyramid score of the remaining text.
5.1 Distributional Similarity
We have designed a summary ranker that will pro-
duce a ranked list of documents with respect to the
diversity of their contents. Our model works based
on ranking individual words and using the ranked
list of words to rank documents that contain them.
In order to capture the nuggets of equivalent se-
mantic classes, we use a distributional similarity of
7
Similar experiment using individual clusters exhibit similar
results
1103
0
0.2
0.4
0.6
0.8
1
abortion
amazon
babies
burger
colombia
england
gervais
ireland
maine
mercury
miss
monkey
mozart
nobel
priest
ps3slim
radiation
redsox
russian
scientist
soupy
sweden
typhoon
yale
A00_1023
A00_1043
A00_2024
C00_1072
C96_1058
D03_1017
D04_9907
H05_1047
H05_1079
J04_4002
N03_1017
N04_1033
P02_1006
P03_1001
P05_1012
P05_1013
P05_1014
P05_1033
P97_1003
P99_1065
W00_0403
W00_0603
W03_0301
W03_0510
W05_1203
Pyramid Score
headlines
citations
Figure 3: The 25th to 75th percentile pyramid score range in individual clusters
words that is inspired by (Lee, 1999). We represent
each word by its context in the cluster and find the
similarity of such contexts. Particularly, each word
w
i
is represented by a bag of words,
i
, that have a
surface distance of 3 or smaller to w
i
anywhere in
the cluster. In other words,
i
contains any word that
co-occurs with w
i
in a 4-gram in the cluster. This
bag of words representation of words enables us to
find the word-pair similarities.
sim(w
i
, w
j
) =
i
·
j
|
i
||
j
|
(1)
We use the pair-wise similarities of words in each
cluster, and build a network of words and their simi-
larities. Intuitively, words that appear in similar con-
texts are more similar to each other and will have a
stronger edge between them in the network. There-
fore, similar words, or words that appear in similar
contexts, will form communities in this graph. Ide-
ally, each community in the word similarity network
would represent a factoid. To find the communities
in the word network we use (Clauset et al., 2004), a
hierarchical agglomeration algorithm which works
by greedily optimizing the modularity in a linear
running time for sparse graphs.
The community detection algorithm will assign
to each word w
i
, a community label C
i
. For each
community, we use LexRank to rank the words us-
ing the similarities in Equation 1, and assign a score
to each word w
i
as S(w
i
) =
R
i
|C
i
|
, where R
i
is the
rank of w
i
in its community, and |C
i
| is the number
of words that belong to C
i
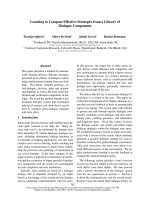
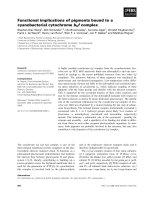
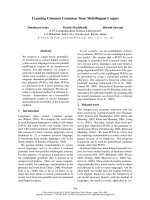
. Figure 5.1 shows part
police
second
sox
celebrations
red
jump
baseball
unhappy
sweeps
pitching
hitting
arrest
victory
title
dynasty
fan
poorer
2nd
poor
glory
Pajek
Figure 5: Part of the word similarity graph in the redsox
cluster
of the word similarity graph in the redsox cluster,
in which each node is color-coded with its commu-
nity. This figure illustrates how words that are se-
mantically related to the same aspects of the story
fall in the same communities (e.g., “police” and “ar-
rest”). Finally, to rank sentences, we define the score
of each document D
j
as the sum of the scores of its
words.
p
ds
(D
j
) =
w
i
∈D
j
S(w
i
)
Intuitively, sentences that contain higher ranked
words in highly populated communities will have a
smaller score. To rank the sentences, we sort them
in an ascending order, and cut the list when its size
is greater than the length limit.
5.2 Other Methods
5.2.1 Random
For each cluster in each category (citations and
headlines), this method simply gets a random per-
1104
mutations of the summaries. In the headlines
datasets, where most of the headlines cover some
factoids about the story, we expect this method to
perform reasonably well since randomization will
increase the chances of covering headlines that fo-
cus on different factoids. However, in the citations
dataset, where a citing sentence may cover no infor-
mation about the cited paper, randomization has the
drawback of selecting citations that have no valuable
information in them.
5.2.2 LexRank
LexRank (Erkan and Radev, 2004) works by first
building a graph of all the documents (D
i
) in a
cluster. The edges between corresponding nodes
(d
i
) represent the cosine similarity between them is
above a threshold (0.10 following (Erkan and Radev,
2004)). Once the network is built, the system finds
the most central sentences by performing a random
walk on the graph.
p(d
j
) = (1 − λ)
1
|D|
+ λ
d
i
p(d
i
)P (d
i
→ d
j
) (2)
5.2.3 MMR
Maximal Marginal Relevance (MMR) (Carbonell
and Goldstein, 1998) uses the pairwise cosine simi-
larity matrix and greedily chooses sentences that are
the least similar to those already in the summary. In
particular,
MM R = arg min
D
i
∈D−A
max
D
j
∈A
Sim(D
i
, D
j
)
where A is the set of documents in the summary,
initialized to A = ∅.
5.2.4 DivRank
Unlike other time-homogeneous random walks
(e.g., PageRank), DivRank does not assume that
the transition probabilities remain constant over
time. DivRank uses a vertex-reinforced random
walk model to rank graph nodes based on a diversity
based centrality. The basic assumption in DivRank
is that the transition probability from a node to other
is reinforced by the number of previous visits to the
target node (Mei et al., 2010). Particularly, let’s as-
sume p
T
(u, v) is the transition probability from any
node u to node v at time T . Then,
p
T
(d
i
, d
j
) = (1 − λ).p
∗
(d
j
) + λ.
p
0
(d
i
, d
j
).N
T
(d
j
)
D
T
(d
i
)
(3)
where N
T
(d
j
) is the number of times the walk has
visited d
j
up to time T and
D
T
(d
i
) =
d
j
∈V
p
0
(d
i
, d
j
)N
T
(d
j
) (4)
Here, p
∗
(d
j
) is the prior distribution that deter-
mines the preference of visiting vertex d
j
. We try
two variants of this algorithm: DivRank, in which
p
∗
(d
j
) is uniform, and DivRank with priors in
which p
∗
(d
j
) ∝ l(D
j
)
−β
, where l(D
j
) is the num-
ber of the words in the document D
j
and β is a pa-
rameter (β = 0.8).
5.2.5 C-LexRank
C-LexRank is a clustering-based model in which
the cosine similarities of document pairs are used to
build a network of documents. Then the the network
is split into communities, and the most salient doc-
uments in each community are selected (Qazvinian
and Radev, 2008). C-LexRank focuses on finding
communities of documents using their cosine simi-
larity. The intuition is that documents that are more
similar to each other contain similar factoids. We ex-
pect C-LexRank to be a strong ranker, but incapable
of capturing the diversity caused by using different
phrases to express the same meaning. The reason is
that different nuggets that represent the same factoid
often have no words in common (e.g., “victory” and
“glory”) and won’t be captured by a lexical measure
like cosine similarity.
5.3 Experiments
We use each of the systems explained above to rank
the summaries in each cluster. Each ranked list is
then cut at a certain length (50 words for headlines,
and 150 for citations) and the information content
in the remaining text is examined using the pyramid
score.
Table 3 shows the average pyramid score achieved
by different methods in each category. The method
based on the distributional similarities of words out-
performs other methods in the citations category. All
methods show similar results in the headlines cate-
gory, where most headlines cover at least 1 factoid
about the story and a random ranker performs rea-
sonably well. Table 4 shows top 3 headlines from
3 rankers: word distributional similarity (WDS), C-
LexRank, and MMR. In this example, the first 3
1105
Method
headlines citations Mean
pyramid 95% C.I. pyramid 95% C.I.
R 0.928 [0.896, 0.959] 0.716 [0.625, 0.807] 0.822
MMR 0.930 [0.902, 0.960] 0.766 [0.684, 0.847] 0.848
LR 0.918 [0.891, 0.945] 0.728 [0.635, 0.822] 0.823
DR 0.927 [0.900, 0.955] 0.736 [0.667, 0.804] 0.832
DR(p) 0.916 [0.884, 0.949] 0.764 [0.697, 0.831] 0.840
C-LR 0.942 [0.919, 0.965] 0.781 [0.710, 0.852] 0.862
WDS 0.931 [0.905, 0.958] 0.813 [0.738, 0.887] 0.872
R=Random; LR=LexRank; DR=DivRank; DR(p)=DivRank with Priors; C-
LR=C-LexRank; WDS=Word Distributional Similarity; C.I.=Confidence In-
terval
Table 3: Comparison of different ranking systems
Method Top 3 headlines
WDS
1: how sweep it is
2: fans celebrate red sox win
3: red sox take title
C-LR
1: world series: red sox sweep rockies
2: red sox take world series
3: red sox win world series
MMR
1:red sox scale the rockies
2: boston sweep colorado to win world series
3: rookies respond in first crack at the big time
C-LR=C-LexRank; WDS=Word Distributional Similarity
Table 4: Top 3 ranked summaries of the redsox cluster
using different methods
headlines produced by WDS cover two important
factoids: “red sox winning the title” and “fans cel-
ebrating”. However, the second factoid is absent in
the other two.
6 Conclusion and Future Work
Our experiments on two different categories of
human-written summaries (headlines and citations)
showed that a lot of the diversity seen in human
summarization comes from different nuggets that
may actually represent the same semantic informa-
tion (i.e., factoids). We showed that the factoids ex-
hibit a skewed distribution model, and that the size
of the nugget inventory asymptotic behavior even
with a large number of summaries. We also showed
high variation in summary quality across different
summaries in terms of pyramid score, and that the
information covered by reading n summaries has a
rapidly growing asymptotic behavior as n increases.
Finally, we proposed a ranking system that employs
word distributional similarities to identify semanti-
cally equivalent words, and compared it with a wide
range of summarization systems that leverage diver-
sity.
In the future, we plan to move to content from
other collective systems on Web. In order to gen-
eralize our findings, we plan to examine blog com-
ments, online reviews, and tweets (that discuss the
same URL). We also plan to build a generation sys-
tem that employs the Yule model (Yule, 1925) to de-
termine the importance of each aspect (e.g. who,
when, where, etc.) in order to produce summaries
that include diverse aspects of a story.
Our work has resulted in a publicly available
dataset
8
of 25 annotated news clusters with nearly
1, 400 headlines, and 25 clusters of citation sen-
tences with more than 900 citations. We believe that
this dataset can open new dimensions in studying di-
versity and other aspects of automatic text genera-
tion.
7 Acknowledgments
This work is supported by the National Science
Foundation grant number IIS-0705832 and grant
number IIS-0968489. Any opinions, findings, and
conclusions or recommendations expressed in this
paper are those of the authors and do not necessarily
reflect the views of the supporters.
References
Eytan Adar, Li Zhang, Lada A. Adamic, and Rajan M.
Lukose. 2004. Implicit structure and the dynamics of
8
/>˜
vahed/
data.html
1106
Blogspace. In WWW’04, Workshop on the Weblogging
Ecosystem.
Eytan Adar, Daniel S. Weld, Brian N. Bershad, and
Steven S. Gribble. 2007. Why we search: visualiz-
ing and predicting user behavior. In WWW’07, pages
161–170, New York, NY, USA.
Regina Barzilay and Lillian Lee. 2002. Bootstrapping
lexical choice via multiple-sequence alignment. In
Proceedings of the ACL-02 conference on Empirical
methods in natural language processing - Volume 10,
EMNLP ’02, pages 164–171.
Regina Barzilay and Kathleen R. McKeown. 2005. Sen-
tence fusion for multidocument news summarization.
Comput. Linguist., 31(3):297–328.
Herbert Blumer. 1951. Collective behavior. In Lee, Al-
fred McClung, Ed., Principles of Sociology.
Jaime G. Carbonell and Jade Goldstein. 1998. The use of
MMR, diversity-based reranking for reordering docu-
ments and producing summaries. In SIGIR’98, pages
335–336.
Jean Carletta. 1996. Assessing agreement on classifi-
cation tasks: the kappa statistic. Comput. Linguist.,
22(2):249–254.
Aaron Clauset, Mark E. J. Newman, and Cristopher
Moore. 2004. Finding community structure in very
large networks. Phys. Rev. E, 70(6).
Michael Elhadad. 1995. Using argumentation in text
generation. Journal of Pragmatics, 24:189–220.
G
¨
unes¸ Erkan and Dragomir R. Radev. 2004. Lexrank:
Graph-based centrality as salience in text summa-
rization. Journal of Artificial Intelligence Research
(JAIR).
Len Fisher. 2009. The Perfect Swarm: The Science of
Complexity in Everyday Life. Basic Books.
Barbara J. Grosz and Candace L. Sidner. 1986. Atten-
tion, intentions, and the structure of discourse. Com-
put. Linguist., 12:175–204, July.
Lu Hong and Scott Page. 2009. Interpreted and
generated signals. Journal of Economic Theory,
144(5):2174–2196.
Akshay Java, Pranam Kolari, Tim Finin, and Tim Oates.
2006. Modeling the spread of influence on the blogo-
sphere. In WWW’06.
Klaus Krippendorff. 1980. Content Analysis: An Intro-
duction to its Methodology. Beverly Hills: Sage Pub-
lications.
Ravi Kumar, Jasmine Novak, Prabhakar Raghavan, and
Andrew Tomkins. 2003. On the bursty evolution of
blogspace. In WWW’03, pages 568–576, New York,
NY, USA.
Lillian Lee. 1999. Measures of distributional similar-
ity. In Proceedings of the 37th annual meeting of the
Association for Computational Linguistics on Compu-
tational Linguistics, pages 25–32.
Jure Leskovec, Lars Backstrom, and Jon Kleinberg.
2009. Meme-tracking and the dynamics of the news
cycle. In KDD ’09: Proceedings of the 15th ACM
SIGKDD international conference on Knowledge dis-
covery and data mining, pages 497–506.
Chin-Yew Lin and Eduard Hovy. 2002. Manual and au-
tomatic evaluation of summaries. In ACL-Workshop
on Automatic Summarization.
Qiaozhu Mei, Jian Guo, and Dragomir Radev. 2010. Di-
vrank: the interplay of prestige and diversity in infor-
mation networks. In Proceedings of the 16th ACM
SIGKDD international conference on Knowledge dis-
covery and data mining, pages 1009–1018.
Gilad Mishne and Natalie Glance. 2006. Predicting
movie sales from blogger sentiment. In AAAI 2006
Spring Symposium on Computational Approaches to
Analysing Weblogs (AAAI-CAAW 2006).
Ani Nenkova and Rebecca Passonneau. 2004. Evaluat-
ing content selection in summarization: The pyramid
method. Proceedings of the HLT-NAACL conference.
Scott E. Page. 2007. The Difference: How the Power of
Diversity Creates Better Groups, Firms, Schools, and
Societies. Princeton University Press.
Bo Pang and Lillian Lee. 2004. A sentimental educa-
tion: sentiment analysis using subjectivity summariza-
tion based on minimum cuts. In ACL’04, Morristown,
NJ, USA.
Michael Paul, ChengXiang Zhai, and Roxana Girju.
2010. Summarizing contrastive viewpoints in opin-
ionated text. In Proceedings of the 2010 Conference
on Empirical Methods in Natural Language Process-
ing, pages 66–76.
Vahed Qazvinian and Dragomir R. Radev. 2008. Scien-
tific paper summarization using citation summary net-
works. In COLING 2008, Manchester, UK.
Vahed Qazvinian and Dragomir R. Radev. 2010. Identi-
fying non-explicit citing sentences for citation-based
summarization. In Proceedings of the 48th Annual
Meeting of the Association for Computational Linguis-
tics, pages 555–564, Uppsala, Sweden, July. Associa-
tion for Computational Linguistics.
Neil J. Smelser. 1963. Theory of Collective Behavior.
Free Press.
Karen Sp
¨
arck-Jones. 1999. Automatic summarizing:
factors and directions. In Inderjeet Mani and Mark T.
Maybury, editors, Advances in automatic text summa-
rization, chapter 1, pages 1 – 12. The MIT Press.
Manfred Stede. 1995. Lexicalization in natural language
generation: a survey. Artificial Intelligence Review,
(8):309–336.
Hans van Halteren and Simone Teufel. 2003. Examin-
ing the consensus between human summaries: initial
experiments with factoid analysis. In Proceedings of
1107
the HLT-NAACL 03 on Text summarization workshop,
pages 57–64, Morristown, NJ, USA. Association for
Computational Linguistics.
Hans van Halteren and Simone Teufel. 2004. Evaluating
information content by factoid analysis: human anno-
tation and stability. In EMNLP’04, Barcelona.
Ellen M. Voorhees. 1998. Variations in relevance judg-
ments and the measurement of retrieval effectiveness.
In SIGIR ’98: Proceedings of the 21st annual interna-
tional ACM SIGIR conference on Research and devel-
opment in information retrieval, pages 315–323.
G. Udny Yule. 1925. A mathematical theory of evo-
lution, based on the conclusions of dr. j. c. willis,
f.r.s. Philosophical Transactions of the Royal Society
of London. Series B, Containing Papers of a Biological
Character, 213:21–87.
Xiaojin Zhu, Andrew Goldberg, Jurgen Van Gael, and
David Andrzejewski. 2007. Improving diversity in
ranking using absorbing random walks. In Human
Language Technologies 2007: The Conference of the
North American Chapter of the Association for Com-
putational Linguistics; Proceedings of the Main Con-
ference, pages 97–104.
1108