Measuring Efficiency of a Supply Chain pdf
Bạn đang xem bản rút gọn của tài liệu. Xem và tải ngay bản đầy đủ của tài liệu tại đây (178.09 KB, 18 trang )
Measuring Efficiency of a Supply Chain -I
by Prabir Jana, Prof. A.S. Narag and Dr. Alistair Knox
December 2007
The two part article is based on doctoral research by Prabir Jana at Nottingham Trent
University, UK “An Investigation into Indian Apparel and Textile Supply Chain
Networks.” In first part we will discuss about efficiency measurement framework in
Apparel Supply Chain and in second part we will discuss a case study of practically
measuring supply chain efficiency of an apparel manufacturing organization and
associated complications and nuances.
Introduction:
What can’t be measured can’t be improved. Even though Supply Chain Management is
the most talked about topic today, currently no tool is available to measure any
manufacturing organizations’ supply chain efficiency. Unlike productivity and or quality
measurement, where the parameter can be measured objectively and expressed in unit or
ratio, supply chain measurement is currently more of a qualitative statement. Even though
the word ‘performance’ or ‘efficiency’ is often used communicating the same meaning,
measuring the performance or efficiency of an ‘enterprise’ or a ‘supply chain’ conveys
different meaning altogether.
Challenges of Measuring Efficiency of an Apparel Supply Chain
If we define ‘supply chain’ as an extended enterprise then efficiency measurement of a
supply chain will mean efficiency measurement of multiple organizations in
synchronization. One of the major strategic objectives of supply chain planning and
management is to maximize total profit in the chain rather than maximizing profit of an
organization in isolation. The typical adversarial relationship between upstream and
downstream players in the apparel supply chain is still prevalent making the job more
difficult than saying. Can you imagine if the buying organization you are dealing with, is
sharing the profit with you or you have to share your profit and loss with your fabric
supplier! Can you blindly trust your fabric supplier that the fabric developed for you will
not be shown to another apparel manufacturer? Information that potentially influence the
bottomline of an organization is kept so confidential, no trust, or partnership can
penetrate that. It is not impossible, but difficult and not yet common in marketplace.
What Are The Measurement Systems Available?
A variety of measurement approaches that have been developed and traditionally used for
measuring supply chain performance (Lapide 1999). Apart from the wildly popularized
Balanced Scorecard, there are other measurement approaches like Supply Chain
1
Council’s SCOR Model, the Logistics Scoreboard, Activity-Based Costing (ABC) and
Economic Value Analysis (EVA).
Balanced Scorecards
Balanced Scorecard (BSC) was developed by Robert S. Kaplan and David P. Norton in
1992 (Kaplan et el 1992). BSC recommends use of executive information systems (EIS)
that track a limited number of balanced metrics based on the following four perspectives:
financial, customer, internal process, and learning and growth, which are closely aligned
to strategic objectives.
Financial perspective (e.g., cost of manufacturing and cost of warehousing) Customer
perspective (e.g., on-time delivery and order fill rate) Internal business perspective (e.g.,
manufacturing adherence-to-plan and forecast errors) Innovative and learning perspective
(e.g., APICS-certified employees and new product development cycle time)
While BSC is popular among several industry segments and considered most balanced
measurement of possible parameters, application of BSC in contract apparel
manufacturing is not suitable because organizations are secretive about financial data,
customer perspective is out of bound and innovative and learning perspective is virtually
missing in majority. That leaves out only internal business perspective.
The Supply Chain Council’s SCOR Model
The Supply Chain Council (SCC) was set up between 1996 and 1997, with members
representing most industries and global geographies, including BASF, Bayer, Colgate-
Palmolive, Lucent technologies, Procter & Gamble, Unilever and Siemens, as well as
consulting organisations. The SCC designed SCOR model, which is designed and
maintained to support supply chains of various complexities and across multiple
industries. It spans all customer interactions (order entry through paid invoice), all
physical material transactions (supplier’s supplier to customer’s customer, including
equipment, supplies, spare parts, bulk product and software) and all market transactions
(from understanding of aggregate demand to the fulfillment of each order).
This model is finally adopted to develop the measurement framework, and will be
discussed in detail in part II of this article.
The Logistics Scoreboard
Another approach to measure supply chain performance was developed around logistical
measures like
Logistics financial performance measures (e.g., expenses and return on assets) Logistics
productivity measures (e.g., orders shipped per hour and transport container utilization)
Logistics quality measures (e.g., inventory accuracy and shipment damage ) Logistics
cycle time measures (e.g., in transit time and order entry time)
This method was developed by Logistics Resources International Inc. (Atlanta, GA), a
consulting firm specializing primarily in the logistical (i.e., warehousing and
2
transportation) aspects of a supply chain. The company sells a spreadsheet-based,
educational tool called The Logistics Scoreboard that companies can use to pilot their
supply chain performance measurement processes. The Logistics Scoreboard is
prescriptive and actually recommends the use of a specific set of supply chain
performance measures. These measures, however, are skewed toward logistics, having
limited focus on measuring the production and procurement activities within a supply
chain.
This approach is more suitable for logistics service providers and none of the measures
are in direct relevance to contract manufacturing
Activity Based Costing
Activity based costing (ABC) is an accounting methodology that assigns costs to
activities rather than products or services. This was developed to overcome some of the
shortcomings of traditional accounting methods in tying financial measures to operational
performance. The method involves breaking down activities into individual tasks or cost
drivers, while estimating the resources (i.e., time and costs) needed for each one. Costs
are then allocated based on these cost drivers rather than on traditional cost-accounting
methods, such as allocating overhead either equally or based on less-relevant cost drivers.
This approach allows one to better assess the true productivity and costs of a supply chain
process. From operational perspective ABC method highlights benefits through lower
cost, improve quality and reduced manufacturing cycle time (Agarwal and Manjul 2005).
For example, use of the ABC method can allow companies to more accurately assess the
total cost of servicing a specific customer or the cost of marketing a specific product.
ABC analysis does not replace traditional financial accounting, but rather a post mortem
on past orders that provides a better understanding of supply chain performance by
looking at the same numbers in a different way and helps better aligning the metrics
closer to actual labor, material, and equipment usage.
This method can be used for post mortem of cost incurred on different orders that are
executed. A case study of a garment manufacturer exporter (Agarwal and Manjul 2005)
shows that cost calculated using ABC analysis was 27% to 31% higher compared to cost
estimated traditionally using absorption costing. While labour cost is the highest
component across all departments namely, sewing, cutting and sampling, it is as high as
90% in sewing and 50-53% in sampling. As this method does not measure any other
parameters related to time, quality and output oriented functions, so it is not a holistic
approach to supply chain performance measure.
Economic Value Analysis
One of the criticisms of traditional accounting is that it focuses on short-term financial
results like profits and revenues, providing little insight into the success of an enterprise
towards generating long term value to its shareholders – thus, relatively unrelated to the
long-term prosperity of a company. For example, a company can report many profitable
quarters, while simultaneously disenfranchising its customer base by not applying
adequate resources towards product quality or new product innovation. To correct this
deficiency in traditional methods, some financial analysts advocate estimating a
3
company’s return on capital or economic value-added. These are based on the premise
that shareholder value is increased when a company earns more than its cost of capital.
One such measure, EVA, developed by Stern, Stewart & Co., attempts to quantify value
created by an enterprise, basing it on operating profits in excess of capital employed
(through debt and equity financing). These types of metrics can be used to measure an
enterprise’s value added contributions within a supply chain. However, while useful for
assessing higher level executive contributions and long term shareholder value,
economic-value added metrics are less useful for measuring detailed supply chain
performance. They can be used, however, as the supply chain metrics within an
executive-level performance scorecard, and can be included in the measures
recommended as part of The Logistics Scoreboard approach.
This measurement method is long term financial health oriented. While majority of the
manufacturing organizations are self financed and balance sheets are not public,
Economic Value Analysis is not possible for such organizations.
What measurement approach is right for apparel manufacturers?
In a platter full of so many options it is obviously difficult for apparel manufacturers to
select the right approach. While listing a comprehensive list of supply chain measures
Lapide noted (lapide 2000) that most performance measurement systems are functionally
focused. For example SCOR model is a typical function based supply chain performance
measure, often lead to functional silos and conflicting functional goals. A balanced
supply chain measurement system should cover function based, process based, cross
enterprise and alignment of executives to management level measures. Measuring
performance in a department as though it operates in a vacuum can have a negative effect
on other departments—and on the bottom line (Barnard 2000).
We have first highlighted the measurement parameters in the following table from a
clothing manufacturer’s perspective. While almost all manufacturing related measures are
theoretically measurable by a manufacturer, only selected measures are possible in
customer service, logistics and sales related parameters. It is of pertinent importance to
understand the secrecy and confidentiality issues perceived by every typical manufacturer
working as CMT supplier or fully-factored clothing supplier to any high street retailer in
EU or US. An organization of $ 25 million turnover is typically self financed and the
operational efficiency horizon for such manufacturer spans between order receipts till
goods trucked out of factory. The objective was to develop easy and simple metrics to
measure such organization’s supply chain efficiency. After a thorough investigation of all
measures SCORE model was selected for final adaptation. Last, but not the least the
measurement parameters are chosen based on the functional link between upstream and
down stream players in the supply chain and not merely in house functions of an apparel
manufacturer.
Table: Lists of Possible Supply Chain Measures
4
Customer Service Measures Process, Cross-Functional
Measures
Purchasing Related
Measures
Order Fill Rate
Line Item Fill Rate
Quantity Fill Rate
Backorders/stockouts
Customer satisfaction
% Resolution on first
customer call
Customer returns
Order track and trace
performance
Customer disputes
Order entry accuracy
Order entry times
Forecast accuracy
Percent perfect orders
New product time-to-market
New product time-to-first
make
Planning process cycle time
Schedule changes
Material inventories
Supplier delivery
performance
Material/component quality
Material stockouts
Unit purchase costs
Material acquisition costs
Expediting activities
Extended Enterprise
Measures
Manufacturing Related
Measures
Logistic Related Measures
Total landed cost
Point of consumption product
availability
Total supply chain inventory
Retail shelf display
Channel inventories
EDI transactions
Percent of demand/supply on
VMI/CRP
Percent of customers sharing
forecasts
Percent of suppliers getting
shared forecast
Supplier inventories
Internet activity to
suppliers/customers
Percent automated tendering
Product quality
WIP inventories
Adherence-to-schedule
Yields
Cost per unit produced
Setups/Changeovers
Setup/Changeover costs
Unplanned stockroom issues
Bill-of-materials accuracy
Routing accuracy
Plant space utilization
Line breakdowns
Plant utilization
Warranty costs
Source-to-make cycle time
Percent scrap/rework
Material usage variance
Overtime usage
Production cycle time
Manufacturing productivity
Master schedule stability
Finished goods inventory
turns
Finished goods inventory
days of supply
On-time delivery
Lines picked/hour
Damaged shipments
Inventory accuracy
Pick accuracy
Logistics cost
Shipment accuracy
On-time shipment
Delivery times
Warehouse space utilization
End-of-life inventory
Obsolete inventory
Inventory shrinkage
Cost of carrying inventory
Documentation accuracy
Transportation costs
Warehousing costs
Container utilization
Truck cube utilization
In-transit inventories
5
Premium freight charges
Warehouse receipts
Administration/Financial
Measures
Marketing Related
Measures
Other Measures
Cash flow
Income
Revenues
Return on capital employed
Cash-to-cash cycle time
Return on investment
Revenue per employee
Invoice errors
Return on assets
Market share
Percent of sales from new
products
Time-to-market
Percent of products
representing 80% of sales
Repeat versus new customer
sales
APICS trained personnel
Patents awarded
Employee turnover
Number of employee
suggestions
Source: Lapide 1999
Developing efficiency measurement framework in Apparel Supply Chain
Supply chain efficiency measurement framework is developed in terms of efficiency
shown by the chain with respect to key functional parameters spanning four different
operation domains namely source, plan, make and deliver. There are about five primary
key performance indicators (KPI) identified in each operation domain and some primary
KPI have multiple secondary KPIs to measure. Each KPI is expressed in percentage.
Once all KPI are measured, weighted averages of all KPI would indicate the overall
supply chain efficiency of the organization. While a 100 percent supply chain efficiency
index would mean perfect organization, there is a possibility of any organization having
KPI value more than 100 percent.
Operation domain KPI’s
Source
1) Inward Material Quality
2) Quantity and Timely Delivery
3) Procurement Unit Cost
4) Material Inventory Level
6
5) Vendor Development Capability
Plan
1) Adherence to Production Target
2) Sample Conversion Rate
3) Material Utilization
4) Cost Adherence
5) Planned T&A v/s Actual T&A
Make
1) Capacity Utilization
2) Production Cost Efficiency
3) Quality Capability
4) Change Over Time
5) Operator Training Effectiveness
Deliver
1) On Time Shipment
2) Order Fulfillment
3) Claims and Discounts
4) Quality at Delivery
5) Transit time
Conclusion
7
It is obvious from above parameters that all KPI neither have equal weight in final
measurement nor all KPI are equally important for all organizations. Organizations can
decide priorities and weight at their will to finally arrive at the supply chain efficiency of
an organization as a whole. In next part we will discuss how the above measurement
parameters were used in a pilot case study.
Measuring Efficiency of a Supply Chain -II
by Sharad Diwan, Prabir Jana, Prof. A.S. Narag and Dr. Alistair Knox
December 2007
The two part article is based on doctoral research by Prabir Jana at Nottingham Trent
University, UK “An Investigation into Indian Apparel and Textile Supply Chain
Networks.” In first part we have discussed about need and development of efficiency
measurement framework in Apparel Supply Chain and in this second part we will discuss
how to calculate each KPI and a case study of practically measuring supply chain
efficiency of an apparel manufacturing organization and associated complications and
nuances.
Introduction:
In part I we have discussed about the genesis and development of a measurement
framework for measuring efficiency of apparel supply chains. Here first we will define
and discuss how to calculate each KPI and then we will discuss a case study where we
have tried to measure the supply chain performance of ABC Enterprise. ABC enterprise
is a $ 15 million enterprise from Northern Capital Region (NCR), India having an ERP
system running.
Source
Under this domain in the supply chain we shall consider the sourcing of raw material and
consumables for manufacturing of the garment i.e. fabric, trims and accessories and
packing material. All the parameters will be considered under three different heads:
fabric, trims and accessories and packaging material.
[1] Inward Material Quality:
This parameter shall evaluate the adherence of quality standards of material received
from vendors to that specified i.e. deviation from the quality levels agreed between the
supplier and the company. Also the material quantity accepted may be equal to the
8
ordered quantity or less. If a lesser quantity is supplied then the penalty will be applied in
the vendor lead times. But if the material received is of required quantity but of inferior
quality then good quality material is accepted after screening. Also if there is some
discrepancy in the quantity stated and actual it will be penalized as case three in this
KPI.
There can be three cases:
1)Quality of material supplied is as per desired standards and 100% material is accepted.
KPI is 100 2)Quality of material supplied is not as per desired standards and 100%
material is rejected. KPI is 0
3)Quality of material supplied is not as per desired standards and material is accepted
fully or partially. KPI is calculated as under
: 99-75% accepted -70 points
: 74-50% accepted -50 points
: 49-25% accepted -30 points
Less than 25% accepted -10 point
Quality parameters shall be considered as a whole for a product and not individual
parameters like fastness, weaving defect etc. However if the company has no quality
policy for sourcing, this KPI shall not be applicable.
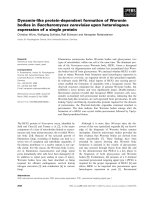
[2] Quantity and Timely Delivery:
This parameter shall evaluate whether the quantity ordered is delivered on time or not for
all the materials mentioned earlier. The time to be considered will be a percentage of the
lead time of the raw material. However in case of late delivery the penalty shall be
according to the % lead time delay and quantity supplied as per matrix below. A
percentage of the lead time is being taken as different materials have lead times varying
from one to sixty days. Only the quantity and time are considered as quality has been
covered in earlier parameter.
The points can be allotted as:
Qty. Rcd.
Time delay
100% 99-75% 74-50% 49-25% >25%
0 % 100 70 50 30 0
Upto 20 % 70 50 30 10 0
21-50 % 50 30 20 0 0
9
>50 % 0 0 0 0 0
< 20% early 30 40 50 70 80
Moreover if the material was ordered in bulk to be delivered in lots, then the quantity will
be taken as cumulative. Higher the KPI, better the efficiency.
[3] Procurement Unit Cost
This parameter shall evaluate the cost incurred to procure the material i.e. the various
costs such as correspondence (e-mail, fax, courier, telephone etc.), conveyance
(transportation cost of personnel involved in procurement), official’s salary, electricity
bills, etc. This can be measured as a ratio between the procurement costs per material to
the cost of the material. The transportation costs of material will also be included in the
material costs and the material costs would thus be costs of material at site. Also costs
incurred in testing of raw material will be added in material cost. (Total procurement
cost / total cost of material procured) x 100 = procurement unit cost. KPI is expressed
as 100 – procurement unit cost. Higher the KPI better the procurement efficiency. Data
is collected over minimum 6 representative months and averaged. It may be noted that
procurement cost incurred in the month of March may arrive at warehouse during April,
so data collected for more number of months will give correct measure of this KPI.
[4] Material Inventory Level
This parameter shall evaluate the stocked inventory level of the company. Higher
inventory level increases the capital investment and also acquires more physical space.
Lower inventory level indicates better sourcing efficiency. The inventory level can be
measured as a ratio of daily requirements in volume terms upon average daily inventory
stock expressed in percentage.
• Issued stock per day = (Monthly Closing stock- Monthly Opening Stock + Total
Received Stock)/ working days
• Stock Held per day = Average daily Opening Stock of the month
This KPI is calculated as Inventory Level Stock Ratio i.e. (Issued Stock per day) /
(Stock Held per day) expressed as percentage. Higher the KPI better the performance.
Data is collected over minimum 6 representative months and averaged.
[5] Vendor Development Capability
This parameter will determine the Sourcing Department’s potential and capability to
assist vendor during the product development or in Order processing. Three types of the
parameters which need to be checked during the product development are Technological
Assistance, Financial Assistance and Timeliness of information and the Extent of
10
information shared for each of the above parameters we need to rate the companies
accordingly.
Rating for this KPI will be on a subjective basis. The extent of fulfillment of the above
three parameters will be judged and rated as below. Point allocation is also as below.
Very Good =100 points, Good = 070 points, Average = 050 points, Below Average = 030
points and no Development = 000 points
All parameters will be rated differently and an average of the points obtained for the three
will give points to be allocated to the KPI.
Plan
The planning function is one of the most important factors in coordination of various pre
production, production, post production, activities. Planning drives the supply chain. It
orchestrates the flow of materials and resources, getting them to the right location, at the
right time, in the right sequence. Effective planning balances demand and supply, internal
and external objectives, all in a constantly changing environment. Mastering supply chain
planning can provide a major competitive advantage.
[6] Adherence to Production Target
Many times the planned targets are not met due to non availability of raw-material (as
raw-material did not arrive on time) or due to decision pending (like fit-approval delays,
material quality approval delays). This parameter measures actual production
achievement in comparison to planned one. Production achievement is measured in terms
of timely completion and fulfillment of target. This KPI measures daily deviation of
target production for three departments, namely cutting, sewing and finishing and
points are allocated. Cutting schedule is compared with actual cut completion dates and
expressed as percentage. Similarly planned sewing and finishing dates for different styles
are compared with actual. Data is collected over a minimum of 3 representative months
and averaged.
On a scale of 100 points, the points can be allocated as below:
99-75% production (cut, sew or finish) completed -75 points
74-50% production (cut, sew or finish) completed - 50 points
49-25% production (cut, sew or finish) completed - 30 points
less than 25% production (cut, sew or finish) completed - 10 point
Suppose the cutting figure of one month for a company is like below
style
Order
Qty
Cutting
target
Quantity
cut
% completed Points Cut x points
M&S 001 2000 500 500 100 100 50000
11
Bhs 004 1750 400 500 112.5 100 50000
BG 003 1500 500 300 60 50 15000
BR-345 2100 300 100 33.33 30 3000
1400 118000
KPI (cutting target adherence) is (118000) x 100/1400 = 84.28%
Often manufacturers prioritise different customers based on certain parameters, it is
understood that to favour one customer the vendor has to compromise with other
customer. Due to such circumstances while any customer wants to measure true SC
efficiency of any manufacturer the average data over a period of time should be taken
into account and not only data pertaining to specific customers’ orders.
[7] Sample conversion rate.
It is the ratio of the no. of styles where a production order is received upon the no. of
styles sample development was done expressed in percentage. Data is collected over a
minimum of 4 representative seasons and averaged.
[8] Material Utilisation
Material is required at the right time, right quantity and at right price. Material
requirement planning is done by merchandising or planning department and raise a bill of
material. After the material is arrived and consumed its utilization record need to be
compiled to determine accuracy of planning (the quantity parameter). Where material had
arrived of right quantity at right time, its actual utilization percentage is calculated over a
period of 3 months. 100% utilization gets the highest rating and so on. You can cover as
many raw material as possible but as fabric is the prime cost factor, fabric utilization
percentage only will be calculated under this parameter. KPI is calculated as the actual
fabric utilized (for an order) upon the total fabric received (for that order) expressed in
percentage.
[9] Cost Adherence
An order is traditionally cost on two aspects: product and process cost. Costing is done
assuming lot of parameters, like material consumption, labour cost, overhead cost etc.
and apportioning value against each parameter. Due to unforeseen and unavoidable
circumstances actual cost incurred on a order may vary from the planned one. This KPI
is the ratio of planned cost upon the actual cost incurred expressed in percentage. Data
is collected over a minimum 3 representative months and averaged.
[10] Planned T & A Vs actual T & A
12
Once an order is received, T&A calendar is prepared to meet the scheduled delivery date
and also ensure all activities have a start/completion date. Deviation from the planned
date happen due to either inefficiency or incompetence of other departments (e.g.
sourcing delay, low productivity in making etc.) or inaccurate planning. Preproduction is
crucial activity which includes approval related time spent. Iteration time is generally not
planned. This KPI has 4 measurement parameters, namely total iteration time, total
approval time and total preproduction time and delivery lead time.
From the date order received, till the date merchandise being shipped out of the factory
(or merchandise being shipped/aired out of the country) is commonly referred as delivery
lead time. Delivery lead time is the ratio of first (initial) planned lead time upon actual
lead time expressed in percentage. Follow appendix for data compilation.
Make
Manufacturing or commonly known as production activities. This domain consists of
three major departments namely, cutting, sewing and finishing and many sub
departments. While the data pertaining to the sewing department is easily available, data
for other departments is difficult to come by.
[11] Capacity utilization
Capacity utilization can be measured by calculating basic minutes utilized upon basic
minutes available. In basic minutes utilized we multiply the SAM with quantity for the
style produced. Basic minutes available can be calculated by multiplying number of
production personnel present (operators + helpers + in line checkers) by the no. of
minutes they worked in a shift. The KPI is calculated as minutes utilized upon minutes
available, expressed in percentage. Higher the KPI better the capacity utilization.
[12] Production Cost Efficiency
This is basically cost being incurred to run the production, which includes area cost,
machine cost, labour cost & overhead cost. It is expressed as rupees spent (invested) per
basic minute. Production cost per minute is basically value invested per minute (VIM).
Profit margin of product divided by SAM value of the product gives value realized per
minute (VRM). This KPI will be calculated as ratio of value realized per minute upon
value invested per minute expressed in percentage. Data should be collected over 6
months and averaged out.
[13] Quality Capability
Quality is the important key performance indicator. It can be determined by Defect per
Hundred unit (DHU) level. DHU level is the defect per hundred unit calculated at the
final stage of each department. For example, in the cutting department it can be
calculated at the part checking or auditing stage, after the cutting and bundling process.
Similarly in the sewing department it can be calculated at final checking or audited stage,
after the complete sewing of garments from the line. In the finishing department, it can be
13
calculated at final auditing or at final inspection stage. Data collected for 3 months to be
collected and averaged. This KPI can be calculated as (1 / DHU) x 100. The higher the
KPI. the better the quality capability of the organization.
For example, if the production of the sewing department one day is 800, out of which 200
pieces are checked and the DHU is 112, then the KPI is (1/112) x 100 = 0.89 %
[14] Change over Time
Change over of the machinery and equipment results loss of productive time. In garment
manufacturing during style changeover and otherwise, there are different reasons where
change over time should be taken into account. Work aid changeover, machine layout
changeover, style changeover (stitches per inch, thread colour change etc.) allowances
should be calculated and added up. The Change Over Time is calculated as upon
cumulative changeover time upon (total productive time in a shift x number of
machines) expressed in percentage. Thus KPI will be 100 – change over time. Higher
the KPI lesser the change over time and better the company performance. Data collected
over 3 months should be averaged.
For example suppose total productive time in a day (shift hours – breaks) is 500 minutes,
100 machines on the floor and total cumulative changeover time (all types for all
machines are added) is 1000 minutes. KPI is [100 – (1000 x 100)/ (500 x 100)] = 98 %
[15] Operator Training Effectiveness
Here we are calculating the performance of the training cell or effectiveness of operator
training. Operators are trained in the training cell to take care of operator turnover in a
company. The training cell should train a higher number of trainees as practical because
there is fallout of trainees. This parameter is measured as ratio of annual/monthly
trainee incumbent in production floor to annual/monthly operator turnover expressed
in percentage. The higher the KPI, the more effective is the training cell.
For example if annual operator turnover for a company with 480 worker is 50%, then
annually 240 workers need to be replaced. Capacity of training cell is 25 trained
operators per month. On average out of 25 trainee if only 18 chosen to join production
floor per month, then KPI would be 18/20 i.e. 90%
Deliver
Delivery of goods is the last but most important domain of activities. Delivery is only
accomplished when order is of acceptable quality, full quantity is delivered on time up to
customer’s warehouse without drawing any claims and discounts.
[16] On-Time shipment
14
Shipment at the exporter's end is just the delivery of goods. When the P.O is made for an
order, the buyer fixes a favorable date. If these goods are exported by the manufacturer as
per scheduled date then it is termed as on - time shipment. While delay in shipment is of
great concern and dealt with in this parameter, early shipment is also draws a penalty.
This KPI is calculated as (volume or value of orders shipped x weightage points) * 100 /
(total volume/value of orders). Higher the KPI better the on-time shipment performance.
This parameter is measured on a monthly or yearly basis. KPI calculation can be done
either based on volume or value.
[17] Order Fulfillment
For a company, the quantity to be shipped by the manufacturer (as per the Purchase
Order) is the order quantity. If the manufacturer ships the exact quantity, then we call it
as an order fulfilled. But, in case any variation, whether positive or negative is termed as
excess or a short shipment respectively. Both short or excess quantity calls for penalty.
This KPI is calculated as SUM (volume of orders x weightage points) * 100 / (total
volume of orders). Higher the KPI better the order fulfillment efficiency.
KPI = SUM (volume of orders x weightage points) / (total volume of orders)
[18] Claims and Discounts
A claim or discount can be defined as a penalty put on by the buyer on the manufacturer
due no-committal shipment. This may be due to quality related problems, late delivery or
order fulfillment. The penalty faced by the manufacturer is usually decided on value
terms. The cumulative claim/discount amount upon company annual turnover expressed
in percentage will give percentage of discounted goods over total shipment. Data
collected for one year. This KPI measure percentage of non-discounted goods over
total shipment, and is calculated as 100 - percentage of discounted goods over total
shipment. The higher the KPI, the fewer the claims and discounts.
[19] Quality at Delivery
Quality performance is an overall index to measure the capability of a company to churn
out goods right the first time in the right quantity, at the right time and right quality.
Quality at the delivery point is checked and sometimes advised for 100% re-screening.
Data should be collected over 3 months and averaged out. This KPI would be calculated
as actual number of pieces shipped upon cumulative inspection plus re-screening
quantity expressed as percentage. The higher the KPI, the better the quality at delivery
efficiency.
For example, one shipment of 10000 pieces at final inspection (assumes as 100%
inspection), may go for one re-screening of 2000 pieces, before finally shipping out 9800
pieces. The KPI would be 9800 / (10000 + 2000) x 100 = 81.66%
[20] Transit Time
15
It is the time taken to export the goods from the source country (exporting) i.e. from the
time goods are moved out of factory (ex factory) to the warehouse at the destination
country (importing country). The goods are transported either by air or by sea. The less
the transit time, the better the supply chain efficiency. This KPI is calculated as
(1X100)/(transit time in days) expressed in percentage. The higher the KPI, the better
the transit time efficiency.
For example if the transit time for a sea shipment to Europe is 28 days, then this KPI is
3.57. It should however be noted that while comparing this KPI with other organizations,
sea-shipment should not be compared against air-shipment.
Measuring efficiency of ABC Enterprise
The pilot study was undertaken by Sharad Diwan (Diwan 2006) as part of his masters
thesis under the guidance of the researcher. The objective was to test the measurement
framework in practical environment, measurability of each KPI, and data availability and
confidentiality issue in measuring the KPI. The measurement framework was applied to
three manufacturing organizations. In organisation ABC we were able to measure a total
of 13 parameters. Only 7 and 6 parameters were measurable in two other organizations
respectively. Poor and inconsistent record keeping, and confidentiality of information
was the main reason behind not being able to measure all KPI’s.
In absence of any international benchmark about what should be the weight of different
KPI in calculating overall supply chain performance of an organisation, an informal
survey was undertaken among industry experts to weight different KPI on a scale of 1-10
based on their importance. Of total 15 responses average weight was calculated and listed
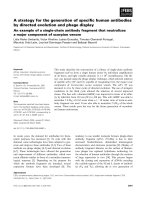
against each KPI. Overall supply chain performance for organisation ABC (Weightage
average for 12 KPI) was 69.77.
Supply Chain Efficiency Measurement
KPI
KPI value Weightage Remark, if any
Source
Inward Material Quality 50 8.53 Even in accepted material there are
a.b.c.d grades, which are not
accounted for
Quantity and Timely
Delivery
70 8.13 Data not available for delay in
delivery, if any
Procurement Unit Cost 83.5 7.87
Material Inventory Level 42.10 6.47
Vendor Development 6.67 Data not available to share
16
Capability
Plan
Adherence to Production
Target
90.05 6.13 Only sewing production measured
Sample Conversion Rate 5.6 Data not available to measure
Material Utilization 8.8 Data not available to measure
Cost Adherence Data not available to measure
Planned T&A v/s Actual
T&A
70.86 5.73 Measured based on planned cut
date schedule
Make
Capacity Utilization 47.78 8.13
Production Cost Efficiency 509* 8.4
Quality Capability 10.11 7.07
Change Over Time 88 4.8
Operator Training
Effectiveness
4.07 Data not available to measure
Deliver
On Time Shipment 96.16 9.07
Order Fulfillment 93.89 8
Claims and Discounts 94.5 7.6
Quality at Delivery 8.27 Data not available to measure
Transit time 5.73 Data not available to measure
* Not considered for calculation
17
As explained earlier, each KPI was designed to be measured out of 100, but out of 13
parameters the value of one KPI, “production cost efficiency” in Make category came in
at 509, which was ignored. On investigation it was found that while calculating the
production cost efficiency KPI, the VIM was only taken for the sewing department, thus
the high KPI. The measurement calculation process needs to be further investigated as it
is understood that the KPI is likely to hover around 200%. It is also important to note that
any organisation may be strong in one area, but weak in other area. For example,
organisation A was found to be strong in plan and deliver with average KPIs of 81 and 95
respectively. The weak area was source and make with average KPIs of 62 and 44
respectively.
Conclusion
While the summarized table shows the utility of these efficiency measurement models, it
is important to note that out of 20 KPI only 12 we were able to be measured. The data
secrecy, data ownership, poor record maintenance, and unauthentic data were the main
reasons behind not all KPI being measurable. It was also realized that computerized data
record maintenance is more reliable and better to retrieve than any manual method of
maintaining registers and files. This measurement process is currently at very nascent
stage of testing for its usefulness and accuracy and relevancy will be clear with more
testing and time.
18