Báo cáo khoa học: Demethylation of radiolabelled dextromethorphan in rat microsomes and intact hepatocytes Kinetics and sensitivity to cytochrome P450 2D inhibitors pot
Bạn đang xem bản rút gọn của tài liệu. Xem và tải ngay bản đầy đủ của tài liệu tại đây (355.73 KB, 10 trang )
Demethylation of radiolabelled dextromethorphan in rat microsomes
and intact hepatocytes
Kinetics and sensitivity to cytochrome P450 2D inhibitors
Annalise Di Marco
1
, Dan Yao
2
and Ralph Laufer
1
1
Department of Pharmacology, Istituto di Ricerche di Biologia Molecolare P. Angeletti (IRBM), Merck Sharp and Dohme
Research Laboratories, Rome, Italy;
2
Labeled Compound Synthesis, Department of Drug Metabolism,
Merck Research Laboratories, Rahway, NJ, USA
Liver microsomal preparations are routinely used to predict
drug interactions that can occur in vivo as a result of inhi-
bition of cytochrome P450 (CYP)-mediated metabolism.
However, the concentration of free drug (substrate and
inhibitor) at its intrahepatic site of action, a variable that
cannot be directly measured, may be significantly different
from that in microsomal incubation systems. Intact cells
more closely reflect the environment to which CYP sub-
strates and inhibitors are exposed in the liver, and it may
therefore be desirable to assess the potential of a drug to
cause CYP inhibition in isolated hepatocytes. The objective
of this study was to compare the inhibitory potencies of a
series of CYP2D inhibitors in rat liver microsomes and
hepatocytes. For this, we developed an assay suitable for
rapid analysis of CYP-mediated drug interactions in
both systems, using radiolabelled dextromethorphan, a
well-characterized probe substrate for enzymes of the
CYP2D family. Dextromethorphan demethylation exhib-
ited saturable kinetics in rat microsomes and hepatocytes,
with apparent K
m
and V
max
values of 2.1 vs. 2.8 l
M
and 0.74 nmolÆmin
)1
per mg microsomal protein vs.
0.11 nmolÆmin
)1
per mg cellular protein, respectively.
Quinine, quinidine, pyrilamine, propafenone, verapamil,
ketoconazole and terfenadine inhibited dextromethorphan
O-demethylation in rat liver microsomes and hepatocytes
with IC
50
values in the low micromolar range. Some of these
compounds exhibited biphasic inhibition kinetics, indicative
of interaction with more than one CYP2D isoform. Even
though no important differences in inhibitory potencies
were observed between the two systems, most inhibitors,
including quinine and quinidine, displayed 2–3-fold
lower IC
50
in hepatocytes than in microsomes. The cell-
associated concentrations of quinine and quinidine were
found to be significantly higher than those in the extracel-
lular medium, suggesting that intracellular accumulation
may potentiate the effect of these compounds. Studies of
CYP inhibition in intact hepatocytes may be warranted for
compounds that concentrate in the liver as the result of
cellular transport.
Keywords: CYP2D; cytochrome P450; hepatocytes; micro-
somes.
The pharmacokinetic and toxicokinetic properties of phar-
maceuticals depend in great part on their biotransformation
by drug-metabolizing enzymes. The main drug-metaboli-
zing system in mammals is cytochrome P450 (CYP), a
family of microsomal isozymes present predominantly in
the liver. Multiple CYPs catalyze the oxidation of chemicals
of endogenous and exogenous origin, including drugs,
steroids, prostanoids, eicosanoids, fatty acids, and environ-
mental toxins [1]. If a drug that is metabolized by a
particular CYP isozyme is coadministered with an inhibitor
of that same enzyme, changes in its pharmacokinetics can
occur, which can give rise to adverse effects [2–5]. It is
therefore important to predict and prevent the occurrence of
clearance changes caused by metabolic inhibition. During
the drug discovery process, it has become routine practice
in the pharmaceutical industry to assess CYP inhibition
potential of drug candidates in order to exclude potent
inhibitors from further development [6–8].
The extent of metabolic interaction between two drugs
depends on their relative K
m
and K
i
values and concentra-
tions at the site of metabolism [3]. In recent years,
substantial progress has been made in the development
of in vitro screening methods to quantitatively determine
kinetic parameters of CYP inhibition. Using either recom-
binant CYP proteins or liver microsomes, together with
appropriate probe substrates, these assays can be used to
measure K
i
values for competitive CYP inhibitors [7,9,10]. It
is not entirely clear, however, whether these systems
accurately and quantitatively reflect drug interactions that
occur in vivo. One possible drawback of recombinant
enzymes is that inhibitory potency may depend on inter-
actions with multiple CYPs present in the microsomal, but
not recombinant, systems. The intracellular concentration
of drugs (substrates and inhibitors) that is available for
interacting with a particular CYP may also depend on
Correspondence to R. Laufer, IRBM P. Angeletti, Via Pontina km
30,600, 00040 Pomezia (Roma), Italy.
Fax: + 39 0691093 654, Tel.: + 39 0691093 440,
E-mail:
Abbreviation: CYP, cytochrome P450.
(Received 5 June 2003, revised 11 July 2003,
accepted 22 July 2003)
Eur. J. Biochem. 270, 3768–3777 (2003) Ó FEBS 2003 doi:10.1046/j.1432-1033.2003.03763.x
processes lacking in microsomes, such as drug transport
across the plasma membrane, metabolism by cytosolic
enzymes, and binding to intracellular proteins. Intact cells
more closely reflect the environment to which CYP
substrates and inhibitors are exposed in the liver, and it
may therefore be desirable to assess the potential of a drug
to cause CYP inhibition in isolated hepatocytes. Isolated
hepatocytes have been used extensively to study drug
metabolism, cytotoxicity, and induction of drug-metaboli-
zing enzymes [11–15]. However, there are few reports of
CYP inhibition studies using this system (see for example
[13,16–18]), probably because of the technical challenge
posed by the lower specific activity of CYP in cultured cells
relative to microsomal preparations.
The objective of this study was to compare the inhibitory
potencies of CYP inhibitors in microsomes and hepatocytes.
We developed an assay suitable for rapid analysis of
CYP-mediated drug interactions in both systems, using
radiolabelled dextromethorphan, a well-characterized probe
substrate for enzymes of the CYP2D family.
Materials and methods
Materials
[O-methyl-
14
C]Dextromethorphan (61 mCiÆmmol
)1
) was
synthesized at Merck Research Laboratories, Rahway,
NJ,USA.[
3
H]Quinine and [
3
H]quinidine were purchased
from American Radiolabeled Chemicals. [
3
H]Taurocholic
acid was from Perkin–Elmer Life Sciences, and [
14
C]for-
maldehyde and [
14
C]formic acid were from Amersham
Biosciences. Cell culture media were purchased from Gibco-
BRL, and chemicals from Sigma. 96-well Oasis
TM
HLB
extraction plates and vacuum mannifold were purchased
from Waters.
Preparation of rat liver microsomes
Liver microsomes were prepared from male Sprague–
Dawley rats. Livers were homogenized in 1.15% (w/v)
KCl, and the homogenate was centrifuged at 9000 g for
30 min. The S-9 supernatant was centrifuged at 130 000 g
for 1 h. The microsomal pellet was washed, resuspended in
0.15
M
Tris/HCl, pH 7.4, at a protein concentration of
10 mgÆmL
)1
and kept at )80 °C.
Isolation of rat hepatocytes
All animal care and experimental procedures were in
accordance with national and company guidelines. Male
Sprague–Dawley rats weighing 250 g were subjected to
terminal anaesthesia using sodium pentobarbital. Rat
hepatocytes were isolated by a two-step collagenase per-
fusion method [19]. Cells were frozen in L15 medium
containing 10% fetal calf serum and 15% dimethyl sulfoxide
following the protocol described by Guyomard et al.[20]
and kept in liquid nitrogen until use. After quick thawing at
37 °C, cells were loaded on L15 medium containing 0.75
M
glucose [21] and centrifuged for 1 min at 300 g.Viable
hepatocytes were separated by centrifugation over 30%
Percoll solution for 3 min at 350 g. Cell viability was
determined by Trypan Blue exclusion before freezing and
after thawing and was consistently greater than 90%. The
cells were resuspended in William’s Medium E containing
GlutaMAX
TM
(Ala-Glu), 5 lgÆmL
)1
insulin, 1 l
M
dexa-
methasone, and penicillin/streptomycin, and seeded on
collagen-precoated 24-well culture plates at a density of
100 000 cells per well. Cultures were maintained at 37 °Cin
a humidified atmosphere of 5% CO
2
. Four hours after
plating, the medium was changed as described below.
Separation of [
O-methyl
-
14
C]dextromethorphan
from CYP2D-mediated demethylation products
The CYP2D assay described in this study is based on a
modification of procedures described previously for deter-
mining the activity of various CYP isozymes, including
CYP2D6, in hepatic microsomes [22,23]. CYP-mediated
demethylation of substrates which have the leaving methyl
group radiolabelled with
14
C, yields [
14
C]formaldehyde as
product, which can be isolated using reversed-phase (C8)
extraction cartridges [24]. We adapted this method to
96-well format, and modified the solid-phase matrix using
Oasis extraction plates. Solid-phase extraction was per-
formed using a vacuum mannifold according to the
instructions of the manufacturer. When the radiolabelled
substrate [O-methyl-
14
C]dextromethorphan, dissolved in
either microsomal assay buffer or cell incubation medium,
was applied to 96-well Oasis plates, over 99.7% of
radioactivity was retained on the extraction plate, and
could be recovered by elution with methanol. In contrast,
[
14
C]formaldehyde and [
14
C]formic acid, the products of
CYP-mediated oxidation of [O-methyl-
14
C]dextromethor-
phan, were quantitatively recovered in the combined void
volume and aqueous washing of Oasis extraction plates.
Microsomal CYP2D assays
Microsomal incubations were performed in 96-well conical
plates (Corning). They contained, in a final volume of
100 lL, 0.1
M
potassium phosphate buffer, pH 7.4, 1 l
M
[O-methyl-
14
C]dextromethorphan (% 15 000 d.p.m. per
assay), rat liver microsomes (3 lg), and NADPH-
regenerating system (1 m
M
NADP, 5 m
M
glucose-6-
phosphate, 3 m
M
MgCl
2
,4UÆmL
)1
glucose-6-phosphate
dehydrogenase). After preincubation for 10 min at 37 °Cin
the presence or absence of test compounds, reactions were
started by the addition of the NADPH-regenerating system.
After 15 min, reactions were stopped by the addition of
10 lL1
M
HCl. Plates were centrifuged at 1100 g for 5 min
using a microplate rotor, and supernatants loaded on 30-mg
96-well Waters Oasis extraction plates. The flow-through
was collected and plates were washed twice with 200 lL
water. Aliquots of the combined aqueous eluates were
counted in a Packard TopCount scintillation counter using
24-well scintillation plates. Product formation was totally
dependent on the presence of NADPH and was linear with
time for up to 20 min, and with microsomal protein
concentrationupto1mgÆmL
)1
(data not shown).
Hepatocyte CYP2D assays
CYP2D assays in hepatocytes were performed at 37 °Cin
a humidified atmosphere of 5% CO
2
in 24-well culture
Ó FEBS 2003 CYP2D-mediated drug interactions (Eur. J. Biochem. 270) 3769
plates containing 100 000 cells per well, unless indicated
otherwise. Four hours after plating, cells were incubated
in 500 lL cell incubation medium {hepatocyte culture
medium (HCM [25]), supplemented with ITS + (Colla-
borative Research, Bedford, MA, USA) and 10 m
M
sodium formate, which suppresses the formation of
14
CO
2
from [
14
C]formate in rat hepatocytes [26]}. Plates
were preincubated for 10 min with CYP inhibitors or
vehicle [0.5% (v/v) dimethyl sulfoxide], before addition of
1 l
M
[O-methyl-
14
C]dextromethorphan (% 80 000 d.p.m.
per assay). Reactions were stopped after 15 min by
addition of 50 lL1
M
HCl, and cell lysates were
centrifuged in a tabletop centrifuge at high speed for
10 min. The supernatants were loaded on 30-mg 96-well
Waters Oasis extraction plates and processed as described
above for the microsomal assays, except that extraction
plates were washed three times with 250 lLwater.
Uptake of drugs into rat hepatocytes
Uptake of radiolabelled quinine, quinidine, and taurocholic
acid into rat hepatocytes was determined at 37 °Cin250 lL
per well of a solution containing 116 m
M
NaCl, 5.3 m
M
KCl, 1.1 m
M
KH
2
PO
4
,0.8m
M
MgSO
4
,1.8m
M
CaCl
2
,
10 m
M
glucose, and 10 m
M
Hepes, pH 7.4. Some experi-
ments were performed in sodium-free buffer containing
choline chloride instead of NaCl. Incubations with 5 l
M
[
3
H]quinine or [
3
H]quinidine were carried out for 1, 2, 3, 5,
and 10 min in the presence or absence of 2 l
M
carbonyl
cyanide p-trifluoromethoxyphenylhydrazone. Incubations
with 1 l
M
[
3
H]taurocholic acid were performed for 20, 40,
60, 120, and 300 s in the presence or absence of extracellular
Na
+
. Plates were then washed 3 times with 1 mL ice-cold
buffer, cells were lysed with 0.1
M
NaOH, and radioactivity
was determined by scintillation counting. Cell-associated
radioactivity for [
3
H]quinine and [
3
H]quinidine reached
steady-state levels after 10 min (data not shown). Results
were corrected for radioactivity associated with cells at time
zero, and expressed as cell/medium concentration ratio
(C/M) at steady state, using an estimated intracellular
volume of 4 lLÆ(10
6
cells)
)1
[27]. [
3
H]Taurocholate uptake
was linear for up to 2 min (data not shown). Uptake
clearance was calculated by dividing the initial
uptake velocity by the substrate concentration.
Determination of drug binding to hepatic proteins
For the determination of the liver tissue binding of
[
3
H]quinine and [
3
H]quinidine, rat liver was homogenized
in 0.1
M
potassium phosphate buffer and dialyzed against
the same buffer for 12 h at 4 °C to remove coenzymes. The
compounds were mixed with tissue homogenates (10, 20
and 30%, w/v) or rat liver microsomes (0.03 mgÆmL
)1
) at
concentrations of 1 or 10 l
M
, and incubated at 37 °Cfor
30 min. Reaction tubes were then centrifuged in a tabletop
centrifuge for 20 min at high speed, and the supernatants
were loaded on Centrifree ultrafiltration devices (Millipore)
to separate the unbound fractions. Non-specific adsorption
of [
3
H]quinine to the filters was prevented by precoating
using unlabelled quinine (1 m
M
). The fraction not bound to
liver proteins (f
u
) was calculated according to the following
equation [28]:
f
u
¼ C
f
=½C
f
þð100=n  C
b
Þ ð1Þ
where C
f
is unbound drug in ultrafiltrate, C
b
is bound
drug, and n is the percentage of liver homogenate.
Biochemical assays
Protein was determined by the Bradford assay (Bio-Rad)
using BSA as standard. Lactate dehydrogenase activity was
determined in hepatocyte cell suspensions before plating,
and in monolayers 4 h after plating, using a colorimetric
method (Cytotoxicity detection kit; Roche Diagnostics).
ATP content of cell monolayers was determined after cell
extraction with 1.7% (w/v) trichloroacetic acid using
luciferase/luciferin reagent (Sigma) and luminescent pro-
duct detection. The intracellular concentration of ATP
was calculated considering an intracellular volume of
4 lLÆ(10
6
cells)
)1
[27].
Statistical methods
Curve fitting was performed by nonlinear regression
according to the Levenberg-Marquardt algorithm, using
KALEIDAGRAPH
TM
3.52 (Synergy Software, Reading, PA,
USA). Statistical significance was assessed using a two-
tailed Student’s t test.
Results
Viability, metabolic and transport activities
of cryopreserved rat hepatocytes
To assessthe metabolic state ofhepatocytes used inthis study,
we determined cell-attachment efficiency, ATP content, and
Na
+
-dependent taurocholate transport, a typical differenti-
ated hepatocyte function mediated by the sodium taurocho-
late cotransporting polypeptide (NTCP) [29]. The efficiency
of cell attachment, determined by measuring cellular lactate
dehydrogenase activities before and after plating, was
70 ± 6% (n ¼ 2). Intracellular ATP concentrations were
2.3 ± 0.4 m
M
(mean ± SEM, n ¼ 3), which is in close
agreement with previously reported values (2.4 m
M
[30]).
Cells transported [
14
C]taurocholate with an uptake clearance
of 24 ± 2 lLÆmin
)1
per mg cellular protein (n ¼ 2). In the
absence of extracellular Na
+
, uptake clearance was reduced
sevenfold. These values are similar to those previously
reported for Na
+
–taurocholate cotransport in rat hepato-
cytes (V
max
/K
m
¼ 17.5 lLÆmin
)1
Æmg
)1
[29]).
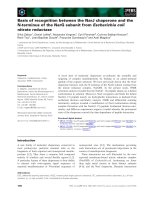
Dextromethorphan O-demethylation in rat hepatocytes
and microsomes
When [O-methyl-
14
C]dextromethorphan was incubated with
rat hepatocytes, radiolabelled reaction product(s) were
produced in a time-dependent and cell-concentration-
dependent manner (Fig. 1). The reaction products were
not retained by Oasis
TM
polymeric reversed-phase sorbent,
similarly to standard [
14
C]formaldehyde and [
14
C]formate
(and unlike the substrate [O-methyl-
14
C]dextromethor-
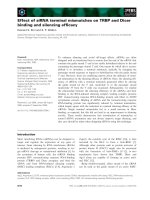
phan). Metabolite formation from [O-methyl-
14
C]dextro-
methorphan in rat hepatocytes increased with substrate
concentration in a saturable manner (Fig. 2A). The reaction
3770 A. Di Marco et al.(Eur. J. Biochem. 270) Ó FEBS 2003
rate as a function of substrate concentration was fitted to
the Hill equation:
v ¼
V
max
 S
n
S
n
50
þ S
n
ð2Þ
where v and V
max
are the observed and maximal rates of
metabolism, S
50
is the substrate concentration at
half V
max
, and n is the Hill coefficient. The values
obtained were S
50
¼ 2.80 ± 0.01 l
M
, V
max
¼ 0.11 ±
0.01 nmolÆmin
)1
per mg cellular protein, and
n ¼ 0.82 ± 0.01. An Eadie–Hofstee plot of these data
was monotonous, with slight deviation from linearity
(Fig. 2A, inset).
For comparison, we also determined the kinetics of
dextromethorphan O-demethylation in rat microsomes
(Fig. 2B). Fitted kinetic constants were S
50
¼ 2.10 ±
0.01 l
M
, V
max
¼ 0.74 ± 0.01 nmolÆmin
)1
per mg micro-
somal protein, and n ¼ 0.88 ± 0.01. Also in this case, the
Eadie–Hofstee plot of these data was monotonous, with
slight deviation from linearity (Fig. 2B, inset).
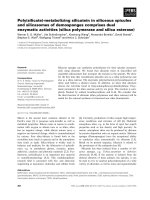
We next examined the effect of isoform-specific CYP
inhibitors on dextromethorphan O-demethylation. As
shown in Fig. 3, the reaction in rat hepatocytes was
inhibited by quinine, which is a known inhibitor of rat
CYP2D [31–33], but not by a-naphthoflavone (inhibitor of
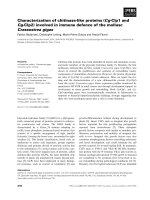
Fig. 1. Time-dependent and cell-concentration-dependent demethylation
of [O-methyl-
14
C]dextromethorphan in rat hepatocytes. Substrate was
incubated with 100 000 cells (circles) or 300 000 cells (squares) and
product formation was determined at the indicated times. Results are
mean ± deviation from duplicate experiments.
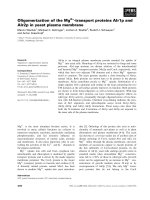
Fig. 2. Kinetics of [O-methyl-
14
C]dextromethorphan demethylation in rat hepatocytes (A) and rat liver microsomes (B). Data were fitted to the Hill
equation as described in Results. Each point is the mean ± deviation from duplicate experiments. Insets: Eadie–Hofstee plots of the data.
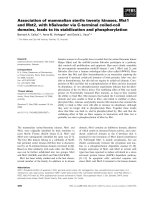
Fig. 3. Effect of CYP inhibitors on [O-methyl-
14
C]dextromethorphan
demethylase activity in rat hepatocytes. Results are expressed as per-
centage enzymatic activity relative to that of the vehicle control.
Inhibitors used were: 1 l
M
a-naphthoflavone (ANF), 10 l
M
sulfa-
phenazole (SPZ), 10 l
M
quinine (QUIN), and 10 l
M
troleandomycin
(TAO). Results are mean ± deviation from duplicate experiments.
Ó FEBS 2003 CYP2D-mediated drug interactions (Eur. J. Biochem. 270) 3771
rat CYP1A1/2 [34]), sulfaphenazole (rat CYP2C11 [35]),
and troleandomycin (rat CYP3A [36]). The selected inhi-
bitor concentrations were based on the above literature
references.
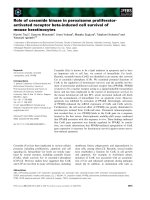
Effect of quinine and quinidine on dextromethorphan
O-demethylation
A characteristic feature of rat CYP2D enzymes is that, in
contrast with the human enzyme, they are inhibited by
quinine more potently than by quinidine [17,31,37]. As
shown in Fig. 4A, quinine was a more potent inhibitor than
quinidine of [O-methyl-
14
C]dextromethorphan O-demethy-
lation in rat hepatocytes. Inhibition curves were fitted to a
four-parameter logistic model:
Y ¼
1
1 þðx=IC
50
Þ
n
ð3Þ
where Y is the fraction of enzyme activity relative to
no-inhibitor controls, X is the concentration of inhi-
bitor, IC
50
the concentration for half-maximal inhibi-
tion, and n the slope factor. The results of the fitting are
summarized in Table 1. Quinine and quinidine had IC
50
values of 0.9 and 4.7 l
M
, respectively. The slope factors
were 0.57 and 0.64, respectively, suggesting interaction
with more than one enzyme or binding site.
Inhibition curves were also fitted to a two-site inhibition
model (Fig. 4):
Y ¼
A
1 þðx=IC
50À1
Þ
þ
1 À A
1 þðx=IC
50À2
Þ
ð4Þ
where Y is the fraction of enzyme activity relative to
no-inhibitor controls, A is the fraction of enzymes with
IC
50-1
, and 1 ) A the fraction of enzymes with IC
50-2
.As
shown in Table 1, correlation coefficients (r) for the
nonlinear regression curve fits using the two-enzyme
model were slightly higher than those for the logistic fits.
Approximately 40% of the enzymatic activity in rat
hepatocytes was inhibited by quinine and quinidine with
high affinity (IC
50-1
0.06 and 0.51 l
M
, respectively), and
Fig. 4. Effect of quinine and quinidine on [O-methyl-
14
C]dextromethorphan demethylase activity. (A) Rat hepatocytes; (B) rat liver microsomes.
Enzymatic activity was determined in the presence of quinine (circles) or quinidine (squares), and results were expressed as percentage of control
activity in the absence of inhibitor. Data represent mean ± SEM from three to five separate experiments. Curves were fitted to a two-site inhibition
model as described in Results.
Table 1. Kinetic parameters for inhibition of [O-methyl-
14
C]dextromethorphan demethylation by quinine and quinidine in rat liver microsomes and rat
hepatocytes. Inhibition data (Fig. 4) were fitted to a four-parameter logistic model or a two-site inhibition model as described in the text. n,slope
factor; A, fraction of high-affinity sites; IC
50
, concentration that produces 50% inhibition; IC
50-1
,IC
50
for high-affinity sites; IC
50-2
,IC
50
for low-
affinity sites; r, correlation coefficient of the nonlinear regression curve fit. Results are parameter values (± SEM), as calculated by the curve-fitting
software.
Inhibitor
Enzyme
source
Fit type
4-parameter logistic 2 enzymes
r IC
50
nrAIC
50-1
IC
50-2
Quinine Hepatocytes 0.9912 0.9 ± 0.16 0.57 ± 0.05 0.9981 0.40 ± 0.04 0.06 ± 0.02 5.0 ± 1.0
Quinidine Hepatocytes 0.9956 4.7 ± 0.51 0.64 ± 0.04 0.9980 0.41 ± 0.07 0.51 ± 0.18 19.0 ± 4.7
Quinine Microsomes 0.9954 1.7 ± 0.21 0.53 ± 0.03 0.9986 0.45 ± 0.03 0.13 ± 0.03 12.6 ± 2.1
Quinidine Microsomes 0.9980 15.0 ± 0.9 0.72 ± 0.03 0.9976 0.45 ± 0.14 3.3 ± 1.5 48.9 ± 20.4
3772 A. Di Marco et al.(Eur. J. Biochem. 270) Ó FEBS 2003
about 60% with lower affinity (IC
50-2
5 and 19 l
M
,
respectively). Also in rat liver microsomes quinine had a
lower IC
50
than quinidine, and both compounds exhi-
bited slope factors smaller than unity (Fig. 4B and
Table 1). The IC
50
values for quinine and quinidine in
rat liver microsomes were twofold and threefold higher
than in hepatocytes, but this difference was statistically
significant only for quinidine (P < 0.01). When data
were fitted to a two-site inhibition model, relative ratios
of high-affinity and low-affinity binding sites in rat liver
microsomes were similar to those in hepatocytes. Also in
this case, correlation coefficients for the two-enzyme
model curve fits were slightly better than those for the
logistic fits (Table 1). IC
50
values of quinine and
quinidine for both high-affinity and low-affinity binding
sites in rat liver microsomes were between twofold and
threefold higher than the corresponding values in rat
hepatocytes (Table 1), but these differences were not
statistically significant (P > 0.05).
Even though the differences in IC
50
values between
microsomes and hepatocytes were small and for the most
part not significant, there appeared to be a trend towards
lower IC
50
values in intact hepatocytes. This may be due to
differences between the concentrations of free drug available
for enzyme inhibition in the two systems. To test this
hypothesis, we measured the total concentration of quinine
and quinidine in rat hepatocytes, as well as their free (non-
protein-bound) fractions in both microsomes and hepatic
tissue. Both quinine and quinidine accumulated in rat
hepatocytes and reached steady-state concentrations that
were 64-fold and 75-fold higher than their extracellular
concentrations, respectively (Table 2). More than 50% of
the accumulation of quinine and quinidine was inhibited by
ATP depletion using 2 l
M
carbonyl cyanide p-trifluoro-
methoxyphenylhydrazone, suggesting that it was mediated
by active drug transport into the hepatocytes (data not
shown). Cell-associated drugs can bind to tissue proteins,
and only the free fraction may be available for interaction
with microsomal CYP2D. Radiolabelled quinine and
quinidine bound extensively to proteins in rat liver homo-
genates, with free fractions between 0.03 and 0.06 (Table 2).
In contrast, free fractions of both compounds were close to
unity in the rat liver microsome incubation system, consis-
tent with the very low concentration of microsomal protein
(30 lgÆmL
)1
) used in the assay (data not shown). Thus, free
concentrations of quinine and quinidine inside rat hepato-
cytes may not equal those in the extracellular medium, and
IC
50
should be corrected by a factor that takes into account
cellular accumulation and protein binding. The ratio
between the intracellular concentration of free drug
([I]
cell, free
) and that of total drug added to the hepatocyte
culture medium ([I]
medium
) is given by:
½I
cell;free
½I
medium
¼ f
u;cell
xC=M ð5Þ
However, f
u,cell
, the free fraction of drug within the
hepatocyte cytoplasm, cannot be measured experiment-
ally. If this value were similar to the free fraction in liver
homogenate (i.e. f
u,cell
¼ f
u,tissue
), then free drug
concentrations inside hepatocytes would be 2–3-fold
higher than that added to the culture medium.
Inhibition of CYP2D activity
We next investigated the effects of several drugs on
[O-methyl-
14
C]dextromethorphan O-demethylation in rat
microsomes and hepatocytes. As depicted in Fig. 5A and
summarized in Table 3, pyrilamine, propafenone, terfena-
dine, verapamil and ketoconazole inhibited the reaction in
intact hepatocytes with IC
50
values in the micromolar range.
Slope factors (determined by fitting the data to a four-
parameter logistic equation) ranged from 0.5 (pyrilamine)
to 1.1 (propafenone). In rat liver microsomes, IC
50
values
for pyrilamine, propafenone and verapamil were 2–3-fold
higher than in hepatocytes, ketoconazole had comparable
IC
50
values, and terfenadine a slightly lower IC
50
than in
hepatocytes (Fig. 5B and Table 3). This difference between
microsomes and hepatocytes was statistically significant
only for verapamil (P < 0.01). Slope factors for all
compounds were very similar to those obtained in
hepatocytes (Table 3). It was not possible to resolve the
curves for these compounds into two distinct components
using a two-site inhibition model (data not shown).
Discussion
Even though hepatic microsomes represent the most widely
used in vitro system for the study of potential drug
interactions, it has been reported that concentrative uptake
of some CYP inhibitors into the liver can cause drug
interactions in vivo that are more pronounced than those
predicted by inhibitory potency in a microsomal system
[5,28,38,39]. Freshly isolated and cryopreserved hepatocytes
are an important experimental tool for the evaluation of
drug metabolism, hepatotoxicity and induction of drug-
metabolizing enzymes [11–15]. The purpose of the present
study was to use this system to determine the inhibitory
potencies of a series of CYP2D inhibitors and to compare
the results with those obtained in liver microsomes. To this
end, we developed a sensitive assay method suitable for
rapidly assessing the potential of chemical compounds to
inhibit CYP2D enzymes in both systems.
CYP-catalyzed demethylation of substrates which had
the leaving methyl group radiolabelled with
14
C, yielding
[
14
C]formaldehyde as product, has been previously used
Table 2. Accumulation in rat hepatocytes and hepatic protein binding
of quinine and quinidine. Accumulation of quinine and quinidine (5 l
M
)
in rat hepatocytes is expressed as the steady state ratio (C/M) between
cell associated and extracellular drug concentrations. Binding to rat
hepatic proteins was determined at two drug concentrations, 1
and 10 l
M
, and results were expressed as fraction of free drug, f
u
.
To calculate f
u
· C/M, the f
u
for the two drug concentrations was
averaged.
Compound C/M
f
u
f
u
· C/M1 l
M
10 l
M
Quinine 64 0.037 0.056 3.0
Quinidine 75 0.028 0.031 2.2
Ó FEBS 2003 CYP2D-mediated drug interactions (Eur. J. Biochem. 270) 3773
to assay the activity of various CYP isoforms in liver
microsomes [23,24,40,41]. A related method is used to
determine CYP3A4 activity in human subjects in vivo.The
so-called erythromycin breath test measures the disposition
in the breath of
14
CO
2
formed from further oxidation of
[
14
C]formaldehyde, the product of CYP3A4-catalyzed
N-demethylation of [N-methyl-
14
C]erythromycin [42]. Even
though formation of
14
C-labelled formaldehyde, formate
and CO
2
from CYP-mediated N-demethylation of amino-
pyrine in isolated hepatocytes was described over 25 years
ago [43], aminopyrine is not suitable as a substrate for
assaying the activity of specific CYPs, because its
N-demethylation is mediated by multiple CYP isozymes
[44]. In contrast, [O-methyl-
14
C]dextromethorphan can be
used to specifically determine CYP2D activities in rat
hepatocytes. The present experiments using isoform-select-
ive CYP inhibitors show that the demethylation of
[O-methyl-
14
C]dextromethorphan in rat hepatocytes was
mediated by enzymes of the CYP2D family. The reaction
was inhibited by the CYP2D inhibitor quinine but not
by specific inhibitors of rat CYP1A1/2, CYP2C11 and
CYP3A. In addition, the more potent inhibition by quinine
relative to quinidine is a characteristic feature of rat CYP2D
enzymes.
Except for CYP1A and CYP2B, for which cell-based
fluorimetric assays have been reported [45,46], non-HPLC
assays suitable for determining CYP inhibition in intact
hepatocytes have not been described to date. The present
method can be used for relatively high throughput screening
of CYP2D inhibitors, because of the possibility of carrying
out reactions using as few as 100 000 cells attached to the
wells of 24-well culture plates and processing the reaction
products in 96-well solid-phase extraction plates. Compared
with conventional methods for measuring CYP activity in
intact hepatocytes, which entail preparation of microsomes
and HPLC separation of reaction products, the new
CYP2D assay procedure described here has the advantage
of greatly improved simplicity, speed and sensitivity. The
latter factor is particularly important for assessing CYP
inhibition, because competitive inhibition assays should be
performed using substrate concentrations that are not much
higher than the K
m
. The concentration of dextromethorphan
Table 3. Kinetic parameters for inhibition of [O-methyl-
14
C]dextromethorphan demethylation by CYP2D inhibitors in rat liver microsomes and rat
hepatocytes. Inhibition data (Fig. 5) were fitted to a four-parameter logistic model. n,slopefactor;IC
50
, concentration that produces 50%
inhibition. Results are parameter values (± SEM), as calculated by the curve-fitting software.
Inhibitor
IC
50
(l
M
) n
Hepatocytes Microsomes Hepatocytes Microsomes
Pyrilamine 1.3 ± 0.3 2.6 ± 0.4 0.49 ± 0.05 0.49 ± 0.03
Propafenone 1.9 ± 0.2 4.4 ± 1.2 1.12 ± 0.10 0.95 ± 0.21
Verapamil 3.6 ± 0.3 11.1 ± 0.9 0.78 ± 0.04 0.95 ± 0.06
Ketoconazole 0.7 ± 0.1 0.6 ± 0.1 0.69 ± 0.05 0.83 ± 0.09
Terfenadine 3.8 ± 0.6 2.3 ± 0.5 0.81 ± 0.09 0.79 ± 0.11
Fig. 5. Effect of CYP2D inhibitors on [O-methyl-
14
C]dextromethorphan demethylase activity. (A) Rat hepatocytes; (B) rat liver microsomes.
Enzymatic activity was determined in the presence of pyrilamine (d), propafenone (j),verapamil(m), ketoconazole (s), or terfenadine (h).
Results were expressed as percentage of control activity in the absence of inhibitor. Data represent mean ± SEM from three to four experiments.
Curves were fitted to a four-parameter logistic inhibition model as described in Results.
3774 A. Di Marco et al.(Eur. J. Biochem. 270) Ó FEBS 2003
(1 l
M
) used in the present hepatocyte assay fulfils this
requirement. Even though we validated the assay for rat
CYP2D only, the general method of measuring the
radiolabelled products of CYP-mediated dealkylation reac-
tions should be easily adaptable to other CYP isoforms and
hepatocytes of other species, including humans, using
appropriate probe substrates, such as [O-ethyl-
14
C]phenace-
tin [40], [O-methyl-
14
C]naproxen [24], [N-methyl-
14
C]eryth-
romycin [23,41] and [N-methyl-
14
C]diazepam [24].
Dextromethorphan O-demethylation in rat liver micro-
somes and hepatocytes has previously been studied using
nonradiometric methods, and it was reported that this
reaction is mediated by multiple enzyme systems. In rat liver
microsomes, O-demethylation of unlabelled dextromethor-
phan is mediated by high-affinity and low-affinity enzyme
systems, with apparent K
m
values of 1–3 l
M
and 43–158 l
M
,
respectively [18,37]. In rat hepatocytes, O-demethylation of
unlabelled dextromethorphan was reported to display
sigmoidal kinetics, with an S
50
value of 13 l
M
and a Hill
coefficient of 2.4. The rat CYP2D family comprises six
members, denominated CYP2D1-5 and CYP2D18 [47,48].
Dextromethorphan O-demethylation is catalyzed by
cDNA-expressed rat CYP2D2 but not CYP2D1 [49].
Indirect evidence suggests that other CYP2D isoforms can
catalyze this reaction. Dextromethorphan interacts with
multiple CYP2D isoforms, as it was shown to inhibit the
metabolism of 7-methoxy-4-(aminomethyl)coumarin by
CYP2D1, CYP2D2, CYP2D3 and CYP2D4 with IC
50
values of 264, 5.6, 18.6, and 136 l
M
, respectively [50]. These
results suggest that the high-affinity component of the
reaction is mediated by CYP2D2 with a possible contribu-
tion of CYP2D3, while the low-affinity component may be
mediated by CYP2D1 and/or CYP2D4. In this study,
[O-methyl-
14
C]dextromethorphan demethylation in rat liver
microsomes and hepatocytes exhibited apparent K
m
values
of 2.1 and 2.8 l
M
,andV
max
values of 0.74 nmolÆmin
)1
per
mg microsomal protein vs. 0.11 nmolÆmin
)1
per mg cellular
protein, respectively, with Hill coefficients close to unity and
Eadie–Hofstee plots that deviated only slightly from
linearity. The apparent microsomal K
m
and V
max
values
are comparable to those previously reported [18,37] for the
high-affinity component of dextromethorphan O-demethy-
lation in rat liver microsomes (K
m
¼ 1.1–2.5 l
M
;
V
max
¼ 0.42–0.85 nmolÆmin
)1
Æmg
)1
).Itislikelythatmark-
edly biphasic kinetics were not observed in the present
experiments because the [O-methyl-
14
C]dextromethorphan
concentrations used did not exceed 25 l
M
(microsomes) and
100 l
M
(hepatocytes), which is close to the apparent K
m
of
the low-affinity component reported in rat liver microsomes.
In contrast, kinetic studies with unlabelled dextromethor-
phan were performed using substrate concentrations up to
500–600 l
M
[18,37]. Thus, under the present conditions,
[O-methyl-
14
C]dextromethorphan O-demethylation was pri-
marily mediated by CYP2D isoforms with high substrate
affinity.
The hypothesis that [O-methyl-
14
C]dextromethorphan
O-demethylation in rat liver microsomes and hepatocytes
is mediated by high-affinity CYP2D isoforms including
CYP2D2 and possibly CYP2D3 is supported by the
inhibition profile of quinine and quinidine. In both micro-
somes and hepatocytes, these compounds inhibited the
reaction in a biphasic manner, suggesting interaction with at
least two enzyme systems. Curve fitting to a logistic model
or to a two-site model produced excellent fits with
correlation coefficients close to unity. We preferred to
analyze the data according to the two-site model for the
following reasons. Slope factors for the logistic fits were
significantly smaller than 1, suggesting interaction with
multiple enzyme systems, or allosteric behaviour. Individual
rat CYP2D isoforms display Michaelis–Menten kinetics
with the substrate 7-methoxy-4-(aminomethyl)coumarin
[50], and to our knowledge, allosteric kinetics has not been
reported for other ligands. On the other hand, it is well
known that dextromethorphan can interact with multiple
CYP2D isoforms [50], and the observed biphasic inhibition
kinetics most likely reflect this property. The higher-affinity
component for quinine displayed IC
50
values of 0.13 l
M
(microsomes) and 0.06 l
M
(hepatocytes), whereas the
lower-affinity component had IC
50
values of 12.6 l
M
(microsomes) and 5.0 l
M
(hepatocytes). These values are
close to the reported IC
50
values of quinine for inhibition of
CYP2D2-mediated and CYP2D3-mediated dealkylation of
7-methoxy-4-(aminomethyl)coumarin, 0.09 and 12.0 l
M
,
respectively [50]. The high-affinity and low-affinity compo-
nents of quinidine inhibition of [O-methyl-
14
C]dextrometh-
orphan O-demethylation displayed IC
50
values of 3.3 l
M
(microsomes) and 0.51 l
M
(hepatocytes), vs. 48.9 l
M
(microsomes) and 19.0 l
M
(hepatocytes), respectively.
Again, these values are similar to the reported IC
50
values
for inhibition of CYP2D2-mediated and CYP2D3-medi-
ated dealkylation of 7-methoxy-4-(aminomethyl)coumarin,
2.8 and 26.9 l
M
, respectively.
The effect of several additional drugs on
[O-methyl-
14
C]dextromethorphan demethylase activity was
assessed in both rat liver microsomes and hepatocytes.
Pyrilamine [51], propafenone [37] and terfenadine [52] are
known to be potent rat and/or human CYP2D inhibitors,
whereas verapamil was reported to be a weak (IC
50
60 l
M
)
inhibitor of human CYP2D6 [53]. Even though ketocon-
azole has not been reported to inhibit CYP2D isoforms, it is
known to be a nonspecific inhibitor of various rat CYPs,
including CYP1A, CYP2C, CYP2E and CYP3A [54]. Even
though some of these compounds inhibited the reaction with
slope factors significantly lower than 1, suggesting inter-
action with more than one enzyme, the relative contribu-
tions of distinct enzymatic systems could not be resolved by
curve fitting. Additional studies, using cDNA-expressed rat
CYP2Ds will be needed to determine the interactions of
these compounds with specific isoforms. In general, there
was reasonable agreement between IC
50
values determined
in microsomes vs. hepatocytes. Some inhibitors, including
quinine and quinidine, displayed 2–3-fold lower IC
50
values
in hepatocytes than in microsomes, but this difference was
statistically significant only for quinidine and verapamil.
One possible explanation for this trend is that some of the
drugs accumulate to a moderate extent in hepatocytes. We
found that cell-associated concentrations of quinine and
quinidine were about 70-fold higher than extracellular
concentrations. However, part of the cell-associated drug
is probably bound to intracellular proteins and may thus not
be available for interaction with CYP2D. Both compounds
were found to bind extensively to proteins in homogenates
from rat liver. Even though intracellular protein binding
may be different from that observed in tissue homogenates,
Ó FEBS 2003 CYP2D-mediated drug interactions (Eur. J. Biochem. 270) 3775
it is interesting to note that the cell/medium concentration
ratio, corrected for tissue protein binding, is between 2 and
3, i.e. strikingly similar to some of the observed ratios
between IC
50
values in microsomes vs. hepatocytes. In
conclusion, for the CYP inhibitors investigated in this study,
only slight differences in inhibitory potencies were observed
between intact hepatocytes and liver microsomes. Even
though some drugs can reach high intrahepatic concentra-
tions [5], this effect may be partially offset by binding to
intracellular proteins. Further studies are required to
determine whether, for compounds with important liver
uptake and low hepatic protein binding, hepatocyte IC
50
values may provide more accurate predictions of in vivo drug
interactions than data obtained in microsomes.
Acknowledgements
We thank Isabelle Gloaguen and Laura Rehak for technical assistance,
and Dr Ashok Chaudhary (Drug Metabolism, Merck Research
Laboratories, Rahway, NJ, USA) for his assistance in the preparation
of radiolabelled dextromethorphan.
References
1. Ioannides, C., ed. (1996) Cytochromes P450. Metabolic and Toxi-
cological Aspects. CRC Press, Boca Raton.
2. Lin, J.H. & Lu, A.Y. (1998) Inhibition and induction of cyto-
chrome P450 and the clinical implications. Clin. Pharmacokinet.
35, 361–390.
3. Bertz, R.J. & Granneman, G.R. (1997) Use of in vitro and in vivo
data to estimate the likelihood of metabolic pharmacokinetic
interactions. Clin. Pharmacokinet. 32, 210–258.
4. Thummel, K.E. & Wilkinson, G.R. (1998) In vitro and in vivo drug
interactions involving human CYP3A. Annu. Rev. Pharmacol.
Toxicol. 38, 389–430.
5. von Moltke, L.L., Greenblatt, D.J., Schmider, J., Wright, C.E.,
Harmatz, J.S. & Shader, R.I. (1998) In vitro approaches to pre-
dictingdruginteractionsin vivo. Biochem. Pharmacol. 55, 113–122.
6. Bachmann, K.A. & Ghosh, R. (2001) The use of in vitro methods
to predict in vivo pharmacokinetics and drug interactions. Curr.
Drug Metab. 2, 299–314.
7. Crespi, C.L. & Stresser, D.M. (2000) Fluorometric screening for
metabolism-based drug: drug interactions. J. Pharmacol. Toxicol.
Methods 44, 325–331.
8. Riley, R.J. (2001) The potential pharmacological and toxicological
impact of P450 screening. Curr. Opin. Drug Discovery Dev. 4,
45–54.
9. Crespi, C.L., Miller, V.P. & Penman, B.W. (1997) Microtiter plate
assays for inhibition of human, drug-metabolizing cytochromes
P450. Anal. Biochem. 248, 188–190.
10. Favreau, L.V., Palamanda, J.R., Lin, C.C. & Nomeir, A.A. (1999)
Improved reliability of the rapid microtiter plate assay using
recombinant enzyme in predicting CYP2D6 inhibition in human
liver microsomes. Drug Metab. Dispos. 27, 436–439.
11. Guillouzo, A., Begue, J.M., Ratanasavanh, D., Chesne, C.,
Meunier, B. & Guguen-Guillouzo, C. (1988) Drug metabolism
and cytotoxicity in long-term cultured hepatocytes. Colloque
INSERM. 164, 235–244.
12. Maurel, P. (1996) The use of adult human hepatocytes in primary
culture and other in vitro systems to investigate drug metabolism
in man. Advanced Drug Delivery Reviews 22, 105–132.
13. Li,A.P.,Lu,C.,Brent,J.A.,Pham,C.,Fackett,A.,Ruegg,C.E.&
Silber, P.M. (1999) Cryopreserved human hepatocytes: char-
acterization of drug-metabolizing enzyme activities and appli-
cations in higher throughput screening assays for hepatotoxicity,
metabolic stability, and drug–drug interaction potential. Chem.
Biol. Interact. 121, 17–35.
14. Hengstler, J.G., Utesch, D., Steinberg, P., Platt, K.L., Diener, B.,
Ringel,M.,Swales,N.,Fischer,T.,Biefang,K.,Gerl,M.,Bottger,
T. & Oesch, F. (2000) Cryopreserved primary hepatocytes as a
constantly available in vitro model for the evaluation of human
and animal drug metabolism and enzyme induction. Drug Metab.
Rev. 32, 81–118.
15. Gomez-Lechon, M.J., Ponsoda, X., Bort, R. & Castell, J.V. (2001)
The use of cultured hepatocytes to investigate the metabolism of
drugs and mechanisms of drug hepatotoxicity. Altern.Lab.Anim.
29, 225–231.
16. Zomorodi, K. & Houston, J.B. (1995) Effect of omeprazole on
diazepam disposition in the rat: in vitro and in vivo studies. Pharm.
Res. 12, 1642–1646.
17. Xu, B.Q., Aasmundstad, T.A., Bjorneboe, A., Christophersen,
A.S. & Morland, J. (1995) Ethylmorphine O-deethylation in iso-
lated rat hepatocytes. Involvement of codeine O-demethylation
enzyme systems. Biochem. Pharmacol. 49, 453–460.
18. Witherow, L.E. & Houston, J.B. (1999) Sigmoidal kinetics of
CYP3A substrates: an approach for scaling dextromethorphan
metabolism in hepatic microsomes and isolated hepatocytes to
predict in vivo clearance in rat. J. Pharmacol. Exp. Ther. 290,
58–65.
19. Guguen-Guillouzo, C. & Guillouzo, A. (1986) Methods for pre-
paration of adult and fetal hepatocytes. Research in Isolated and
Cultured Hepatocytes (Guillouzo, A. & Guguen-Guillouzo, C.,
eds), pp. 1–12. John Libbey, London.
20. Guyomard, C., Chesne, C., Meunier, B., Fautrel, A., Clerc, C.,
Morel, F., Rissel, M., Campion, J.P. & Guillouzo, A. (1990)
Primary culture of adult rat hepatocytes after 48-hour preser-
vation of the liver with cold UW solution. Hepatology 12,
1329–1336.
21. Chesne, C. & Guillouzo, A. (1988) Cryopreservation of isolated
rat hepatocytes: a critical evaluation of freezing and thawing
conditions. Cryobiology 25, 323–330.
22. Rodrigues, A.D., Kukulka, M.J., Surber, B.W., Thomas, S.B.,
Uchic, J.T., Rotert, G.A., Michel, G., Thome-Kromer, B. &
Machinist, J.M. (1994) Measurement of liver microsomal cyto-
chrome p450 (CYP2D6) activity using [O-methyl-14C]dextro-
methorphan. Anal. Biochem. 219, 309–320.
23. Zhang, X.J. & Thomas, P.E. (1996) Erythromycin as a specific
substrate for cytochrome P4503A isozymes and identification of a
high-affinity erythromycin N-demethylase in adult female rats.
Drug Metab. Dispos. 24, 23–27.
24. Moody, G.C., Griffin, S.J., Mather, A.N., McGinnity, D.F. &
Riley, R.J. (1999) Fully automated analysis of activities catalysed
by the major human liver cytochrome P450 (CYP) enzymes:
assessment of human CYP inhibition potential. Xenobiotica 29,
53–75.
25. Dich, J. & Grunnet, N. (1989) Primary cultures of rat hepatocytes.
In Methods in Molecular Biology,Vol.5Animal Cell Culture
(Pollard, J.W. & Walker, J.M., eds), pp. 161–176. Humana Press,
Clifton, NJ.
26. Croes,K.,Casteels,M.,DeHoffmann,E.,Mannaerts,G.P.&
Van Veldhoven, P.P. (1996) alpha-Oxidation of 3-methyl-sub-
stituted fatty acids in rat liver. Production of formic acid instead of
CO
2
, cofactor requirements, subcellular localization and forma-
tion of a 2-hydroxy-3-methylacyl-CoA intermediate. Eur. J. Bio-
chem. 240, 674–683.
27. Yamazaki, M., Suzuki, H., Sugiyama, Y., Iga, T. & Hanano, M.
(1992) Uptake of organic anions by isolated rat hepatocytes. A
classification in terms of ATP-dependency. J. Hepatol. 14, 41–47.
28. Yamano, K., Yamamoto, K., Kotaki, H., Sawada, Y. & Iga, T.
(1999) Quantitative prediction of metabolic inhibition of mid-
azolam by itraconazole and ketoconazole in rats: implication of
3776 A. Di Marco et al.(Eur. J. Biochem. 270) Ó FEBS 2003
concentrative uptake of inhibitors into liver. Drug Metab. Dispos.
27, 395–402.
29. Liang, D., Hagenbuch, B., Stieger, B. & Meier, P.J. (1993) Parallel
decrease of Na
+
–taurocholate cotransport and its encoding
mRNA in primary cultures of rat hepatocytes. Hepatology 18,
1162–1166.
30. Berry, M.N., Edwards, A.M. & Barritt, G.J. (1991) Isolated
Hepatocytes: Preparation, Properties and Applications. Elsevier
Science, New York.
31. Kobayashi, S., Murray, S., Watson, D., Sesardic, D., Davies, D.S.
& Boobis, A.R. (1989) The specificity of inhibition of debrisoquine
4-hydroxylase activity by quinidine and quinine in the rat is the
inverse of that in man. Biochem. Pharmacol. 38, 2795–2799.
32. Boobis, A.R., Sesardic, D., Murray, B.P., Edwards, R.J., Single-
ton, A.M., Rich, K.J., Murray, S., de la Torre, R., Segura, J.,
Pelkonen, O., Pasanen, M., Kobayashi, S., Zhi-Guang, T. &
Davies, D.S. (1990) Species variation in the response of the cyto-
chrome P-450-dependent monooxygenase system to inducers and
inhibitors. Xenobiotica 20, 1139–1161.
33. Tyndale,R.F.,Li,Y.,Li,N.Y.,Messina,E.,Miksys,S.&Sellers,
E.M. (1999) Characterization of cytochrome P-450 2D1 activity in
rat brain: high-affinity kinetics for dextromethorphan. Drug
Metab. Dispos. 27, 924–930.
34. Bogaards, J.J., Bertrand, M., Jackson, P., Oudshoorn, M.J.,
Weaver, R.J., van Bladeren, P.J. & Walther, B. (2000)
Determining the best animal model for human cytochrome P450
activities: a comparison of mouse, rat, rabbit, dog, micropig,
monkey and man. Xenobiotica 30, 1131–1152.
35. Veronese, M.E., McManus, M.E., Laupattarakasem, P., Miners,
J.O. & Birkett, D.J. (1990) Tolbutamide hydroxylation by human,
rabbit and rat liver microsomes and by purified forms of cyto-
chrome P-450. Drug Metab. Dispos. 18, 356–361.
36. Pessayre, D., Descatoire, V., Konstantinova-Mitcheva, M.,
Wandscheer, J.C., Cobert, B., Level, R., Benhamou, P.J., Jaouen,
M. & Mansuy, D. (1981) Self-induction by triacetyloleandomycin
of its own transformation into a metabolite forming a stable 456
nm-absorbing complex with cytochrome P-450. Biochem. Phar-
macol. 30, 553–558.
37. Kerry, N.L., Somogyi, A.A., Mikus, G. & Bochner, F. (1993)
Primary and secondary oxidative metabolism of dextro-
methorphan. In vitro studies with female Sprague-Dawley and
Dark Agouti rat liver microsomes. Biochem. Pharmacol. 45,833–
839.
38. Takedomi, S., Matsuo, H., Yamano, K., Yamamoto, K., Iga, T.
& Sawada, Y. (1998) Quantitative prediction of the interaction of
midazolam and histamine H2 receptor antagonists in rats. Drug
Metab. Dispos. 26, 318–323.
39. Yamano,K.,Yamamoto,K.,Kotaki,H.,Takedomi,S.,Matsuo,
H., Sawada, Y. & Iga, T. (2000) Quantitative prediction of
metabolic inhibition of midazolam by erythromycin, diltiazem,
and verapamil in rats: implication of concentrative uptake of
inhibitors into liver. J. Pharmacol. Exp. Ther. 292, 1118–1126.
40. Rodrigues,A.D.,Surber,B.W.,Yao,Y.,Wong,S.L.&Roberts,
E.M. (1997) [O-ethyl-
14
C]phenacetin O-deethylase activity in
human liver microsomes. Drug Metab. Dispos. 25, 1097–1100.
41. Riley, R.J. & Howbrook, D. (1997) In vitro analysis of the activity
of the major human hepatic CYP enzyme (CYP3A4) using
[N-methyl-
14
C]-erythromycin. J. Pharmacol. Toxicol. Methods 38,
189–193.
42. Watkins, P.B. (1991) Breath tests as noninvasive assays of P450s.
Methods Enzymol. 206, 517–522.
43. Weigl, K. & Sies, H. (1977) Drug oxidations dependent on cyto-
chrome P-450 in isolated hepatocytes. The role of the tricarboxy-
lates and the aminotransferases in NADPH supply. Eur. J.
Biochem. 77, 401–408.
44. Niwa, T., Sato, R., Yabusaki, Y., Ishibashi, F. & Katagiri, M.
(1999) Contribution of human hepatic cytochrome P450s and
steroidogenic CYP17 to the N-demethylation of aminopyrine.
Xenobiotica 29, 187–193.
45. Kennedy, S.W., Jones, S.P. & Bastien, L.J. (1995) Efficient ana-
lysis of cytochrome P4501A catalytic activity, porphyrins, and
total proteins in chicken embryo hepatocyte cultures with a
fluorescence plate reader. Anal. Biochem. 226, 362–370.
46. Donato, M.T., Gomez-Lechon, M.J. & Castell, J.V. (1993) A
microassay for measuring cytochrome P450IA1 and P450IIB1
activities in intact human and rat hepatocytes cultured on 96-well
plates. Anal. Biochem. 213, 29–33.
47. Matsunaga, E., Zanger, U.M., Hardwick, J.P., Gelboin, H.V.,
Meyer, U.A. & Gonzalez, F.J. (1989) The CYP2D gene subfamily:
analysis of the molecular basis of the debrisoquine 4-hydroxylase
deficiency in DA rats. Biochemistry 28, 7349–7355.
48. Kawashima, H., Sequeira, D.J., Nelson, D.R. & Strobel, H.W.
(1996) Genomic cloning and protein expression of a novel rat
brain cytochrome P-450 CYP2D18* catalyzing imipramine
N-demethylation. J. Biol. Chem. 271, 28176–28180.
49. Kobayashi, K., Urashima, K., Shimada, N. & Chiba, K. (2002)
Substrate specificity for rat cytochrome P450 (CYP) isoforms:
screening with cDNA-expressed systems of the rat. Biochem.
Pharmacol. 63, 889–896.
50. Venhorst, J., ter Laak, A.M., Commandeur, J.N., Funae, Y.,
Hiroi, T. & Vermeulen, N.P. (2003) Homology modeling of rat
and human cytochrome P450, 2D (CYP2D) isoforms and com-
putational rationalization of experimental ligand-binding specifi-
cities. J. Med. Chem. 46, 74–86.
51. Hiroi,T.,Ohishi,N.,Imaoka,S.,Yabusaki,Y.,Fukui,H.&
Funae, Y. (1995) Mepyramine, a histamine H1 receptor antago-
nist, inhibits the metabolic activity of rat and human P450, 2D
forms. J. Pharmacol. Exp. Ther. 272, 939–944.
52. Jones, B.C., Hyland, R., Ackland, M., Tyman, C.A. & Smith,
D.A. (1998) Interaction of terfenadine and its primary metabolites
with cytochrome P450 2D6. Drug Metab. Dispos. 26, 875–882.
53. Ma, B., Prueksaritanont, T. & Lin, J.H. (2000) Drug interactions
with calcium channel blockers: possible involvement of metabolite-
intermediate complexation with CYP3A. Drug Metab. Dispos. 28,
125–130.
54. Eagling, V.A., Tjia, J.F. & Back, D.J. (1998) Differential selectivity
of cytochrome P450 inhibitors against probe substrates in
human and rat liver microsomes. Br. J. Clin. Pharmacol. 45,
107–114.
Ó FEBS 2003 CYP2D-mediated drug interactions (Eur. J. Biochem. 270) 3777