Budget Impasse Hinges on Confusion among Deficit Reduction, Tax Increase, and Tax Reform: An Economic Analysis of Dual Capacity and Section 199 Proposals for the U.S. Oil and Gas Industry ppt
Bạn đang xem bản rút gọn của tài liệu. Xem và tải ngay bản đầy đủ của tài liệu tại đây (361.79 KB, 30 trang )
ŀ
Budget Impasse Hinges on Confusion among Deficit Reduction, Tax Increase,
and Tax Reform:
An Economic Analysis of Dual Capacity and Section 199 Proposals for the U.S. Oil and
Gas Industry
by Joseph R. Mason
1
July 12, 2011
1
Hermann Moyse, Jr./Louisiana Bankers Association Professor of Finance at Louisiana State University and Senior
Fellow, the Wharton School. While this report was prepared with support from the American Energy Alliance, the
views here are my own do not necessarily represent those of at Louisiana State University, the Wharton School, or
the American Energy Alliance. I owe special thanks to Robert Kulick for invaluable research assistance and support.
1
As the deadline for approving an increase in the Federal debt ceiling approaches, the tax
treatment of oil and gas companies’ revenues has become enmeshed in the policy debate over
debt reduction and tax reform. That debate, however, is presently confusing three concepts:
deficit reduction, tax reform, and tax increases. While sometimes related, those three concepts
are not guaranteed to be equivalent. It is crucially important, therefore, that policymakers
maintain the distinction between the three in the highly charged budget debates in order to enact
meaningful deficit reduction policies.
The stated goal of all participants in the budget debates has been deficit reduction.
Reduced deficits are crucial to eventually reducing the debt burden to a sustainable level. The
simplest deficit reductions can be attained by decreasing spending or increasing government
revenues. But there are other policy options to alter regulatory and public goods policies in ways
that promote economic growth without raising tax rates.
That is important because even increased tax rates, in and of themselves, do not guarantee
increased tax revenues. One need only look at the famous Laffer curve hypothesis, combined
with the type of economic theory and empirical tests carried out by Gary Becker (of the
University of Chicago) and subsequent work to see the logic that taxpayers rationally choose to
pay the lower of the costs of tax avoidance or tax liabilities. Indeed, the problems currently
unwinding in Greece and other European countries are to a large extent caused by tax avoidance
behavior in an environment of very high marginal income taxes. Hence, it should not be taken as
a foregone conclusion that increased tax rates result in increased tax revenues. Moreover, when
increased tax rates actually do increase tax revenues, they create a drag on economic growth.
Hence, it is not clear that tax rate increases are sensible in the current economic situation.
2
Tax reform, while laudable, similarly need not necessarily result in deficit reduction. Tax
reform is sometimes motivated by tax simplification, other times by interests in reducing
inequities in the tax code, and yet other times by the desire to advance social agendas. Similar to
tax rate increases, only to the extent to which tax reform could lead to greater tax revenues do the
two concepts align to advance the overall goal of deficit reduction.
The present paper is meant to enlighten policymakers’ approach to some recent popular
tax proposals using relationships between deficit reduction and tax policy described above.
Throughout the recent budget debate, President Obama has consistently proposed increasing the
effective tax rates paid by the oil and gas industry as a necessary condition for achieving a
compromise. Part of President Obama’s proposal for increasing the oil and gas industry’s tax-
burden is the elimination of the Section 199 tax deduction for oil and gas companies and adding
substantial additional restrictions to the foreign tax credit rules by changing the so-called “Dual
Capacity” taxpayer rules.
That policy has been motivated variously as a social agenda tax reform and as a deficit
reduction measure. The important question to sort out, however, is whether it can be both.
Putting aside for the moment whether greater restrictions on the U.S. oil and gas industry are
desirable, the question becomes one of whether such policy can be expected to generate greater
tax revenues that can contribute, even slightly, toward deficit reduction. If so, the policy could
qualify as a deficit policy candidate. If not, however, the proposal should be dismissed.
2
The remainder of this report compares estimates of the changes in economic activity—
including economic activity, jobs, wages, and tax revenues—that could reasonably be expected
2
… barring some other overriding social need for such restrictions, i.e., a Tobin tax to restrain production of a
harmful product. Note, however, such consideration has not been the central focus of the debate. Moreover, if such
consideration were a central focus then logic would dictate that such policy should raise the price of oil and gas to
the end user, a policy that is broadly considered political suicide.
3
to result from repealing Section 199 and changing Dual Capacity to estimates of the revenue
expected to be raised as a result of these tax rate increases. The proposed revisions to Section
199 and Dual Capacity for the oil and gas industry are expected by the Treasury to raise
approximately $30 billion in Federal tax revenue over the next ten years. But this comes at the
expense of industry cutbacks that can reasonably be expected to cost the economy some $341
billion in economic output, 155,000 jobs, $68 billion in wages, and $83.5 billion in reduced tax
revenues. The net fiscal effect, a loss of $53.5 billion in tax revenues, suggests that the policy
proposals exacerbate, rather than alleviate, the Federal deficit.
Deficit reduction policies, however, are not limited to changes in the tax code.
Expansionary policies take all shapes and forms, including but not limited to sensible regulatory
policies and expansionary public goods policies that can attract businesses and increase
economic activity. Policies that promote economic growth without government expenditures are
a “free lunch” as far as the budget debate is concerned. Indeed, it is well established that
countries that use periods of fiscal pressure to reform the business environment experience faster
economic recoveries than those that do not.
3
A simple example of the possibilities of such policies is the estimated economic benefits
that would arise from the expansion of oil and gas exploration and production on the Outer
Continental Shelf (“OCS”). I show that encouraging exploration and production in the OCS
represents a highly effective means of increasing Federal tax revenues generated by the oil and
gas industry while simultaneously stimulating the economy, potentially contributing $73 billion
annually in economic activity, $16 billion annually in wages, $11 billion annually in Federal tax
3
See, for instance, the annual results of the World Bank’s “Doing Business” report as well as wider studies of
national competitiveness, such as those by the OECD and the World Economic Forum and related economic
research. All acknowledge “…making it easier and cheaper to start businesses does indeed reduce the informal
sector, create jobs, improve productivity and reduce corruption.” (“Snipping off the shackles,” Economist Magazine,
Nov 4, 2010.)
4
revenue, $5 billion annually in state and local tax revenue, and 250,000 jobs in the short run
exploration phases of development. Those effects can be expected to be followed by another
$275 billion annually in economic activity, $70 billion annually in wages, $55 billion annually in
Federal tax revenue, another $14 billion annually in Federal royalty payments, $19 billion
annually in state and local tax revenue, and 1.2 million jobs in the long-run production phases of
development. Moreover, those effects are most likely conservative since they do not include
Federal lease payments, which could reasonably be expected to be at an all-time high in the
present environment of high crude oil prices.
Of course, tax reform could still be worthwhile. In fact, tax reform that alleviates the need
for complex dual capacity adjustments could potentially be valuable for the industry while
increasing tax revenues. For instance, recently proposed territorial tax schemes could have the
potential to increase reported U.S. profits of U.S. oil and gas firms in a way that could contribute
substantially to deficit reduction goals in Congress. But as long as policymakers in Washington
continue to needlessly confuse social policy as deficit reduction, economically valuable reforms
will most likely remain elusive.
4
4
In my opinion the Obama administration is straightforward about such social policies. The fossil fuel provisions
arise from the President’s agreement “at the G-20 Summit in Pittsburgh to phase out subsidies for fossil fuels” and
are listed in a separate section of the budget entitled “Eliminate fossil-fuel preferences,” as opposed to other sections
devoted to “Simplify the tax code,” “Other revenue changes and loophole closers,” or “Reduce the tax gap and make
reforms.” Hence, there is no obvious reason to confuse notions of tax reform or deficit reduction with energy policy,
and those debates should be kept separate and distinct. (General Explanations of the Administration’s Fiscal Year
2012 Revenue Proposals, Department of the Treasury February 2011, available at />center/tax-policy/Pages/Greenbook.aspx.)
5
I. Policy Assessment of the Proposal to Repeal Section 199 and the Dual Capacity Tax
Credit
A. Summary of Section 199 and Dual Capacity Tax Provisions
A key part of the Obama administration’s 2011 budget proposal consists of increased
taxes on the oil and gas sector. In particular, the measures do away with two key tax provisions.
It is important to note, however, that those tax provisions are not subsidies specific to the oil and
gas industry, but rather tax credits available to most every American company. I suggest below
that the proposed changes, which would apply solely to oil and gas companies, have little to do
with deficit reduction and more to do with dogmatic approaches to offshore drilling safety and
energy policies. Hence, the changes appear to be merely punitive policies that are now finding a
place in the sun in the post-Gulf drilling crisis political environment.
The administration wants to eliminate essential tax provisions that all taxpayers are
entitled to under Section 199 of the American Jobs Creation Act (“Section 199”) and Section 901
of the Internal Revenue Code and Section 1.901-2 of the U.S. Treasury Regulations (regarding
“Dual Capacity” taxpayers). In doing so, it would override rules “adopted in 1983 after almost a
decade of legislative and administrative debate,” as well as legislation put in place by President
Bush in 2004 that help U.S. industries engaged in producing and manufacturing within the
United States.
5
Section 199 of the Internal Revenue Code was created under the American Jobs Creation
Act to “provide a permanent benefit … to taxpayers in a wide variety of industries.”
6
It allows
taxpayers that produce or manufacture in the United States to deduct from their taxable income a
certain percentage of such domestic production activity each year. In 2005, the Congressional
5
Dirk J. J. Suringa, The Long History of the 2011 Green Book Proposal on Dual-capacity Taxpayers, The
Credibility of Foreign Taxes – General Issues (Portfolio 901), BNA Tax & Accounting, Jun. 10, 2010 (available at
6
Scott Vance, Final Section 199 regulations clarify application of domestic production incentive, AllBusiness, May
1, 2006 (available at
6
Budget Office estimated that the provision “effectively reduced the United States’ highest federal
statutory corporate tax rate for income from domestic production from 35 percent to 31.85
percent.”
7
The adjusted rate for U.S. corporations brings the American rate closer to (though still
not as low as) the average rate for nations of the Organization of Economic Cooperation and
Development, helping U.S. corporations doing business domestically compete against lower-
taxed foreign competitors.
8
Unlike Section 199, which effectively lowers the tax rate on domestic production
activities in the U.S., the foreign tax credit rules, including the Treasury’s Dual Capacity
provisions, are meant to avoid double-taxing U.S. firms’ income from abroad, encouraging tax
fairness for U.S. multinational firms.
9
All U.S. firms are entitled to a credit against their U.S. tax
liability on foreign earned income for foreign income taxes already paid on that income.
Specific, more restrictive rules apply to certain taxpayers, called Dual Capacity taxpayers,
including oil and gas companies. Under Dual Capacity, a U.S. oil and gas company that does
foreign business may only “credit the portion of [a foreign tax] levy in the amount of what the
generally imposed [foreign] income tax would be”,
10
unless it can show some higher amount is
in fact an income tax, and no portion of that higher amount is a royalty or disguised royalty (or,
in the words of the regulations, a payment for a “specific economic benefit”). If a taxpayer can
meet this extraordinary burden of proof, then it is entitled to treat such additional amount paid as
income taxes eligible as offsets against potential U.S. income tax on such foreign income. This
7
Corporate Income Tax Rates: International Comparisons, Congressional Budget Office, Nov. 2005, 14 (available
at
8
Andrew Chamberlain, Estimating the Tax Burden and Economic Impact from the Proposed “Gang of Ten”
Revenue Offsets, Fiscal Economics Policy Study 2008-08, Institute for Energy Research, Sep. 2008, 9 (available at
9
White House Tax Plan Favor Foreign Companies, Forbes, Jul. 21, 2010 (available at
10
Tax Legislation Manufacturing Industry View, 2010 Budget Resolution, Deloitte, May 15, 2009 (available at
/>UnitedStates/Local%20Assets/Documents/us_tax_ManufacturingBudgetUpdate_051309.pdf).
7
provision is crucial for many U.S. energy firms competing with foreign state-run corporations
from such countries as Russia, Venezuela, and China, or with companies based in countries
outside the U.S., such as those headquartered in France, the U.K., the Netherlands, etc., which
generally do not impose home country income tax on income earned outside of their borders
(generally territorial taxation systems). Without the foreign tax credit, U.S. oil and gas firms
would be double-taxed on revenues from their foreign operations in other countries.
11
1. Section 199 Tax Deduction
In 2004, under the American Jobs Creation Act, the Congress enacted a new tax
deduction for U.S. businesses under Section 199 of the Tax Code. The legislation grants
taxpayers the right “to receive a deduction based on qualified production activities income
resulting from domestic production.”
12
According to the stipulations of the law, qualified
production activities include goods “manufactured, produced, grown, or extracted in whole or
in significant part within the United States.”
13
The definition clearly covers oil and gas produced
in the United States.
The deduction went into effect for taxable years beginning after December 31, 2004 and
was phased in over several years. In 2005 taxpayers qualifying for the deduction received a
three percent deduction.
14
According to the U.S. Department of the Treasury, in 2005 the
deduction would be applied as “three percent of the lesser of: (a) taxable income derived from a
11
White House Tax Plan Favor Foreign Companies, Forbes, Jul. 21, 2010 (available at
12
Henry V. Singleton. Industry Director Directive on Domestic Production Deduction (DPD), U.S. Internal Revenue
Services [2006]. Web. <
13
“American Jobs Creation Act of 2004.” (PL 108-357, Oct. 22, 2004).
bin/getdoc.cgi?dbname=108_cong_ public_laws&docid=f:publ357.108.pdf.
14
“Fact Sheet: Guidance on Section 199 – Income Attributable to Manufacturing Activities, U.S. Department of the
Treasury,” Office of Public Affairs. Jan. 19, 2005, 1.
8
qualified production activity; or (b) taxable income, for the taxable year.”
15
The calculation for a
taxable year is capped at 50 percent a taxpayer’s W-2 wages over the calendar year.
16
The total
amount of the deduction is computed by subtracting the percentage of the taxpayer’s income that
was earned as a result of qualified domestic activities from the total taxable income.
17
The
percentage of qualified income subject to the deduction has increased to six percent in 2007, and
to nine percent of qualified income beginning in 2010.
18
In August of 2008, a group of ten senators, dubbed the “Gang of 10” proposed the
exclusion of energy firms from Section 199 as part of the New Energy Reform Act of 2008
(“ERA”).
19
By excluding energy firms from Section 199, the senators hoped to raise tax revenues
that could be redistributed to favored projects. In the Emergency Economic Stabilization Act of
2008, the Section 199 deduction amount was frozen at six percent of qualified income for oil and
gas companies.
20
The Obama administration’s fiscal proposal would exclude oil and gas
companies entirely from Section 199.
21
Critics of the exclusion demonstrated early on that the change to Section 199 would bring
about harmful changes in employment, earnings and economic output throughout the U.S.
economy.
22
A 2008 report by the Congressional Research Service reached the same conclusion.
15
“Fact Sheet: Guidance on Section 199 – Income Attributable to Manufacturing Activities, U.S. Department of the
Treasury,” Office of Public Affairs. Jan. 19, 2005, 1.
16
Id.
17
Andrew Chamberlain. “Estimating the Tax Burden and Economic Impact from the Proposed “Gang of Ten”
Revenue Offsets Fiscal Economics Policy Study 2008-08,” Institute for Energy Research. Sept. 9, 2008.
gang_of_10_energy_study.pdf.
18
Id.
19
Senator Lindsey Graham. “‘Gang of 10’ Introduces Bipartisan Energy Proposal: Press Release,” Senator Lindsey
Graham Official Home Page. Aug. 1, 2008.
20
Andrew Chamberlain. “Estimating the Tax Burden and Economic Impact from the Proposed “Gang of Ten”
Revenue Offsets Fiscal Economics Policy Study 2008-08,” Institute for Energy Research. Sept. 9, 2008.
gang_of_10_energy_study.pdf
2121
Warren Hudak, Repealing Section 199 Tax Code Will Hurt Economy, The Bulletin, Feb. 28, 2010 (available at
22
Id.
9
While the CRS analysis suggested that there will be little effect in the short run, “all taxes distort
resource allocation, and even a corporate profit tax would reduce the rate of return and reduce
the flow of capital into the industry,” in the long run.
23
Rates of return to investment in oil and
gas “would decline, causing a decline in capital flows to this industry, and an increase in capital
flowing to other industries, including foreign industries.”
24
Recent Office of Management and
Budget estimates show that excluding the oil and gas industry from Section 199 would increase
the Federal government’s revenues by $18.3 billion over the next ten years while most likely
having an adverse effect on the U.S. energy sector, including industries that support the
production and transportation of oil and gas.
25
Such deleterious effects can reasonably be expected because although the administration
claims that “the [previously] lower rate of tax … distorts markets by encouraging more
investment in the oil and gas industry than would occur under a neutral system,” the move
disadvantages oil and gas firms relative to other firms—meaning all of U.S. manufacturing
outside of oil and gas—that remain taxed at the lower rate.
26
Thus, the current proposed budget
could be expected to place U.S. oil and gas firms at a disadvantage when competing for capital
with other U.S. firms. The current proposal will therefore likely discourage investment in
“energy infrastructure and would threaten the production rates of energy companies
themselves.”
27
23
Salvatore Lazzari, Energy Tax Policy: History and Current Issues, CRS Report for Congress, Congressional
Research Service, Nov. 7, 2007, CRS-20 (available at
24
Id.
25
General Explanations of the Administration’s Fiscal Year 2012 Revenue Proposals, Department of the Treasury
February 2011, available at
26
General Explanations of the Administration’s Fiscal Year 2012 Revenue Proposals, Department of the Treasury
February 2011, available at
27
Proposed Energy Taxes Would Kill U.S. Jobs, American Energy Alliance (available at
ŀ
10
2. Dual Capacity Taxpayer Rules
The Dual Capacity taxpayer rules were finalized 25 years ago, with the express intent of
helping U.S. firms compete with foreign companies on a level playing field by avoiding double
income taxation. Any company dealing with “a foreign country as both the sovereign and as the
grantor of an economic benefit, such as a concession for developing the country’s natural
resources” is classified under the regulations as a Dual Capacity taxpayer.
28
Similar to Section
199, Dual Capacity is particularly important for oil and gas companies, even though they are
technically applicable to all firms.
The regulations were finalized in 1983 after significant debates during both the Carter
and Reagan administrations. The rules impose stringent burdens of proof on Dual Capacity
taxpayers, more stringent than on non-Dual Capacity taxpayers. Dual Capacity taxpayers must
prove that no portion of the amounts claimed as income taxes is in fact a payment for the other
governmental benefit. It can do this under a “facts and circumstances” test or under a “safe
harbor” test. Under the safe harbor test, where there is a generally applicable tax in the country
that applies to non-Dual Capacity taxpayers, the taxpayer
can utilize a specific formula to “credit
the amount that would be produced … by the application of the income tax generally imposed by
the foreign sovereign on all taxpayers.”
29
The regulation also includes “a safe harbor [provision] if the foreign country does not
generally impose an income tax.”
30
In such a case, the safe harbor was set “to limit the credit to
28
Pamela F. Olson and Brian H. Jenn Skadden, Economic and Foreign Policy Implications of the Administration’s
“Dual Capacity Taxpayer” Proposals, Letter to Treasury on Implications of Administration’s Dual-Capacity
Taxpayer Proposals, Skadden, Arps, Meagher & Flom LLP and Split Rock International Inc. Analysis, Jul. 21, 2010
(available at
29
Id.
30
Tax Legislation manufacturing Industry View, 2010 Budget Resolution, Deloitte, May 15, 2009 (available at
/>UnitedStates/Local%20Assets/Documents/us_tax_ManufacturingBudgetUpdate_051309.pdf).
11
the amount of all [payments to foreign sovereigns] attributable to foreign oil and gas income,
multiplied by the U.S. tax rate.”
31
In addition to eliminating oil and gas companies from Section 199, the current
administration’s 2011 fiscal budget also recommends significantly adjusting the Dual Capacity
rules. The change would eliminate the “facts and circumstances test” and the safe harbor
applicable where there is no generally applicable tax, and in all other cases limit the creditable
tax to the amount that non-Dual Capacity taxpayers would pay. The effect would levy a double-
tax on U.S based oil and gas producers, while effectively completely exempting companies
headquartered in other countries.
32
Unlike Section 199, the current administration intends to
make the changes to Dual Capacity applicable to all taxpayers. Nevertheless, the energy sector
will be severely affected since U.S. oil and gas companies often compete with foreign state-
owned corporations. U.S. oil and gas firms are among the largest U.S. firms in terms of
multinational revenues and can therefore be expected to be the most dramatically affected by the
policy shift. The effects measured here are limited to that industry and do not estimate the
broader impact of the repeal.
The adjustment to Treasury’s Dual Capacity regulation would put U.S. firms at a
significant competitive disadvantage against both foreign oil and gas firms as well as other U.S.
firms competing for limited investment capital. The proposed modifications for Dual Capacity
companies would change how foreign levies would qualify under the provision. The proposed
change would “allow the taxpayer to treat as a creditable tax the portion of a foreign levy that
does not exceed the foreign levy that the taxpayer would pay if it were not Dual Capacity
31
Dirk J. J. Suringa, The Long History of the 2011 Green Book Proposal on Dual-capacity Taxpayers, The
Credibility of Foreign Taxes – General Issues (Portfolio 901), BNA Tax & Accounting, Jun. 10, 2010 (available at
32
Proposed Energy Taxes Would Kill U.S. Jobs, American Energy Alliance (available at
12
taxpayer.”
33
As noted, this would completely eliminate the facts and circumstances test and one
of the safe-harbor provisions put in place to keep U.S. firms from being disadvantaged versus
their foreign counterparts. Thus, “if a foreign country imposes no other tax to which a Dual
Capacity taxpayer would be subject, it appears that the taxpayer would not be permitted to claim
any foreign tax credits for payments to that country,” [emphasis added] even if the country still
charged a tax to the firm.
34
The administration estimates that the total tax revenues from revising Dual Capacity in this
fashion amount to $11 billion over ten years, and Americans for Tax Reform confirms that oil
and gas firms will bear the lion’s share of the burden.
35
B. The Economic Effects of Removing Section 199 and Changing Dual Capacity Rules
Section 199 and Dual Capacity rules maintain a level domestic and international playing
field for U.S. oil and gas firms and, in turn, benefit the U.S. economy, as a whole.
The U.S. oil and gas sector is a significant part of the overall economy. Hundreds of both
large and small companies in the U.S. oil and gas industry create close to 10 million jobs “not
just in exploring, producing, refining, transporting, and marketing oil and natural gas, but also
through the purchases [they make] of other goods and services that support the industry’s
operations.”
36
In 2008 alone, the U.S. oil and natural gas industry paid approximately $95.6
billion in U.S. income taxes and contributed about $1 trillion to the U.S. economy.
37
In order to measure how the proposed tax policies affect this sector, it is helpful to break
the sector down into its economic subparts. U.S. oil and gas projects have three distinct phases:
33
Id.
34
Id.
35
Americans for Tax Reform, Energy Tax Analysis, February 2011, at www.atr.org.
36
America’s oil and natural gas industry supports over 9 million jobs. American Petroleum Institute, Apr. 5, 2010
(available at
37
See Energy and the Economy, Energy Tomorrow (available at
13
(1) the initial exploration and development of offshore facilities; (2) the extraction of reserves;
and (3) the refining of raw product. All three phases support numerous local and national
industries, such as shipbuilding, food services, and other necessary services. The refining phase,
especially, contributes large “spill-over” effects around the country even though capacity is
largely concentrated in California, Illinois, New Jersey, Louisiana, Pennsylvania, Texas, and
Washington.
38
In a September 2010 report entitled “The Regional and National Impact of Repealing
Section 199 and Dual Capacity Tax Credit for Oil and Gas Producers,” I estimated the probable
economic consequences of abolishing Section 199 and modifying Dual Capacity in terms of
output, employment, wages, and state and local and Federal tax revenues generated by the oil
and gas industry.
39
In this report, I use those estimates as a basis for comparing the economic
value of repealing these tax provisions as a means to reduce the budget deficit. In short, the
expected contraction in tax revenues arising from decreased business activity is far larger than
the expected revenue increases anticipated by the Treasury. As a result, there is no basis for
classifying changes to Section 199 and Dual Capacity as deficit reduction measures. Rather,
those changes remain squarely within the confines of the Obama administration energy policy,
creating a tax drag on economic growth in an attempt to engineer a social shift away from fossil
fuels.
The September 2010 report used “input-output” analysis to estimate the economic effects
of abolishing Section 199 and significantly changing Dual Capacity for oil and gas companies.
40
That methodology, originally developed by Nobel Economic Laureate Wassily Leontief, has
38
See Joseph R. Mason, The Economic Cost of a Moratorium on Offshore Oil and Gas Exploration to the Gulf
Region, American Energy Alliance, Jul. 2010.
39
Joseph R. Mason, “The Regional and National Economic Impact of Repealing the Section 199 Tax Deduction and
Dual Capacity Tax Credit for Oil and Gas Producers,” American Energy Alliance, Sept. 2010.
40
Id.
14
been refined by the U.S. Department of Commerce and is known as the Modern Regional Input-
Output Modeling System II or “RIMS II.” The model is premised on the idea that when a
company has to pay $1 more in taxes, it must take that amount from other sources: reducing
workers’ pay (either through wage cuts or layoffs); reducing the returns on shareholders’
investments (through lower share price or dividends); and/or reducing its purchases of inputs. In
turn, the amount is subtracted directly from funds used to pay the company’s suppliers, the
suppliers’ workers, suppliers’ capital owners, etc., and impacts every member of a company’s
production chain. In this way, a tax on even just a small number of firms can be felt throughout
the economy. The Department of Commerce publishes tables of RIMS II multipliers that indicate
how a change in one industry or state can affect the rest of the economy. A detailed description
of how I applied this model can be found in the report.
I estimated that if Section 199 was repealed and Dual Capacity was changed as proposed
in 2011, the U.S. could suffer approximately $341 million in lost output over the 2011-2020
period.
41
I also estimated that President Obama’s proposals could cost approximately 155,000
jobs in 2011 and 115,000 for each year thereafter until 2020 and that workers could suffer
approximately $68 billion in lost wages from 2011 to 2020.
42
Finally, I estimated that as a
consequence of the decrease in economic activity state and local governments could lose $18
billion in tax revenue while the Federal government could lose $65 billion in tax revenue over
the relevant time period.
43
The following table summarizes my estimation of the losses that
would result over the 2011-2020 period as a consequence of repealing those tax provisions:
41
Id. at 11.
42
Id. at 13.
43
Id. at 18.
15
Table 1: Summary of the Estimated Decrease in U.S. Economic
Activity from Repeal of Section 199 Deduction and Change to
Dual Capacity Taxpayer Rules, 2011-2020
Output ($ Mil) $341,314
Employment (Jobs*) 154,901
Wages ($ Mil) $67,800
Tax Revenues ($ Mil) $83,500
* A job is defined by the BEA in terms of “full time person years of employment.” Total
full-time person-years are divided by ten to measure jobs lost for the entire decade.
One region of the country that stands to be hit the hardest is the Gulf of Mexico. That
region, already recovering from numerous recent disasters, could lose another $126 billion in
economic output, more than $24 billion in wages, 56,709 jobs, and about $600 million in state
and local tax revenues over the ten year period analyzed.
Updating the numbers in Table 1 for the present 2012-2021 budget cycle increases the
estimated effects because of the combined influences of general and energy price inflation. Since
such inflationary influences may be transitory, however, I advance my earlier estimates as more
conservative and representative of the probable policy effects than those updated to the current
economic environment.
As is to be expected in an integrated economy, the effects of repealing Section 199 and
modifying Dual Capacity are not concentrated in the oil and gas sector. I showed in my
September 2010 study that job losses are not only in the energy sector, but also across the entire
economy. Table 2 summarizes the effects for representative sectors of the job market.
Table 2: U.S. Jobs Lost from Repeal of Section 199 Deduction and
Changes to Dual Capacity Taxpayer Rules, 2011-2020
Industry Number of Jobs
Agriculture, forestry, fishing, and hunting 516
Mining 3,690
Utilities 1,221
16
Construction 2,822
Manufacturing 20,490
Wholesale trade 4,265
Retail trade 9,537
Transportation and warehousing 4,197
Information 1,572
Finance and insurance 3,856
Real estate and rental and leasing 5,239
Professional, scientific, and technical services 5,079
Management of companies and enterprises 2,905
Administrative and waste management services 6,790
Educational services 1,421
Health care and social assistance 7,808
Arts, entertainment, and recreation 1,371
Accommodation 890
Food services and drinking places 5,842
Other services 4,711
Source: Treasury Department; Bureau of Economic Analysis; U.S. Department
Commerce
Table 2 shows that a large proportion of job losses (38 percent) occur in professional
fields such as health care; real estate; professional, scientific, and technical services;
administration; finance; education; the arts; information; and management.
44
Manufacturing,
which includes food and textile manufacturing, is also hard hit, with 21% of the total
employment losses. Only about one fourth of the losses are in mining manufacturing, which
includes oil and gas production and refining.
Recent estimates suggest that the repeal of Section 199 and modification of Dual
Capacity will raise $18.3 billion and $10.8 billion in revenue from the oil and gas industry
respectively for the Federal government between 2012 and 2021.
45
Thus, even my conservative
September 2010 estimates suggest that the predicted increase in Federal tax revenue of
44
For a full listing of the jobs see U.S. Census Bureau’s 2007 NAICS Codes and Titles, (available at
45
“Americans for Tax Reform Energy Tax Analysis,” ATR, February 2011. Retrieved
17
approximately $30 billion would induce a $53.5 billion net loss in tax revenue due to reduced
economic activity in the oil and gas sector. Of course, that should not come as a surprise since
the Obama administration is not promoting the repeal of Section 199 and modification of Dual
Capacity as deficit reduction measures. The analysis is clear: the proposal is for punitive taxes
meant to consciously kill jobs and economic activity in the oil and gas sectors in a conscious
shift away from oil and gas pursuant to President Obama’s promise to the G-20.
Of course, there is some degree of error around all of the estimated tax revenue and
economic effects. However, even if the error around both estimates is large, these figures suggest
that it is highly unlikely that the repeal of Section 199 and the modification of Dual Capacity will
result in substantially increased revenue for the Federal government. Furthermore, when one also
considers the losses in output, jobs, and wages, it becomes apparent that changes to Section 199
and Dual Capacity are simply social policies with “contractionary” economic effects.
II. As Far as the Oil and Gas Industry is Concerned, A More Effective Deficit
Reduction Strategy Would Be to Stimulate Production.
The sections above demonstrated that the proposed changes to Section 199 and Dual
Capacity are motivated by social goals rather than deficit reduction goals. The present section
shows that there are energy policy options that can contribute substantially to deficit reduction. If
the administration truly prioritizes deficit reduction over other policy imperatives it is not
inconceivable that dogmatic adhesions to social goals and economic engineering could take a
back seat to strict fiscal imperatives. If the financial condition of the nation is as dire as it
appears, such a policy shift will have to happen sooner or later. Better to undertake that shift
consciously and manage the transition rather than face Greek-style popular uprisings in the face
of sudden large-scale changes.
18
From an economic perspective, policies that encourage economic growth are effectively a
“free lunch” in terms of deficit reduction, because such policies simultaneously increase the
economic benefits enjoyed by the public and increase Federal tax revenue: in other words, they
expand the economic pie.
Significant oil and gas reserves lie under the U.S. Outer Continental Shelf (OCS).
According to the EIA, the OCS (including Alaska OCS Planning Areas) contains approximately
86 billion barrels of recoverable oil and approximately 420 trillion cubic feet of recoverable
natural gas.
46
Even the White House notes that the OCS estimates are woefully conservative.
47
Of the total OCS reserves, a significant portion remains unavailable to exploration.
Specifically, Presidential and Congressional mandates ban production from OCS Planning Areas
covering approximately 18 billion barrels of recoverable oil and 77.61 trillion cubic feet of
recoverable natural gas.
48
These bans cover approximately 31 percent of the total recoverable
OCS oil reserves and 25 percent of the total recoverable OCS natural gas reserves.
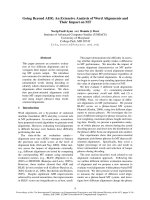
Figure 1, which was originally produced by the EIA, visually demonstrates the areas (in
blue) that were previously unavailable. As noted previously, the estimated reserves illustrated in
Figure 1 should be considered very conservative lower bounds of recoverable energy resources.
46
See MMS, “Assessment of Undiscovered Technically Recoverable Oil and Gas Resources of the Nation’s Outer
Continental Shelf, 2006”, MMS Fact Sheet RED-2006-01b, Feb. 2006, Table 1.
47
See White House Policy Memorandum, American Made Energy, June 18, 2008, at 2 (“About 18 billion barrels of
oil and 77 trillion cubic feet of natural gas exist in OCS areas now under moratoria –absolute bans on exploration
and development. These estimates are likely conservative, due to the age of the data (1970s). Actual resources may
be significantly greater but we won’t know until exploration is allowed.”). OCS estimates do not include the
reserves that lie under fisheries or other areas that are still closed to exploration or production, and that these
reserves would be omitted from any revised numbers.
48
Id.
19
Figure 1: OCS Planning Areas and Estimated Reserves
Source: Phyllis Martin, Unpublished U.S. Energy Information Administration memorandum (based on MMS
Assessment of Undiscovered Technically Recoverable Oil and Gas Resources Of the Nation’s Outer
Continental Shelf, 2006), on file with the author.
Note: Alaska OCS Planning Areas not shown here. Only one Alaska OCS Planning Area (Northern Aleutians)
was subject to an exploration and production moratorium.
In contrast to other industries, the high fixed investment costs associated with offshore oil
and gas production produce large initial investments that reverberate throughout the economy.
Once oil or gas reserves are located, billions of dollars must be spent before the well produces
even $1 of revenue. For example, oil exploration costs can amount to between $200,000 and
$759,000 per day per site.
49
The fixed expenditures that precede actual offshore oil and gas
production can amount to billions of dollars.
For example, Chevron’s “Tahiti” project in the Gulf of Mexico is representative of the
large investments that firms must make before production is achieved. In 2002, Chevron
49
See Statement of John Hofmeister, President, Shell Oil Company, Before the U.S. House Select Committee on
Energy Independence and Global Warming, Apr. 1, 2008 [hereinafter Shell Testimony], at 7-8 (discussing the run-up
in Gulf of Mexico exploration costs).
Mbbl = million barrels; Tcf = trillion cubic feet
** Existing leases(160 Mbbl, 0.28 Tcf) are not subject to moratoria.
Source: MMS Assessment of Undiscovered Technically Recoverable
Oil and Gas Resources Of the Nation’s Outer Continental Shelf 2006,
mean estimates
Northern California
2,080 Mbbl
3.58Tcf
Central California
2,310 Mbbl
2.41Tcf
Mid-
Atlantic
1,500 Mbbl
15.13 Tcf
Washington/Oregon
400 Mbbl
2.28Tcf
Southern California**
5,740 Mbbl
10.03Tcf
South
Atlantic
410 Mbbl
3.86 Tcf
North Atlantic
1,910 Mbbl
17.99 Tcf
Available: 3.62 Mbbl
20.24 Tcf
Unavailable: 3,440 Mbbl
19.37 Tcf
Western
Gulf of
Mexico
10,700 Mbbl
66.25 Tcf
Areas Withdrawn from Leasing through 2022
Congressional Moratoria Areas
OCS Planning Areas
Eastern
Gulf of
Mexico
Central
Gulf of
Mexico
Available: 30,320 Mbbl
144.77 Tcf
Unavailable: 210 Mbbl
2.09 Tcf
20
explored the Tahiti lease—which lies 100 miles off the U.S. coast at a depth of 4,000 feet—and
found “an estimated 400 million to 500 million barrels of recoverable resources.”
50
Chevron
estimated that it would take seven years to build the necessary infrastructure required to begin
production at Tahiti.
51
The firm estimated that its total development costs will amount to “$4.7
billion—before realizing $1 of return on our investment.”
52
As a typical U.S. offshore project, the Tahiti project provides a wealth of information
regarding the up-front investment costs, length of investment, and lifespan of future OCS fields.
As noted above, the Tahiti field is estimated to hold between 400 million and 500 million barrels
of oil and oil equivalents (primarily natural gas) and is expected to require an initial fixed
investment of $4.7 billion. Using the mid-point reserve estimate of 450 million barrels of oil
equivalent, up-front development costs amount to approximately $10.44 per barrel of oil reserves
or $1.86 per 1,000 cubic feet of natural gas reserves.
53
These costs will be spread over an average
of 7 years, resulting in average up-front development expenditures equal to $1.49 per barrel of
oil and $0.27 per 1,000 cubic feet of natural gas.
54
Chevron also estimates that the Tahiti project
will produce for “up to 30 years”
55
. Although investment and production times vary widely,
56
the
50
Statement of Peter J. Robertson, Vice Chairman, Chevron Corp., Prepared for the House Select Committee on
Energy Independence and Global Warming, Apr. 1, 2008 [hereinafter Chevron Testimony], at 6 (“In 2002, we used
leading-edge technology to drill in 4,000 feet of water and found an estimated 400 million to 500 million barrels of
recoverable resources. It will take seven years to build the infrastructure required to produce the oil and gas more
than a 100 miles offshore.”).
51
Id.
52
Id. (“When Tahiti finally comes on line, we will have invested $4.7 billion—before realizing $1 of return on our
investment.”).
53
The natural gas investment price is based on the conversion of 5,620 cubic feet of natural gas per 1 barrel of oil
equivalent. One barrel of oil is equal to one barrel of oil equivalent. See MMS, Assessment of Undiscovered
Technically Recoverable Oil and Gas Resources of the Nation’s Outer Continental Shelf, Feb. 2006, at 1 (Oil-
equivalent gas is a volume of gas (associated and/or nonassociated) expressed in terms of its energy equivalence to
oil (i.e. 5,620 cubic feet of gas per barrel of oil) and is reported in barrels.”). Thus if the cost is $10.44 per barrel of
oil equivalent, the calculation is $10.44 / 5,620 cubic feet per barrel of oil equivalent * 1,000 cubic feet = $1.86 per
1,000 cubic feet of natural gas.
54
$10.44 per barrel of oil / 7 years = $1.49 per barrel of oil per year, and $1.86 per 1,000 cf / 7 years = $0.27 per
1,000 cf per year.
55
Chevron Testimony, supra note, at 6 (“Once in production, Tahiti is expected to produce for up to 30 years.”).
21
analysis uses the Tahiti project numbers—an average initial investment period of seven years
followed by an average production period of 30 years—as indicative of the “typical” offshore
project.
The speed of OCS development also factors into the analysis. Because most areas of the
U.S. OCS have been closed to new exploration and production for almost forty years, it is
unclear how quickly firms would move to develop new offshore fields. Given its large potential
reserves, however, the OCS is sure to attract significant investment. Without the benefit of
government data, a rough estimate suggests that annual total investment in OCS fields would be
$9.09 billion per year.
57
My February 2009 report entitled “The Economic Contribution of Increased Offshore Oil
Exploration and Production to Regional and National Economies,”
58
applied the RIMS II model
to assess the economic consequences of allowing oil and gas exploration and production in the
designated OCS Planning Areas located between 3 and 200 miles off the coast of 20 U.S. States.
The economic analysis was based on assessing the economic activity generated during the three
phases of development in the oil and gas industry and breaking those economic effects into
short- and long-term dynamics.
56
See Minerals Management Service, Deepwater Gulf of Mexico 2008: America’s Offshore Energy Future, OCS
Report MMS 2008-13, May 2008 [hereinafter MMS Deep Water 2008], at 77 (showing that the lag between lease
acquisition and production ranges between 2.9 years for the most recent leases presently in production to a high of
14.7 years for leases acquired in 1986-87). The lag between lease acquisition and production is negatively correlated
with the size of the field and is positively correlated with the complexity of each field. This implies that larger fields
are developed sooner and more complex fields are developed later, ceteris paribus.
57
The natural gas investment price is based on the conversion of 5,620 cubic feet of natural gas per 1 barrel of oil
equivalent. One barrel of oil is equal to one barrel of oil equivalent. See MMS, Assessment of Undiscovered
Technically Recoverable Oil and Gas Resources of the Nation’s Outer Continental Shelf, Feb. 2006, at 1 (Oil-
equivalent gas is a volume of gas (associated and/or nonassociated) expressed in terms of its energy equivalence to
oil (i.e. 5,620 cubic feet of gas per barrel of oil) and is reported in barrels.”). Thus if the cost is $10.44 per barrel of
oil equivalent, the calculation is $10.44 / 5,620 cubic feet per barrel of oil equivalent * 1,000 cubic feet = $1.86 per
1,000 cubic feet of natural gas.
58
Joseph R. Mason, “The Economic Contribution of Increased Offshore Oil Exploration and Production,” American
Energy Alliance, Feb. 2009.
22
The following table summarizes my findings of the economic benefits that would accrue
from exploration and production in the OCS on an annual basis in the short-term pre-production
stage and long-term production stage and in terms of output, employment, wages, tax revenue,
and royalties:
Table 3: Summary of the Estimated Economic Effects of
Opening the OCS to Development
Short-Run
Long-Run
Annual Output $73.0 billion
$273.0 billion
Employment 0.27 million
1.20 million
Annual Wages $15.7 billion
$70.0 billion
Annual Federal Tax and Royalty Revenue $11.1 billion
$69.0 billion
Annual State and Local Tax Revenue $4.8 billion
$18.7 billion
Note: Short-run effects are those provided annually during the first seven years of the investment
(pre-production) phase; Long-run effects are those provided annually during the thirty-
year production phase.
Updating the numbers in Table 3 for the present economic environment increases the
estimated effects because of the combined influences of general and energy price inflation. Since
such inflationary influences could be transitory, however, I advance my earlier estimates as more
conservative and representative of the probable policy effects than those updated to the current
economic environment.
Additionally, the estimates in Table 3 do not include lease revenues that would accrue to
the Treasury in the near term. Such revenues would be expected to amount to a sizeable fiscal
fillip for the Treasury, albeit one that has waned significantly in the past several years. In 2008,
the Treasury collected “more than $10 billion in bonus bids paid by companies to lease tracts for
offshore energy exploration on the Outer Continental Shelf in the Gulf of Mexico and Alaska, as
23
well as from onshore lease sales.”
59
In 2009 bonus bid revenues fell to just under $2 billion and
in 2010 they fell further to $1.3 billion.
60
Hence, there is reason to believe that bonus bids would
result in a substantial cash inflow for the Treasury, one that could potentially—given the massive
size of the OCS—make a significant dent in near-term budget deficits.
As before, the BEA data also allow an analysis of the types of employment that would be
supported by increased offshore oil and gas extraction. Increased investment and production in
previously unavailable OCS oil and gas extraction and the ancillary industries that support the
offshore industry would produce thousands of new jobs in stable and valuable industries. Again,
the immediate and the long-run benefits are considered separately. The benefits are broken down
using specific BEA multipliers for each industry, which can be used to determine which
industries will benefit the most from increased offshore oil and gas production.
Table 4, Column A, reports the expected total increase in annual employment over the
first years of the investment phase. Table 4, Column A, gives a sense of the distribution of the
271,572 jobs created in the investment phase and sustained during the first seven years of the
investment cycle. The majority of new positions (162,541 jobs, or 60 percent) would be created
in high-skills fields, such as health care, real estate, professional services, manufacturing,
administration, finance, education, the arts, information, and management. Only about eight
percent of the jobs, 21,550, are directly in the oil and gas sector (mining).
Table 4, Column B reports the estimated total increase in employment over the life of the
production phase. Although the largest total increase in employment would occur (quite
naturally) in the mining industry, that still only accounts for about a quarter of jobs created.
59
“Interior’s Minerals Management Service Disburses Record $23.4 Billion in FY 2008,” U.S. Department of the
Interior News, November 20, 2008.
60
Department of the Interior, Office of natural Resources revenue, at
/>&yeartype=FY&year=2006&datetype=AY .
24
Significant numbers of jobs would be created in other industries, many of those in high-skills
fields. These high-skills sectors represent approximately 49 percent of all new jobs and
approximately 61 percent of all new non-mining jobs.
61
Table 4: Changes in Employment from Production in
Previously Unavailable OCS Planning Areas and Ongoing Refining
Industry
(A)
Short-term
Employment
Increase
(B)
Long-term
Employment
Increase
Mining 21,550 236,075
Health care and social assistance 20,760 125,430
Retail trade 10,343 117,946
Accommodation and food services 7,741 81,487
Real estate and rental and leasing 39,537 80,882
Professional, scientific, and technical services 15,290 74,952
Manufacturing 22,920 69,890
Administrative and waste management services 12,806 69,742
Finance and insurance 8,007 63,081
Other services 14,077 60,236
Transportation and warehousing 11,918 42,206
Wholesale trade 14,238 34,859
Educational services 5,149 31,683
Arts, entertainment, and recreation 12,045 24,005
Information 6,341 20,532
Management of companies and enterprises 19,685 19,184
Agriculture, forestry, fishing, and hunting 5,046 18,269
Construction 12,885 7,609
Households 9,823 7,050
Utilities 1,409 4,867
Total 271,572 1,189,983
Source: U.S. Department of Commerce, Bureau of Economic Analysis.
61
That is, the high-skills industries collectively account for 579,379 new 30-year positions out of a total of
1,189,983 new careers (and 953,908 new
non-mining careers). Thus 579,379 / 1,189,983 = 0.49 and 579,379 / 953,908 = 0.61