Tensions from the Two-Speed Recovery Unemployment, Commodities, and Capital Flows ppt
Bạn đang xem bản rút gọn của tài liệu. Xem và tải ngay bản đầy đủ của tài liệu tại đây (4.2 MB, 242 trang )
WORLD ECONOMIC OUTLOOK
April 2011
Tensions from the Two-Speed Recovery
Unemployment, Commodities, and Capital Flows
International Monetary Fund
World Economic and Financial Surveys
©2011 International Monetary Fund
Production: IMF Multimedia Services Division
Cover and Design: Luisa Menjivar and Jorge Salazar
Composition: Maryland Composition
Cataloging-in-Publication Data
World economic outlook (International Monetary Fund)
World economic outlook : a survey by the staff of the International Monetary Fund. —
Washington, DC : International Monetary Fund, 1980–
v. ; 28 cm. — (1981–1984: Occasional paper / International Monetary Fund, 0251-6365).
— (1986– : World economic and financial surveys, 0256-6877)
Semiannual. Some issues also have thematic titles.
Has occasional updates, 1984–
1. Economic development — Periodicals. 2. Economic forecasting — Periodicals.
3. Economic policy — Periodicals. 4. International economic relations — Periodicals.
I. International Monetary Fund. II. Series: Occasional paper (International Monetary Fund).
III. Series: World economic and financial surveys.
HC10.80
ISBN 978-1-61635-059-8
Please send orders to:
International Monetary Fund, Publication Services
P.O. Box 92780, Washington, D.C. 20090, U.S.A.
Tel.: (202) 623-7430 Fax: (202) 623-7201
E-mail:
www.imfbookstore.org
International Monetary Fund | April 2011 iii
Assumptions and Conventions ix
Preface xi
Foreword xiii
Executive Summary xv
Chapter 1. Global Prospects and Policies 1
e Recovery Has Solidifi ed, but Unemployment Remains High 1
Financial Conditions Are Improving 1
Commodity Prices Are Resurgent 5
e Recovery Is Expected to Solidify 7
Risks Are Smaller but Remain to the Downside 10
Diff erences in the Pace of Activity Present Short-Term Policy Challenges 13
Advanced Economies Need to Repair Public and Financial Balance Sheets 14
Emerging Market Economies Need to Guard against Overheating and Credit Booms 18
Global Demand Rebalancing Is Not Progressing 23
Unemployment Needs to Be Reduced 26
Policies Are Not Yet Suffi ciently Proactive 27
Appendix 1.1. Financial Conditions Indices 28
Appendix 1.2. Commodity Market Developments and Prospects 30
References 56
Chapter 2. Country and Regional Perspectives 59
Recovery Proceeds in the United States 60
A Gradual and Uneven Recovery Is under Way in Europe 64
A Moderate Recovery Continues in the Commonwealth of Independent States 69
Rapid Growth Continues in Asia 72
Latin America Faces Buoyant External Conditions 76
Growth Has Returned to Precrisis Rates in Many African Countries 79
e Recovery in the Middle East and North Africa Region Faces an Uncertain Environment 82
References 88
Chapter 3. Oil Scarcity, Growth, and Global Imbalances 89
What Are the Main Findings? 90
Has Oil Become a Scarce Resource? 90
Oil Scarcity and the Global Economy 101
Implications for the Outlook and Policies 109
Appendix 3.1. Low-Frequency Filtering for Extracting Business Cycle Trends 112
Appendix 3.2. e Energy and Oil Empirical Models 112
References 123
CONTENTS
WORLD ECONOMIC OUTLOOK: TENSIONS FROM THE TWO-SPEED RECOVERY
iv International Monetary Fund | April 2011
Chapter 4. International Capital Flows: Reliable or Fickle? 125
What Are the Main Findings? 129
Trends in Net Capital Flows: Size, Composition, Volatility, and Persistence 130
Capital Flows and the Global Environment 134
Does Direct Financial Exposure Aff ect the Response of Private Capital Flows to Changes in U.S.
Monetary Policy? 137
Policy Implications and Conclusions 148
Appendix 4.1. Classifi cation of Economies and Data Sources 148
Appendix 4.2. Composition, Volatility, and Persistence of Net Private Capital Flows
across Emerging Market Regions 152
Appendix 4.3. Global Factor Model 153
Appendix 4.4. Regression Methodology and Robustness Checks 155
References 161
Annex: IMF Executive Board Discussion of the Outlook, March 2011 165
Statistical Appendix 167
Assumptions 167
What’s New 168
Data and Conventions 168
Classifi cation of Countries 169
General Features and Composition of Groups in the World Economic Outlook Classifi cation 169
Table A. Classifi cation by World Economic Outlook Groups and eir Shares in Aggregate GDP,
Exports of Goods and Services, and Population, 2009 171
Table B. Advanced Economies by Subgroup 172
Table C. European Union 172
Table D. Emerging and Developing Economies by Region and Main Source of Export Earnings 173
Table E. Emerging and Developing Economies by Region, Net External Position,
and Status as Heavily Indebted Poor Countries 174
Box A1. Economic Policy Assumptions Underlying the Projections for Selected Economies 176
List of Tables 180
Output (Tables A1–A4) 181
Infl ation (Tables A5–A7) 189
Financial Policies (Table A8) 195
Foreign Trade (Table A9) 196
Current Account Transactions (Tables A10–A12) 198
Balance of Payments and External Financing (Tables A13–A15) 204
Flow of Funds (Tables A16) 208
Medium-Term Baseline Scenario (Table A17) 212
World Economic Outlook, Selected Topics 213
Boxes
Box 1.1. House Price Busts in Advanced Economies: Repercussions for Global Financial Markets 43
Box 1.2. World Economic Outlook Downside Scenarios 47
Box 1.3. International Spillovers and Macroeconomic Policymaking 50
Box 1.4. Did the Plaza Accord Cause Japan’s Lost Decades? 53
CONTENTS
International Monetary Fund | April 2011 v
CONTENTS
Box 2.1. Unwinding External Imbalances in the European Union Periphery 86
Box 3.1. Life Cycle Constraints on Global Oil Production 115
Box 3.2. Unconventional Natural Gas: A Game Changer? 118
Box 3.3. Short-Term E ects of Oil Shocks on Economic Activity 121
Box A1. Economic Policy Assumptions Underlying the Projections for Selected Economies 176
Tables
Table 1.1. Overview of the World Economic Outlook Projections 2
Table 1.2. Global Oil Demand and Production by Region 33
Table 1.3. Consumption of Base Metals 37
Table 1.4. Annual Price Changes for Key Commodities 42
Table 1.5. Trade Balance Impact of Higher Prices 42
Table 1.1.1. Cross-Country Financial Market Synchronization 45
Table 2.1. Selected Advanced Economies: Real GDP, Consumer Prices, Current Account
Balance, and Unemployment 63
Table 2.2. Selected European Economies: Real GDP, Consumer Prices, Current Account
Balance, and Unemployment 67
Table 2.3. Commonwealth of Independent States: Real GDP, Consumer Prices, Current
Account Balance, and Unemployment 71
Table 2.4. Selected Asian Economies: Real GDP, Consumer Prices, Current Account
Balance, and Unemployment 73
Table 2.5. Selected Western Hemisphere Economies: Real GDP, Consumer Prices, Current
Account Balance, and Unemployment 78
Table 2.6. Selected Sub-Saharan African Economies: Real GDP, Consumer Prices, Current
Account Balance, and Unemployment 81
Table 2.7. Selected Middle East and North African Economies: Real GDP, Consumer Prices,
Current Account Balance, and Unemployment 83
Table 3.1. Oil Demand Price and Income Elasticities 97
Table 3.2. Oil Demand Price and Income Elasticities, Including Oil-Exporting Economies 113
Table 3.3. Oil Demand Price and Income Elasticities in the Extended Sample 114
Table 3.4. Oil Demand Price and Income Short-Term Elasticities: High versus Low Oil Price
Environments 114
Table 3.2.1. Unconventional Natural Gas Resources, 2009 118
Table 3.2.2. Composition of Wholesale Gas Transactions: United States and Europe, 2007 120
Table 3.3.1. Annualized Percent Impact of a 10 Percent Oil Price Increase on Real U.S. GDP
Growth after One Year 122
Table 4.1. Economy Groupings 150
Table 4.2. Data Sources 151
Table 4.3. Baseline Results 157
Table 4.4. U.S. Direct Financial Exposure Weight 158
Table A1. Summary of World Output 181
Table A2. Advanced Economies: Real GDP and Total Domestic Demand 182
Table A3. Advanced Economies: Components of Real GDP 183
Table A4. Emerging and Developing Economies: Real GDP 185
Table A5. Summary of In ation 189
Table A6. Advanced Economies: Consumer Prices 190
WORLD ECONOMIC OUTLOOK: TENSIONS FROM THE TWO-SPEED RECOVERY
vi International Monetary Fund | April 2011
Table A7. Emerging and Developing Economies: Consumer Prices 191
Table A8. Major Advanced Economies: General Government Fiscal Balances and Debt 195
Table A9. Summary of World Trade Volumes and Prices 196
Table A10. Summary of Balances on Current Account 198
Table A11. Advanced Economies: Balance on Current Account 199
Table A12. Emerging and Developing Economies: Balance on Current Account 200
Table A13. Emerging and Developing Economies: Net Financial Flows 204
Table A14. Emerging and Developing Economies: Private Financial Flows 205
Table A15. Emerging and Developing Economies: Reserves 206
Table A16. Summary of Sources and Uses of World Savings 208
Table A17. Summary of Word Medium-Term Baseline Scenario 212
Online Tables
Table B1. Advanced Economies: Unemployment, Employment, and Real per Capita GDP
Table B2. Emerging and Developing Economies: Real GDP
Table B3. Advanced Economies: Hourly Earnings, Productivity, and Unit Labor Costs
in Manufacturing
Table B4. Emerging and Developing Economies: Consumer Prices
Table B5. Summary of Financial Indicators
Table B6. Advanced Economies: General and Central Government Net Lending/Borrowing
and Excluding Social Security Schemes
Table B7. Advanced Economies: General Government Structural Balances
Table B8. Advanced Economies: Exchange Rates
Table B9. Emerging and Developing Economies: General Government Net Lending/Borrowing
and Overall Fiscal Balance
Table B10. Emerging and Developing Economies: Broad Money Aggregates
Table B11. Advanced Economies: Export Volumes, Import Volumes, and Terms of Trade
in Goods and Services
Table B12. Emerging and Developing Economies by Region: Total Trade in Goods
Table B13. Emerging and Developing Economies by Source of Export Earnings:
Total Trade in Goods
Table B14. Advanced Economies: Current Account Transactions
Table B15. Emerging and Developing Economies: Balances on Current Account
Table B16. Emerging and Developing Economies by Region: Current Account Transactions
Table B17. Emerging and Developing Economies by Analytical Criteria:
Current Account Transactions
Table B18. Summary of Balance of Payments, Financial Flows, and External Financing
Table B19. Emerging and Developing Economies by Region: Balance of Payments
and External Financing
Table B20. Emerging and Developing Economies by Analytical Criteria: Balance of Payments
and External Financing
Table B21. Summary of External Debt and Debt Service
Table B22. Emerging and Developing Economies by Region: External Debt by Maturity
and Type of Creditor
Table B23. Emerging and Developing Economies by Analytical Criteria: External Debt,
by Maturity and Type of Creditor
Table B24. Emerging and Developing Economies: Ratio of External Debt to GDP
CONTENTS
International Monetary Fund | April 2011 vii
CONTENTS
Table B25. Emerging and Developing Economies: Debt-Service Ratios
Table B26. Emerging and Developing Economies, Medium-Term Baseline Scenario:
Selected Economic Indicators
Figures
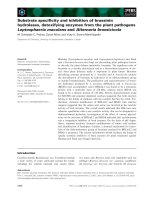
Figure 1.1. Global Indicators 3
Figure 1.2. Recent Financial Market Developments 4
Figure 1.3. Emerging Market Conditions 5
Figure 1.4. Developments in Mature Credit Markets 6
Figure 1.5. Current and Forward-Looking Trade Indicators 7
Figure 1.6. Global Outlook 8
Figure 1.7. Current and Forward-Looking Growth Indicators 9
Figure 1.8. Prospects for Near-Term Activity 10
Figure 1.9. Balance Sheets and Saving Rates 11
Figure 1.10. Global In ation 12
Figure 1.11. Measures of Monetary Policy and Liquidity in Selected Advanced and
Emerging Economes 13
Figure 1.12. General Government Fiscal Balances and Public Debt 14
Figure 1.13. Risks to the Global Outlook 15
Figure 1.14. Emerging Tensions 19
Figure 1.15. Overheating Indicators and Capital In ows 20
Figure 1.16. Emerging Market Economies with Strong Credit Expansion 21
Figure 1.17. Global Imbalances 23
Figure 1.18. External Developments 24
Figure 1.19. Unemployment 26
Figure 1.20. Financial Conditions Indices 29
Figure 1.21. Commodity Prices 31
Figure 1.22. World Energy Market Developments 34
Figure 1.23. Developments in Base Metal Markets 36
Figure 1.24. Developments in Markets for Major Food Crops 38
Figure 1.25. Changes in International and Domestic Food Prices and Headline In ation 39
Figure 1.26. First-Round Impact of Commodity Price Changes on the Trade Balances of
Selected Emerging and Developing Economies 41
Figure 1.1.1. Financial Disruptions 43
Figure 1.1.2. E ect of Advanced Economy House Price Busts 44
Figure 1.2.1. WEO Downside Scenario 1: Implications of Overestimating Potential Output 48
Figure 1.2.2. WEO Downside Scenario 2: Implications of Overestimating Potential Output
with Sticky In ation 49
Figure 1.3.1. Optimized Exchange Rate Coe cient and Relative Loss as a Function
of Home Output Gap Response 51
Figure 1.4.1. Japan: Selected Macroeconomic Indicators 54
Figure 1.4.2. Japan and China: Balance Sheets and Export Content 55
Figure 2.1. Global Average Projected Real GDP Growth during 2011–12 59
Figure 2.2. Output Gaps 60
Figure 2.3. United States and Canada: Average Projected Real GDP Growth during 2011–12 61
Figure 2.4. United States: Gaining Traction 62
Figure 2.5. Europe: Average Projected Real GDP Growth during 2011–12 65
WORLD ECONOMIC OUTLOOK: TENSIONS FROM THE TWO-SPEED RECOVERY
viii International Monetary Fund | April 2011
Figure 2.6. Europe: A Gradual and Uneven Recovery Continues 66
Figure 2.7. Commonwealth of Independent States: Average Projected Real GDP Growth
during 2011–12 69
Figure 2.8. Commonwealth of Independent States: A Moderate Recovery Is under Way 70
Figure 2.9. Asia: Average Projected Real GDP Growth during 2011–12 72
Figure 2.10. Asia: Still in the Lead 74
Figure 2.11. Latin America and the Caribbean: Average Projected Real GDP Growth
during 2011–12 76
Figure 2.12. Latin America and the Caribbean: Icarus or Daedalus? 77
Figure 2.13. Sub-Saharan Africa: Average Projected Real GDP Growth during 2011–12 79
Figure 2.14. Sub-Saharan Africa: Back to Precrisis Growth 80
Figure 2.15. Middle East and North Africa: Average Projected Real GDP Growth
during 2011–12 82
Figure 2.16. Middle East and North Africa: e Recovery Continues in an
Uncertain Environment 84
Figure 2.1.1. Economic Activity and External Adjustment in the EU Periphery 86
Figure 2.1.2. External Adjustment in the EU Periphery 87
Figure 3.1. Energy Prices and Long-Term Price Trends 92
Figure 3.2. Global Energy Demand, 1980–2008 93
Figure 3.3. Relationship between per Capita Energy Consumption and GDP Growth 94
Figure 3.4. Primary Energy Consumption 95
Figure 3.5. Oil Consumption in China and in Selected Advanced Economies 96
Figure 3.6. e Big Switch: Oil Share in the Electric Power Sector 98
Figure 3.7. Global Oil Market Developments 99
Figure 3.8. Projected Growth in Crude Oil Capacity 100
Figure 3.9. Oil Scarcity and the Global Economy: Benchmark Scenario 102
Figure 3.10. Alternative Scenario 1: Greater Substitution away from Oil 105
Figure 3.11. Alternative Scenario 2: Greater Decline in Oil Production 107
Figure 3.12. Alternative Scenario 3: Greater Economic Role for Oil 108
Figure 3.1.1. Life Cycle of Global Oil Production 115
Figure 3.2.1. U.S. Natural Gas Supply, 1998–2009 119
Figure 3.2.2. U.S. Natural Gas versus Oil Spot Prices 120
Figure 4.1. e Collapse and Recovery of Cross-Border Capital In ows 126
Figure 4.2. e Evolution of Gross and Net Capital Flows 127
Figure 4.3. e Recovery of Net Private Capital Flows 128
Figure 4.4. e Recovery of Net Capital Flows and eir Composition 131
Figure 4.5. e Size and Composition of Net Private Capital Flows during Waves
of Large Capital Flows to Emerging Market Economies 132
Figure 4.6. Regional Variation in Net Private Capital Flows to Emerging Market Economies 133
Figure 4.7. e Relative Importance of Various Types of Flow 134
Figure 4.8. Historical Trends: A Shift away from Debt-Creating Flows 135
Figure 4.9. e Volatility of Net Private Capital Flows 136
Figure 4.10. Correlations between Net Flows of Various Types and the Rest
of the Financial Account 137
Figure 4.11. e Persistence of Net Private Capital Flows 138
Figure 4.12. Historical Periods of Easy External Financing and High Growth Di erential
between Emerging Market and Advanced Economies 139
CONTENTS
International Monetary Fund | April 2011 ix
Figure 4.13. Net Private Capital Flows during Periods of Easy External Financing and
High Growth Di erential between Emerging Market and Advanced Economies 140
Figure 4.14. Net Private Flows to Emerging Market Economies under Alternative
Financing Conditions 141
Figure 4.15. Common Factors Underlying the Variation in Net Private Capital Flows
to Advanced and Emerging Market Economies 142
Figure 4.16. Di erence in the Response of Net Private Capital Flows to U.S. Monetary
Tightening across Economies 143
Figure 4.17. Di erence in the Response of Emerging Market Economy Net Private
Capital Flows to U.S. Monetary Tightening by Selected Economic Characteristics 145
Figure 4.18. Di erence in the Response of Emerging Market Economy Net Private
Capital Flows to U.S. Monetary Tightening by Type of Flow 146
Figure 4.19. Di erence in the Response of Emerging Market Economy Net Private
Capital Flows to U.S. Monetary Tightening under Alternative Global Economic Conditions 147
Figure 4.20. e Relative Importance of Various Types of Flow across Emerging Market Regions 153
Figure 4.21. e Volatility of Net Private Capital Flows across Emerging Market Regions 154
Figure 4.22. e Persistence of Net Private Capital Flows across Emerging Market Regions 155
Figure 4.23. Realized and Unanticipated Changes in U.S. Monetary Policy over Time 159
Figure 4.24. Robustness Checks for the Di erence in Response of Net Private Capital
Flows to Directly Financially Exposed Emerging Market Economies 160
International Monetary Fund | April 2011 xi
A number of assumptions have been adopted for the projections presented in the World Economic Outlook.
It has been assumed that real e ective exchange rates remained constant at their average levels during February
8–March 8, 2011, except for the currencies participating in the European exchange rate mechanism II (ERM
II), which are assumed to have remained constant in nominal terms relative to the euro; that established poli-
cies of national authorities will be maintained (for speci c assumptions about scal and monetary policies for
selected economies, see Box A1); that the average price of oil will be $107.16 a barrel in 2011 and $108.00
a barrel in 2012 and will remain unchanged in real terms over the medium term; that the six-month London
interbank o ered rate (LIBOR) on U.S. dollar deposits will average 0.6 percent in 2011 and 0.9 percent in
2012; that the three-month euro deposit rate will average 1.7 percent in 2011 and 2.6 percent in 2012; and
that the six-month Japanese yen deposit rate will yield on average 0.6 percent in 2011 and 0.3 percent in
2012. ese are, of course, working hypotheses rather than forecasts, and the uncertainties surrounding them
add to the margin of error that would in any event be involved in the projections. e estimates and projec-
tions are based on statistical information available through late March 2011.
e following conventions are used throughout the World Economic Outlook:
. . . to indicate that data are not available or not applicable;
– between years or months (for example, 2010–11 or January–June) to indicate the years or months
covered, including the beginning and ending years or months;
/ between years or months (for example, 2010/11) to indicate a scal or nancial year.
“Billion” means a thousand million; “trillion” means a thousand billion.
“Basis points” refer to hundredths of 1 percentage point (for example, 25 basis points are equivalent to ¼ of
1 percentage point).
WEO aggregated data excludes Libya for projection years due to the uncertain political situation.
Except for GDP growth and in ation, projections for Côte d’Ivoire are not shown due to the uncertain
political situation.
In gures and tables, shaded areas indicate IMF sta projections.
If no source is listed on tables and gures, data are drawn from the WEO database.
When countries are not listed alphabetically, they are ordered on the basis of economic size.
Minor discrepancies between sums of constituent gures and totals shown re ect rounding.
As used in this report, the terms “country” and “economy” do not in all cases refer to a territorial entity that
is a state as understood by international law and practice. As used here, the term also covers some territorial
entities that are not states but for which statistical data are maintained on a separate and independent basis.
Composite data are provided for various groups of countries organized according to economic characteris-
tics or region. Unless otherwise noted, country group composites represent calculations based on 90 percent or
more of the weighted group data.
e country group composites for scal data are calculated as the sum of the U.S dollar values for the
relevant individual countries. is di ers from the calculations in the October 2010 and earlier issues of the
World Economic Outlook, for which the composites were weighted by GDP valued at purchasing power parities
(PPPs) as a share of total world GDP.
e boundaries, colors, denominations, and any other information shown on the maps do not imply, on
the part of the International Monetary Fund, any judgment on the legal status of any territory or any endorse-
ment or acceptance of such boundaries.
ASSUMPTIONS AND CONVENTIONS
WORLD ECONOMIC OUTLOOK: TENSIONS FROM THE TWO-SPEED RECOVERY
xii International Monetary Fund | April 2011
FURTHER INFORMATION AND DATA
is version of the World Economic Outlook is available in full on the IMF’s website, www.imf.org. Accom-
panying it on the website is a larger compilation of data from the WEO database than is included in the
report itself, including les containing the series most frequently requested by readers. ese les may be
downloaded for use in a variety of software packages.
Inquiries about the content of the World Economic Outlook and the WEO database should be sent by mail,
forum, or fax (telephone inquiries cannot be accepted) to
World Economic Studies Division
Research Department
International Monetary Fund
700 19th Street, N.W.
Washington, D.C. 20431, U.S.A.
Forum address: www.imf.org/weoforum
Fax: (202) 623-6343
FURTHER INFORMATION AND DATA
International Monetary Fund | April 2011 xiii
e analysis and projections contained in the World Economic Outlook are integral elements of the IMF’s
surveillance of economic developments and policies in its member countries, of developments in international
nancial markets, and of the global economic system. e survey of prospects and policies is the product
of a comprehensive interdepartmental review of world economic developments, which draws primarily on
information the IMF sta gathers through its consultations with member countries. ese consultations are
carried out in particular by the IMF’s area departments—namely, the African Department, Asia and Paci c
Department, European Department, Middle East and Central Asia Department, and Western Hemisphere
Department—together with the Strategy, Policy, and Review Department; the Monetary and Capital Markets
Department; and the Fiscal A airs Department.
e analysis in this report was coordinated in the Research Department under the general direction
of Olivier Blanchard, Economic Counsellor and Director of Research. e project was directed by Jörg
Decressin, Senior Advisor, Research Department, and Petya Koeva Brooks, Division Chief, Research Depart-
ment. e primary contributors to this report are Abdul Abiad, John Bluedorn, Rupa Duttagupta, Jaime
Guajardo, omas Helbling, Joong Shik Kang, Michael Kumhof, Dirk Muir, Andrea Pescatori, Shaun Roache,
John Simon, and Petia Topalova. Other contributors include Joshua Felman, Benjamin Hunt, Florence
Jaumotte, Mika Kortelainen, Daniel Leigh, Troy Matheson, Stephen Snudden, Marco Terrones, and Robert
Tetlow. Kevin Clinton provided comments and suggestions. Toh Kuan, Gavin Asdorian, Shan Chen, Angela
Espiritu, Murad Omoev, Andy Salazar, Min Kyu Song, Ercument Tulun, Jessie Yang, Nese Erbil, David
Reichsfeld, and Marina Rousset provided research assistance. Saurabh Gupta, Mahnaz Hemmati, Laurent
Meister, Emory Oakes, and Steve Zhang managed the database and the computer systems. Tita Gunio, Shanti
Karunaratne, and Cristina Tumale were responsible for word processing. Linda Gri n Kean of the External
Relations Department edited the manuscript and coordinated the production of the publication. Addi-
tional technical support was provided by external consultants Vladimir Bougay, Anastasia Francis, Aleksandr
Gerasimov, Wendy Mak, Shamiso Mapondera, Nhu Nguyen, and Pavel Pimenov.
e analysis has bene ted from comments and suggestions by sta from other IMF departments, as well as
by Executive Directors following their discussion of the report on March 28, 2011. However, both projections
and policy considerations are those of the IMF sta and should not be attributed to Executive Directors or to
their national authorities.
PREFACE
International Monetary Fund | April 2011 xv
FOREWORD
T
he world economic recovery continues,
more or less as predicted. Indeed, our
growth forecasts are nearly unchanged
since the January 2011 WEO Update
and can be summarized in three numbers: We
expect the world economy to grow at about 4½
percent a year in both 2011 and 2012, but with
advanced economies growing at only 2½ percent
while emerging and developing economies grow at a
much higher 6½ percent.
Earlier fears of a double-dip recession—which
we did not share—have not materialized. e main
worry was that in advanced economies, after an ini-
tial recovery driven by the inventory cycle and scal
stimulus, growth would zzle. e inventory cycle
is now largely over and scal stimulus has turned to
scal consolidation, but private demand has, for the
most part, taken the baton.
Fears have turned to commodity prices. Com-
modity prices have increased more than expected,
re ecting a combination of strong demand growth
and supply shocks. Although these increases conjure
up the specter of 1970s-style stag ation, they
appear unlikely to derail the recovery. In advanced
economies, the decreasing share of oil, the disap-
pearance of wage indexation, and the anchoring
of in ation expectations all combine to suggest
there will be only small e ects on growth and core
in ation. e challenge will be stronger however
in emerging and developing economies, where the
consumption share of food and fuel is larger and
the credibility of monetary policy is often weaker.
In ation may well be higher for some time but,
as our forecasts suggest, we do not expect a major
adverse e ect on growth. However, risks to the
recovery from additional disruptions to oil supply
are a concern.
e recovery, however, remains unbalanced.
In most advanced economies, output is still far
below potential. Unemployment is high, and low
growth implies that it will remain so for many years
to come. e source of low growth can be traced to
both precrisis excesses and crisis wounds: In many
countries, especially the United States, the housing
market is still depressed, leading to anemic housing
investment. e crisis itself has led to a dramatic
deterioration in scal positions, forcing a shift to
scal consolidation while not eliminating market
worries about scal sustainability. And in many
countries banks are struggling to achieve higher
capital ratios in the face of increasing nonperform-
ing loans.
e problems of the European Union periph-
ery, stemming from the combined interactions of
low growth, scal woes, and nancial pressures,
are particularly acute. Reestablishing scal and
nancial sustainability in the face of low or nega-
tive growth and high interest rates is a substantial
challenge. And, while extreme, the problems of the
EU periphery point to a more general problem: an
underlying low rate of growth of potential output.
Adjustment is very hard when growth is very low.
e policy advice to advanced economies remains
largely the same as in the October 2010 World
Economic Outlook, and so far has been only partly
heeded: increased clarity on banks’ balance sheet
exposures and ready recapitalization plans if needed;
smart scal consolidation that is neither too fast,
which could kill growth, nor too slow, which would
kill credibility; the redesign of nancial regula-
tion and supervision; and, especially in Europe,
an increased focus on reforms to increase potential
growth.
In emerging market economies, by contrast,
the crisis left no lasting wounds. eir initial scal
and nancial positions were typically stronger, and
the adverse e ects of the crisis were more muted.
High underlying growth and low interest rates are
making scal adjustment much easier. Exports have
largely recovered, and whatever shortfall in external
demand they experienced has typically been made
up through increases in domestic demand. Capital
WORLD ECONOMIC OUTLOOK: TENSIONS FROM THE TWO-SPEED RECOVERY
xvi International Monetary Fund | April 2011
out ows have turned into capital in ows, due to
both better growth prospects and higher interest
rates than in the advanced economies.
e challenge for most emerging market
economies is thus quite di erent from that of
the advanced economies—namely, how to avoid
overheating in the face of closing output gaps and
higher capital ows. eir response should be
twofold: rst, to rely on a combination of scal
consolidation and higher interest rates to maintain
output at potential and, second, to use macropru-
dential tools—including, where needed, capital con-
trols—to avoid increases in systemic risk stemming
from in ows. Countries are often tempted to resist
the exchange rate appreciation that is likely to come
with higher interest rates and higher in ows. But
appreciation increases real income, is part of the
desirable adjustment, and should not be resisted.
Overall, the macro policy agenda for the world
economy remains the same but, with the passage of
time, more urgent. For the recovery to be sustained,
advanced economies must achieve scal consolida-
tion. To do this and to maintain growth, they need
to rely more on external demand. Symmetrically,
emerging market economies must rely less on
external demand and more on domestic demand.
Appreciation of emerging market economies’ cur-
rencies relative to those of advanced economies is an
important key to this global adjustment. e need
for careful design at the national level and coordina-
tion at the global level may be as important today
as at the peak of the crisis two years ago.
Olivier Blanchard
Economic Counsellor
International Monetary Fund | April 2011 xvii
T
he recovery is gaining strength, but
unemployment remains high in advanced
economies, and new macroeconomic
risks are building in emerging market
economies. In advanced economies, the hand-
o from public to private demand is advancing,
reducing concerns that diminishing scal policy
support might cause a “double-dip” recession.
Financial conditions continue to improve, although
they remain unusually fragile. In many emerging
market economies, demand is robust and over-
heating is a growing policy concern. Developing
economies, particularly in sub-Saharan Africa, have
also resumed fast and sustainable growth. Rising
food and commodity prices pose a threat to poor
households, adding to social and economic tensions,
notably in the Middle East and North Africa. Oil
price increases since January 2011 and information
on supply, including on spare capacity, suggest that
the disruptions so far would have only mild e ects
on economic activity. An earthquake in Japan has
exacted a terrible human toll. Its macroeconomic
impact is projected to be limited, although uncer-
tainty remains elevated. Overall, with the recovery
stronger on the one hand but oil supply growth
lower on the other, projections for global real GDP
growth in 2011–12 are little changed from the
January 2011 WEO Update. But downside risks
have risen.
World real GDP growth is forecast to be about
4½ percent in 2011 and 2012, down modestly from
5 percent in 2010. Real GDP in advanced economies
and emerging and developing economies is expected
to expand by about 2½ percent and 6½ percent,
respectively. Downside risks continue to outweigh
upside risks. In advanced economies, weak sovereign
balance sheets and still-moribund real estate markets
continue to present major concerns, especially in
certain euro area economies; nancial risks are also to
the downside as a result of the high funding require-
ments of banks and sovereigns. New downside risks
are building on account of commodity prices, nota-
bly for oil, and, relatedly, geopolitical uncertainty,
as well as overheating and booming asset markets in
emerging market economies. However, there is also
the potential for upside surprises to growth in the
short term, owing to strong corporate balance sheets
in advanced economies and buoyant demand in
emerging and developing economies.
Many old policy challenges remain unaddressed
even as new ones come to the fore. In advanced
economies, strengthening the recovery will require
keeping monetary policy accommodative as long as
wage pressures are subdued, in ation expectations
are well anchored, and bank credit is sluggish. At
the same time, scal positions need to be placed on
sustainable medium-term paths by implementing
scal consolidation plans and entitlement reforms
supported by stronger scal rules and institutions.
is need is particularly urgent in the United States
to stem the risk of globally destabilizing changes in
bond markets. e U.S. policy plans for 2011 have
actually switched back from consolidation to expan-
sion. E orts should be made to reduce the pro-
jected de cit for scal year 2011. Measures to trim
discretionary spending are a move in this direction.
However, to make a sizable dent in the projected
medium-term de cits, broader measures such as
Social Security and tax reforms will be essential. In
Japan, the immediate scal priority is to support
reconstruction. Once reconstruction e orts are under
way and the size of the damage is better understood,
attention should turn to linking reconstruction
spending to a clear scal strategy for bringing down
the public debt ratio over the medium term. In
the euro area, despite signi cant progress, markets
remain apprehensive about the prospects of countries
under market pressure. For them what is needed at
the euro area level is su cient, low-cost, and exible
funding to support strong scal adjustment, bank
restructuring, and reforms to promote competitive-
ness and growth. More generally, greater trust needs
to be reestablished in euro area banks through ambi-
tious stress tests and restructuring and recapitalization
EXECUTIVE SUMMARY
WORLD ECONOMIC OUTLOOK: TENSIONS FROM THE TWO-SPEED RECOVERY
xviii International Monetary Fund | April 2011
programs. Moreover, reform of the global nancial
system remains very much a work in progress.
e challenge for many emerging and some devel-
oping economies is to ensure that present boom-like
conditions do not develop into overheating over
the coming year. In ation pressure is likely to build
further as growing production comes up against
capacity constraints, with large food and energy
price increases, which weigh heavily in consump-
tion baskets, motivating demands for higher wages.
Real interest rates are still low and scal policies
appreciably more accommodative than before the
crisis. Appropriate action di ers across economies,
depending on their cyclical and external conditions.
However, a tightening of macroeconomic policies is
needed in many emerging market economies.
• For external surplus economies, many of which
manage their currencies and do not face fiscal
problems, removal of monetary accommodation
and appreciation of the exchange rate are necessary
to maintain internal balance––reining in inflation
pressure and excessive credit growth––and assist in
global demand rebalancing.
• Many external deficit economies need to tighten
fiscal and monetary policies, possibly tolerating
some overshooting of the exchange rate in the
short term.
• For some surplus and deficit economies, rapid
credit and asset price growth warn of a threat to
financial stability. Policymakers in these economies
will need to act soon to safeguard stability and
build more resilient financial systems.
• Many emerging and developing economies will
need to provide well-targeted support for poor
households that struggle with high food prices.
Capital ows to emerging market economies
resumed remarkably quickly after the crisis. However,
as policy rates in advanced economies rise from their
unusually low levels, volatile ows may again exit the
emerging market economies. Depending on country-
speci c circumstances, and assuming appropriate
macroeconomic and prudential policies are in place,
measures designed to curb capital in ows can play a
role in dampening the impact of their excessive vola-
tility on the real economy. However, such measures
are not a substitute for macroeconomic tightening.
Greater progress in advancing global demand
rebalancing is essential to put the recovery on a
stronger footing over the medium term. is will
require action by many countries, notably scal
adjustment in key external de cit economies and
greater exchange rate exibility and structural reforms
that eliminate distortions that boost savings in key
surplus economies.
ere is broad agreement on the contours of the
policy responses sketched here. However, with the
peak of the crisis now past, the imperative for action
and willingness to cooperate among policymakers
is diminishing. It would be a mistake for advanced
economies to delay scal adjustment in the face of
a di cult political economy at home. Additionally,
while the removal of distortions that boost saving
in key external surplus economies would support
growth and help achieve scal consolidation in key
advanced economies, insu cient progress on one
front should not serve as an excuse for inaction
on the other front. It would also be a mistake for
emerging market economies to delay exchange rate
adjustment in the face of rising in ation pressure.
Many emerging market economies cannot a ord to
delay additional policy tightening until the advanced
economies undertake such tightening themselves.
e task facing policymakers is to convince their
national constituencies that these policy responses
are in their best economic interests, regardless of the
actions others are taking.
1
CHAPTER
International Monetary Fund | April 2011 1
1
CHAPTER
The Recovery Has Solidi ed, but
Unemployment Remains High
e global recovery is continuing broadly as antici-
pated in the October 2010 and January 2011 World
Economic Outlook (WEO) projections (Figure 1.1;
Table 1.1). World growth decelerated to about
3¾ percent during the second half of 2010, from
about 5¼ percent during the fi rst half. is slowdown
refl ects a normal inventory cycle. As fears of a global
depression receded in 2009, businesses at fi rst slowed
their rate of destocking, and then, as confi dence
continued to improve, began to rebuild depleted
inventories. is fostered a sharp rebound in indus-
trial production and trade, which lasted through the
fi rst half of 2010. As this phase progressed, inventory
rebuilding and, as a consequence, industrial produc-
tion and trade moved into lower gear in the second
half of last year. In the meantime, however, reduced
excess capacity, accommodative policies, and further
improvements in confi dence and fi nancial condi-
tions encouraged investment and sharply reduced the
rate of job destruction. Consumption also regained
strength. Consequently, the recovery has become
more self-sustaining, risks of a double-dip recession in
advanced economies have receded, and global activity
seems set to accelerate again.
Nonetheless, the pace of activity remains geo-
graphically uneven, with employment lagging.
• In major advanced economies, economic growth
is modest, especially considering the depth of the
recession, reaching just 3 percent in 2010. In the
United States and the euro area, the economy is
following a path as weak as that following the
recessions of the early 1990s, despite a much
deeper fall (Figure 1.1, middle panel).
• In contrast, many emerging and developing
economies have seen robust growth, reaching
more than 7 percent in 2010, and have low
unemployment rates, although unemployment
tends to disproportionately affect young people.
In a growing number of these economies, there is
evidence of tightening capacity constraints, and
many face large food price increases, which pres-
ent other social challenges.
• Overall, growth is insufficiently strong to make a
major dent in high unemployment rates (Figure
1.1, top panel). Some 205 million people are
still looking for jobs, which is up by about 30
million worldwide since 2007, according to the
International Labor Organization. The increase in
unemployment has been very severe in advanced
economies; in emerging and developing econo-
mies, high youth unemployment is a particular
concern, as noted above.
e recovery is broadly moving at two speeds,
with large output gaps in advanced economies and
closing or closed gaps in emerging and developing
economies, but there are appreciable diff erences
among each set of countries (Chapter 2). Economies
that are running behind the global recovery typically
suff ered large fi nancial shocks during the crisis, often
related to housing booms and high external indebt-
edness. Among the advanced economies, those in
Asia have experienced a strong rebound (Figure 1.1,
bottom left panel). e recovery of euro area econo-
mies that suff ered housing busts or face fi nancial
market pressures has been weaker than in Germany
and some other euro area economies. Among emerg-
ing and developing economies, those in Asia are in
the lead, followed by those in sub-Saharan Africa,
whereas those in eastern Europe are only just begin-
ning to enjoy signifi cant growth.
Financial Conditions Are Improving
Reinforcing and refl ecting generally positive out-
comes, strong profi ts have spurred equity price gains
and lowered bond prices, and volatility has decreased
(Figure 1.2, top and bottom panels). Stock prices
in emerging Asia, Latin America, and the United
States have approached precrisis peaks (Figures 1.2
and 1.3, top panels). Financial stocks in the euro
area, however, have been sluggish, refl ecting contin-
GLOBAL PROSPECTS AND POLICIES
WORLD ECONOMIC OUTLOOK: TENSIONS FROM THE TWO-SPEED RECOVERY
Table 1.1. Overview of the World Economic Outlook Projections
(Percent change unless noted otherwise)
Year over Year
Difference from January
2011 WEO Projections
Q4 over Q4
Projections
Estimates Projections
2009 2010 2011 2012 2011 2012 2010 2011 2012
World Output
1
–0.5 5.0 4.4 4.5 0.0 0.0 4.7 4.5 4.4
Advanced Economies –3.4 3.0 2.4 2.6 –0.1 0.1 2.7 2.6 2.5
United States –2.6 2.8 2.8 2.9 –0.2 0.2 2.7 3.0 2.7
Euro Area
2
–4.1 1.7 1.6 1.8 0.1 0.1 2.0 1.5 2.1
Germany –4.7 3.5 2.5 2.1 0.3 0.1 4.0 1.9 2.5
France –2.5 1.5 1.6 1.8 0.0 0.0 1.5 1.7 2.0
Italy –5.2 1.3 1.1 1.3 0.1 0.0 1.5 1.3 1.2
Spain –3.7 –0.1 0.8 1.6 0.2 0.1 0.6 1.1 1.9
Japan –6.3 3.9 1.4 2.1 –0.2 0.3 2.5 2.5 1.3
United Kingdom –4.9 1.3 1.7 2.3 –0.3 0.0 1.5 2.2 2.4
Canada –2.5 3.1 2.8 2.6 0.5 –0.1 3.2 2.8 2.5
Other Advanced Economies
3
–1.2 5.7 3.9 3.8 0.1 0.1 4.8 4.3 3.7
Newly Industrialized Asian Economies –0.8 8.4 4.9 4.5 0.2 0.2 6.1 5.9 3.8
Emerging and Developing Economies
4
2.7 7.3 6.5 6.5 0.0 0.0 7.4 6.9 6.9
Central and Eastern Europe –3.6 4.2 3.7 4.0 0.1 0.0 3.7 3.7 4.0
Commonwealth of Independent States –6.4 4.6 5.0 4.7 0.3 0.1 4.7 4.5 3.7
Russia –7.8 4.0 4.8 4.5 0.3 0.1 4.7 4.3 3.5
Excluding Russia –3.1 6.0 5.5 5.1 0.4 –0.1 . . . . . . . . .
Developing Asia 7.2 9.5 8.4 8.4 0.0 0.0 9.2 8.4 8.5
China 9.2 10.3 9.6 9.5 0.0 0.0 9.8 9.4 9.5
India 6.8 10.4 8.2 7.8 –0.2 –0.2 9.7 7.7 8.0
ASEAN-5
5
1.7 6.9 5.4 5.7 –0.1 0.0 6.1 5.4 5.6
Latin America and the Caribbean –1.7 6.1 4.7 4.2 0.4 0.1 5.2 5.0 4.6
Brazil –0.6 7.5 4.5 4.1 0.0 0.0 5.0 5.0 4.0
Mexico –6.1 5.5 4.6 4.0 0.4 –0.8 4.4 4.4 3.7
Middle East and North Africa 1.8 3.8 4.1 4.2 –0.5 –0.5 . . . . . . . . .
Sub-Saharan Africa 2.8 5.0 5.5 5.9 0.0 0.1 . . . . . . . . .
Memorandum
European Union –4.1 1.8 1.8 2.1 0.1 0.1 2.1 1.8 2.4
World Growth Based on Market Exchange Rates –2.1 3.9 3.5 3.7 0.0 0.1 . . . . . . . . .
World Trade Volume (goods and services) –10.9 12.4 7.4 6.9 0.3 0.1 . . . . . . . . .
Imports
Advanced Economies –12.6 11.2 5.8 5.5 0.3 0.3 . . . . . . . . .
Emerging and Developing Economies –8.3 13.5 10.2 9.4 0.9 0.2 . . . . . . . . .
Exports
Advanced Economies –12.2 12.0 6.8 5.9 0.6 0.1 . . . . . . . . .
Emerging and Developing Economies –7.5 14.5 8.8 8.7 –0.4 –0.1 . . . . . . . . .
Commodity Prices (U.S. dollars)
Oil
6
–36.3 27.9 35.6 0.8 22.2 0.5 . . . . . . . . .
Nonfuel (average based on world commodity
export weights) –15.8 26.3 25.1 –4.3 14.1 1.3 . . . . . . . . .
Consumer Prices
Advanced Economies 0.1 1.6 2.2 1.7 0.6 0.1 1.6 2.2 1.5
Emerging and Developing Economies
4
5.2 6.2 6.9 5.3 0.9 0.5 6.3 5.9 4.2
London Interbank Offered Rate (percent)
7
On U.S. Dollar Deposits 1.1 0.5 0.6 0.9 –0.1 0.0 . . . . . . . . .
On Euro Deposits 1.2 0.8 1.7 2.6 0.5 0.9 . . . . . . . . .
On Japanese Yen Deposits 0.7 0.4 0.6 0.3 0.0 0.1 . . . . . . . . .
Note: Real effective exchange rates are assumed to remain constant at the levels prevailing during February 8–March 8, 2011. When economies are not listed alphabetically, they are ordered
on the basis of economic size. The aggregated quarterly data are seasonally adjusted.
1
The quarterly estimates and projections account for 90 percent of the world purchasing-power-parity weights.
2
Excludes Estonia.
3
Excludes the United States, Euro Area, and Japan but includes Estonia.
4
The quarterly estimates and projections account for approximately 79 percent of the emerging and developing economies.
5
Indonesia, Malaysia, Philippines, Thailand, and Vietnam.
6
Simple average of prices of U.K. Brent, Dubai, and West Texas Intermediate crude oil. The average price of oil in U.S. dollars a barrel was $79.03 in 2010; the assumed price based on
futures markets is $107.16 in 2011 and $108.00 in 2012.
7
Six-month rate for the United States and Japan. Three-month rate for the Euro Area.
CHAPTER 1 GLOBAL PROSPECTS AND POLICIES
International Monetary Fund | April 2011 3
ued vulnerability to peripheral euro area economies
(Figure 1.2, middle panel). Government bond and
bank credit default swap spreads in peripheral euro
area economies remain high, pointing to signifi cant
vulnerabilities (Figure 1.4, middle panel). Stocks
in Japan are lagging because of the appreciation of
the yen and the impact of the recent earthquake.
Credit growth remains very subdued in the advanced
economies. Bank lending conditions in the major
advanced economies, including those of the euro
area, are slowly easing after a prolonged period of
incremental tightening (Figure 1.4, top panel); for
small and medium-size fi rms, they are easing or
tightening only modestly. In the meantime, credit
growth has again reached high levels in many emerg-
ing market economies, particularly in Asia and Latin
America (Figure 1.3, bottom panel).
Global capital fl ows rebounded sharply following
the collapse during the crisis, but they are still below
precrisis averages in many economies (Figure 1.5,
middle and bottom panels; Chapter 4). Accord-
ingly, stock markets and credit in emerging market
economies have rebounded unusually fast from
deep falls (Box 1.1). Strong growth prospects and
relatively high yields are attracting fl ows into emerg-
ing markets. Sluggish activity and damaged fi nancial
systems continue to depress fl ows between advanced
economies. ese forces raise policy challenges that
are discussed in more detail later in this chapter as
well as in the April 2011 Global Financial Stability
Report.
• Capital flows to some larger emerging market
economies—for example, Brazil, China, India,
Indonesia, Mexico, Peru, Poland, and Turkey––are
all within the range of or above precrisis levels.
The recovery has been led so far by portfolio and
bank flows, with a falling share of foreign direct
investment inflows. These developments mark a
departure from earlier experience and may raise the
risk of future instability, including capital outflows.
However, during fall 2010 the capital-flow-driven
rally in emerging market assets slowed again. Other
regions, such as east and west Africa, have yet to
see much of a rebound in capital inflows.
• Flows between advanced economies have been
hit hard by the financial disintermediation
wrought by the crisis (Figure 1.5, middle panel).
0
2
4
6
8
Figure 1.1. Global Indicators
(Annual percent change unless noted otherwise)
Global activity has evolved broadly in line with the October 2010 WEO forecast.
Growth is low in advanced economies and unemployment is high. In the United
States and the euro area, the recoveries are tracking those of the 1990s, despite
much deeper falls in output during the Great Recession. Emerging and developing
economies that have not been hit hard by the crisis are already in expansionary
territory.
Source: IMF staff estimates.
US: United States; EA/G/F/I/S: euro area/Germany/France/Italy/Spain; JP: Japan; OAAE:
other advanced Asian economies.
EAS: emerging Asia; LA: Latin America; CEE and CIS: central and eastern Europe and
Commonwealth of Independent States; MENA: Middle East and North Africa; SSA:
sub-Saharan Africa. Due to data limitations, annual data are used for MENA and SSA.
2
1
90
95
100
105
110
Change in GDP
1
(2010:Q4 GDP in percent of
2008:Q2 GDP)
US
EAS LA
CEE
and CIS
MENA
-4-202468
98
100
102
104
106
108
110
112
114
-4 -2 0 2 4 6 8
98
100
102
104
106
108
110
112
114
United States
1975:Q1
1982:Q3
1991:Q1
2009:Q2
Output since Trough for Highly Synchronized Recessions
(index; quarters from trough on x-axis)
Euro Area
1975:Q1
1982:Q3
1993:Q1
2009:Q2
Unemployment Rate
2000 05 10 15
5
6
7
8
9
Advanced
economies
Emerging and
developing
economies
GDP Growth
World Advanced
economies
Emg. and
dev. econ.
2010
2011
October 2010 WEO
90
95
100
105
110
115
120
125
130
EA/G/F/I/S JP OAAE SSA
Change in GDP
2
(2010:Q4 GDP in percent of
2008:Q2 GDP)
WORLD ECONOMIC OUTLOOK: TENSIONS FROM THE TWO-SPEED RECOVERY
4 International Monetary Fund | April 2011
Capital flows from the United States have
returned to precrisis levels but have been redi-
rected to emerging market economies and away
from advanced economies. Capital flows from
the euro area, especially via banks, are still well
below precrisis levels. Reduced flows to other
advanced economies account for most of this
reduction, although flows to emerging market
economies are also weak.
Changes in fi nancial conditions are unlikely
to give signifi cant additional support to output
growth over the near term. Given the state of the
“real” recovery, risk aversion and volatility are
already low in the major fi nancial markets, as evi-
denced by the vigorous recovery of equity markets
and a narrowing of credit risk spreads. Although
bank lending conditions in advanced economies
are still far from normal, further progress is likely
to be slow. Securitization markets remain in disre-
pair. Banks will need time to switch toward more
stable deposits and long-term wholesale funding.
Supervision and regulation are being tightened
for good reason. In addition, conditions are likely
to remain volatile because of continued uncer-
tainty about how the crisis in the euro area will
be resolved. Indices of broad fi nancial conditions
compiled by the IMF staff confi rm this qualitative
reading. ey suggest that conditions are easing
slowly and to a similar degree in the United States,
the euro area, and Japan; simple forecasts point to
further, very gradual easing (Figure 1.4, bottom
panel; Appendix 1.1).
Robust capital fl ows to key emerging market
economies may well continue, although questions
about macroeconomic policies and geopolitical
uncertainty could slow fl ows over the near term.
e growth diff erential between these economies
and advanced economies is not forecast to dimin-
ish signifi cantly. Together with emerging economies’
demonstrated resilience during the fi nancial crisis,
this supports further structural reallocation of port-
folios toward these economies. However, uncertainty
about the extent and possibility of policy rate hikes
in the face of rising infl ation may already be acting
as a brake on such fl ows, as is heightened geopo-
litical uncertainty. A strengthening recovery in the
United States, rising yields (Chapter 4), and renewed
90
95
100
105
110
115
30
40
50
60
70
80
90
100
110
120
80
84
88
92
96
100
104
Figure 1.2. Recent Financial Market Developments
MSCI Daily Change Differences
(Jan. 1, 2010 = 100)
World consumer
discretionary
–World total
World financial
–World total
0
10
20
30
40
50
60
70
80
90
Implied Volatility
(percent)
Emerging markets (VXY)
U.S. (VIX)
Mar.
11
DJ Euro
Stoxx
S&P
500
Equity Markets
(2007 = 100; national currency)
Topix
2000 02 04 06
Mar.
11
08
Equity prices have moved close to precrisis peaks in the United States but are lagging
in Europe and Japan, reflecting, respectively, concerns about the financial sector and
exports. Volatility has receded. Corporate spreads have returned to a low level.
Long-term government bond yields have moved up in response to stronger activity
but remain below levels reached in early 2010.
MSCI Daily Change Differences
(Jan. 1, 2010 = 100)
Euro total–
World total
Euro financial–
World financial
May 10, 2010
Jan.
2010
Mar.
11
Apr.
10
Jul.
10
Oct.
10
Jan.
2010
Mar.
11
Apr.
10
Jul.
10
Oct.
10
Sources: Bloomberg Financial Markets; and IMF staff calculations.
VIX = Chicago Board Options Exchange Market Volatility Index; VXY = JPMorgan
Emerging Market Volatility Index.
Ten-year government bonds.
1
0
1
2
3
4
5
6
Government Bond Yields
Japan
United
States
2002 04 06
Mar.
11
2
08
Germany
0
300
600
900
1200
1500
1800
Corporate Spreads
(basis points; averages of
Europe and United States)
AAA
BB
Mar.
11
2000 02 04 06 08
2000 02 04 06 08
1
2
Jan.
11
Jan.
11
CHAPTER 1 GLOBAL PROSPECTS AND POLICIES
International Monetary Fund | April 2011 5
uncertainty in the euro area could also temper such
fl ows in the future.
Commodity Prices Are Resurgent
Commodity prices have quickly returned to high
levels, owing to structural as well as cyclical and
special factors, and market pressures remain elevated.
e key structural change is rapid growth in emerg-
ing and developing economies, which has lifted
and changed the pattern of commodity consump-
tion. At the same time, supply responses have been
slow, with production running into sharply higher
marginal costs. e key cyclical factor was stronger-
than-expected growth in demand for commodities
during the second half of 2010, which drove up oil
prices for 2011 to about $90 a barrel by early Janu-
ary 2011, up from the $83 a barrel expected in April
2010. Special factors include the Organization of
Petroleum Exporting Countries’ (OPEC’s) lower-
than-expected output response when prices rose
above $70–$80, a price range previously declared
to be “fair,” which increased market concern about
supply. Another special factor has been unrest in the
Middle East and North Africa since January 2011.
For food, the main special factor was weather-related
supply shocks.
Stronger-than-anticipated global demand for com-
modities has reduced inventories and caused a strong,
sustained, and broad-based increase in prices (Appen-
dix 1.2). e overall IMF commodity price index rose
by 32 percent from the middle of 2010 to February
2011—recuperating about three-quarters of the 55
percent decline after the cyclical peak in July 2008
through early 2009. Food prices are within reach of
their 2008 peaks. Fortunately, good harvests in sub-
Saharan Africa have off ered a measure of protection
to some of the world’s poor. However, social unrest in
the Middle East and North Africa could place further
upward pressure on food prices if the governments
of large grain importers inside and outside the region
step up their purchases to ensure suffi cient supply in
these subsidized domestic food markets.
Commodity supplies are expected to respond to
higher prices in 2011. ere is spare capacity in the
energy sector, which could make up for production
losses on account of civil war in Libya, and an
-20
-10
0
10
20
30
40
50
60
0
40
80
120
160
200
240
0
40
80
120
160
200
240
0
400
800
1200
1600
0
25
50
75
100
125
150
Sources: Bloomberg Financial Markets; Capital Data; IMF, International Financial
Statistics; and IMF staff calculations.
JPMorgan EMBI Global Index spread.
JPMorgan CEMBI Broad Index spread.
Total of equity, syndicated loans, and international bond issues.
Central and eastern Europe and Commonwealth of Independent States.
Annualized percent change of three-month moving average over previous three-month
moving average.
1
Figure 1.3. Emerging Market Conditions
Equity prices in Asia and Latin America are close to precrisis peaks. In addition,
credit spreads have returned to low levels, capital flows have picked up remarkably
quickly, and private sector credit growth is reaching high levels again in many
emerging market economies.
New Issues by Region
(billions of U.S. dollars)
United States BB
Interest Rate Spreads
(basis points)
Equity Markets
(2007 = 100;
national currency)
Latin
America
Asia
Eastern
Europe
AAA
04 06
10:
Q4
Mar.
11
2002 04
2002 04 06 Mar.
11
06
Sovereign
1
2
3
Europe
Developing Asia
Sub-Saharan
Africa
Western Hemisphere
Middle East and North Africa
Corporate
2
3
4
08
08
08
Private Credit Growth
China
Latin
America
Eastern
Europe
2002 03
04
05
06 07
Jan.
11
08
5
Asia
excluding
China
Equities
Bonds
Syndicated loans
Emerging Market Issuance
(billions of U.S. dollars)
2002
06
10:
Q4
07 08
2005
09
09
4
5
WORLD ECONOMIC OUTLOOK: TENSIONS FROM THE TWO-SPEED RECOVERY
6 International Monetary Fund | April 2011
anticipated return to more normal weather conditions
should result in increased agricultural output. At the
same time, demand growth should moderate some-
what, refl ecting usual cyclical patterns. ese develop-
ments are forecast to allow for more balanced growth
in both supply and demand. Nonetheless, the outlook
for oil markets remains quite uncertain, as perceptions
of geopolitical supply risks can be volatile.
• Crude oil supply is responding sluggishly to
the ongoing pickup in demand, largely reflect-
ing the policy stance of OPEC. Constraints on
non-OPEC capacity and disruption of produc-
tion in Libya mean that the call on other OPEC
suppliers will increase in 2011.
1
Current OPEC
spare capacity levels, estimated at about 4½
percent of global demand, are sufficient to make
up for losses of supply from Libya and to meet
the expected increase in demand. If the supply
response materializes, it should restrain further
upward price pressure. Current WEO projections
are based on futures market prices during March
2011, which saw oil prices stabilizing at about
$108 a barrel, some 35 percent above 2010 levels,
or some 20 percent above levels assumed for 2011
in the January 2011 WEO Update.
• Global food output should recover quickly from
recent supply shocks, with increased global acreage
and more normal weather conditions pointing to
favorable harvest prospects in 2011. Low inven-
tories will take time to rebuild, and so prices are
likely to remain more volatile than usual. Govern-
ments will need to ensure that the poor have suf-
ficient access to food while food prices stay high.
Regarding medium-term prospects for key com-
modities, genuine resource scarcity concerns are
now widespread (Chapter 3). A gradual, signifi -
cant downshift in oil supply trend growth is quite
possible but might present only a limited drag on
annual global growth of less than ¼ percent in the
medium term. is relatively small eff ect refl ects the
small share of oil in overall economic production
and consumption and the scope to adjust produc-
tion and consumption to rising prices over the long
term. However, given low (and falling) short-term
1
e “call on OPEC” is the diff erence between global demand
and supply from sources other than OPEC crude oil production,
including OPEC natural gas liquids (NGL) production.
Financial Conditions Index
4
(positive = tightening; standard deviations from average)
0
100
200
300
400
Figure 1.4. Developments in Mature Credit Markets
Bank lending conditions either are no longer tightening significantly or are easing
again, but credit growth rates remain very low. The main concerns with respect to
global financial stability stem from very high funding requirements of banks and
sovereigns, especially in peripheral countries of the euro area. Further gradual
easing of credit conditions can be expected.
Bank CDS
3
Spreads
(ten-year, median; in basis
points)
United
States
Euro
area
2003 04 Mar.
11
06
-40
-20
0
20
40
60
80
100
Bank Lending Conditions
1
02
11:
Q1
062000 04
United
States
(left scale)
Euro area
(left scale)
Japan
(inverted;
right scale)
05 07
-15
-10
-5
0
5
10
15
20
08
08
09
0
150
300
450
600
750
900
0
400
800
1200
1600
2000
Government Bond Spreads
(two-year yield spreads over
German bunds; basis points)
Jan.
2010
Mar.
11
Apr.
Greece
(right scale)
Ireland
Portugal
Spain
July
May 10,
2010
Oct.
-20
-10
0
10
20
30
Private Credit Growth
2
2000 04 06 Feb.
11
0802
United
States
Japan
Euro area
United States
-2
-1
0
1
2
3
4
5
2000 02 04 10
12:
Q4
Euro Area
-2
-1
0
1
2
3
4
5
Quantities
Spreads
Prices
Quantities
Spreads
Prices
06 08 2000 02 04 10
12:
Q4
06 08
Jan.
11
Sources: Bank of America/Merrill Lynch; Bank of Japan; Bloomberg Financial Markets;
European Central Bank; Federal Reserve; Haver Analytics; Thomson Datastream; and IMF
staff calculations.
1
Percent of respondents describing lending standards as tightening “considerably” or
“somewhat” minus those indicating standards as easing “considerably” or “somewhat”
over the previous three months. Survey of changes to credit standards for loans or lines of
credit to firms for the euro area; average of surveys on changes in credit standards for
commercial/industrial and commercial real estate lending for the United States; diffusion
index of “accommodative” minus “severe,” Tankan survey of lending attitudes of financial
institutions, for Japan.
2
Annualized percent change of three-month moving average over previous three-month
moving average.
3
CDS = credit default swap.
4
Historical data are monthly, and forecasts (dashed lines) are quarterly.
CHAPTER 1 GLOBAL PROSPECTS AND POLICIES
International Monetary Fund | April 2011 7
supply and demand elasticities, such a trend could
also bring abrupt price changes that could have very
damaging short-term eff ects on economic activity.
The Recovery Is Expected to Solidify
Given the improvement in fi nancial markets, buoy-
ant activity in many emerging and developing econo-
mies, and growing confi dence in advanced economies,
economic prospects for 2011–12 are good, notwith-
standing new volatility caused by fears about disrup-
tions to oil supply. As in the January WEO Update,
activity is projected to pick up from the recent dip,
with global growth reaching about 4½ percent during
2011–12 (see Table 1.1; Figure 1.6, top panel). Real
GDP is expected to expand by about 2½ percent in
advanced economies and by 6½ percent in emerging
and developing economies. is entails a modest slow-
down relative to the growth rates reached in 2010.
Leading indicators already show evidence of
a pickup in growth following the inventory-led
slowdown. After stagnating during much of the fall,
industrial production has begun to regain speed,
refl ected in the return of manufacturing purchas-
ing managers indices (PMIs) to more expansionary
levels (Figure 1.7, top panel). Service sector PMIs
suggest that the recovery is now broadening to this
large part of the global economy. Retail sales are
going strong in emerging market economies and
have bounced back in advanced economies, led by
the United States (Figure 1.7, middle panel). At
the same time, the impact of recent oil price hikes
is expected to be relatively limited.
2
A much wider
reading of coincident indicators, summarized in the
IMF’s Growth Tracker, confi rms a return of momen-
tum (Figure 1.8, top panel).
2
Oil factor shares would imply output losses of a bit more than
½ percentage point, assuming the price increases during Febru-
ary and March are permanent. ere are, however, important
mitigating factors that would noticeably lower the eff ect on global
growth. Fuel subsidies in many emerging and developing econo-
mies insulate end-users from increases in world oil prices at least
temporarily. e terms-of-trade gains of oil exporters will lead
to higher imports from oil importers as will higher government
spending on social programs in some Middle Eastern economies.
Finally, with the supply disruption expected to ease somewhat
throughout the year, end-users could well accommodate higher oil
expenditures in part by drawing on savings.
Sources: Bureau of Economic Analysis; U.S. Treasury; EPFR Global; European Central
Bank; Haver Analytics; Netherlands Bureau for Economic Policy Analysis for CPB trade
volume index; and IMF staff calculations.
Not all economies are included in the regional aggregations. For some economies,
monthly data are interpolated from quarterly series.
In SDR terms.
China, India, Indonesia, Malaysia, Philippines, and Thailand.
Argentina, Brazil, Bulgaria, Chile, China, Colombia, Hungary, India, Indonesia, Latvia,
Lithuania, Malaysia, Mexico, Pakistan, Peru, Philippines, Poland, Romania, Russia, South
Africa, Thailand, Turkey, Ukraine, and Venezuela.
Australia, Canada, Czech Republic, Denmark, euro area, Hong Kong SAR, Israel, Japan,
Korea, New Zealand, Norway, Singapore, Sweden, Switzerland, Taiwan Province of China,
United Kingdom, and United States.
Actual (solid line) versus 1997–2006 log linear trend (dashed line).
Billions of U.S. dollars for the United States and euros for euro area, annualized.
AE = advanced economies.
EM = emerging market economies.
EMEA = Europe, Middle East, and Africa.
-30
-20
-10
0
10
20
30
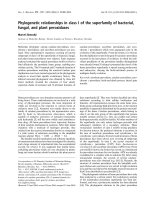
Figure 1.5. Current and Forward-Looking Trade
Indicators
(Annualized percent change of three-month moving average over previous
three-month moving average unless noted otherwise)
Industrial Production
World
2005 06 07 Jan.
11
Advanced
economies
5
-60
-40
-20
0
20
40
60
World Trade
2000 02 04 06 Jan.
11
CPB trade
volume index
Trade value
2
Emerging
economies
4
0808
1
09
Emerging Asia
3
4.2
4.4
4.6
4.8
5
5.2
5.4
5.6
Imports
1997 2000 03 06 Jan.
11
Advanced
economies
Emerging
economies
09
6
1
2
3
4
5
6
0
200
400
600
800
1000
1200
1400
Capital Outflows: 2010 versus
2006–07
AE EM
United States
7
AE
EM
Euro area
2010 (Q1–Q2)
2006–07
7
Apr. Jul. Oct. Mar.
11
Jan.
10
Bond Funds
Greece
crisis
Ireland
crisis
QE2
(Nov. 3)
Net Fund Flows to Emerging Markets
(billions of U.S. dollars; weekly flows)
Latin America
Global
Asia excl. Japan
EMEA
Apr. Jul. Oct. Mar.
11
Jan.
10
Equity Funds
Greece
crisis
Ireland
crisis
QE2
(Nov. 3)
8
8
9
10
9
10
8
9
-8
-6
-4
-2
0
2
4
6
8
Jan.
11
-1.0
-0.5
0.0
0.5
1.0
1.5
2.0
Jan.
11
World trade and industrial production slowed during 2010:H2, reflecting a global inventory
cycle. Imports of emerging and developing economies are back to precrisis trends, but
those in advanced economies continue to lag. Capital flows from advanced to emerging
economies have picked up. However, according to some measures they slowed down
during fall 2010. Flows between advanced economies remain in the doldrums.