Báo cáo khoa học: NMR and MS evidences for a random assembled O-specific chain structure in the LPS of the bacterium Xanthomonas campestris pv. Vitians A case of unsystematic biosynthetic polymerization potx
Bạn đang xem bản rút gọn của tài liệu. Xem và tải ngay bản đầy đủ của tài liệu tại đây (499.72 KB, 9 trang )
NMR and MS evidences for a random assembled O-specific chain
structure in the LPS of the bacterium
Xanthomonas campestris
pv.
Vitians
A case of unsystematic biosynthetic polymerization
Antonio Molinaro
1
, Cristina De Castro
1
, Rosa Lanzetta
1
, Michelangelo Parrilli
1
, Bent O. Petersen
2
,
Anders Broberg
2,
* and Jens Ø Duus
2
1
Dipartimento di Chimica Organica e Biochimica, Universita
`
di Napoli Federico II, Napoli, Italy;
2
Department of Chemistry,
Carlsberg Laboratory, Copenhagen, Denmark
Xanthomonas campestris pv. vitians is a Gram-negative
plant-associated bacterium that acts as causative agent of
bacterial leaf spot and headrot in lettuce. The lipopolysac-
charide of this bacterium is suspected to be an important
molecule for adhesion to and infection of the plants. The
lipopolysaccharide has been isolated from the phenol phase
and the O-specific chain characterized by compositional
analysis, high field NMR and MALDI-TOF MS. It consists
of a nonrepetitive branched polysaccharide with a rhamnan
backbone to which Fuc3NAc is linked. The NMR and MS
approach led to the characterization of the fine structure of
the polymer, which is randomly assembled. The rhamnan
backbone is built up of b-Rhap and a-Rhap,thislastis
present in one, two or three adjacent units and branched by
an a-Fucp3NAc unit. This is a real case of a random con-
stituted O-specific chain, therefore biosynthetic studies
towards the comprehension of this irregular biosynthesis are
needed.
Keywords: Xanthomonas campestris; lipopolysaccharide;
phytopathogen; O-specific chain random polymerization.
Until recently, structural data on lipopolysaccharides (LPSs)
of phytopathogenic bacteria have been rather limited, but
the interest in their structure is increasing, especially in the
structural analysis of O-specific polysaccharides (OPSs) [1].
The main purposes of these investigations are to establish a
chemotaxonomic relationship among strains and species of
the same genus, to clarify the biosynthesis of the LPS and
finally to evaluate their role in the interaction between the
bacterium and the vegetal host organisms.
Xanthomonas campestris pv. vitians is a Gram-negative
bacterium, which acts as causative agent of bacterial leaf
spot and headrot in lettuce. This disease is easily recognized
by translucent and water-soaked brown lesions that get
dark after a while. The molecular basis of this disease is
not understood. Recently, the O-specific polysaccharide
(OPS) of the LPS extracted from the aqueous phase of
Xanthomonas campestris pv. vitians (X. hortorum pv.
vitians) has been described [2]. The structure consists of a
linear non-strictly repetitive rhamnan:
[fi3)-a-L-Rhap-(1fi]
n
3)-b-L-Rhap-(1fi
where n is more frequently equal to two but it also
assumes values equal to one and or three. This rhamnan
backbone is identical to the Smith degraded product of
the OPS derived from the LPS contained in the phenol
phase, which differed by the additional presence of
terminal Fuc3NAc units. However, this apparent minimal
structural difference made both
1
Hand
13
CNMRspectra
much more intricate than those of the backbone obtained
by Smith degradation [2]. In this paper a detailed NMR
and MALDI-TOF MS analysis is reported and based on
the results a random structure for the OPS of the phenol-
phase LPS is proposed.
MATERIALS AND METHODS
Growth of bacteria, isolation of LPS and OPS
X. campestris pv. vitians strain 1839 (NCPPB), obtained from
the National Collection of Plant Pathogenic Bacteria,
Harpenden, UK, was grown as described [3] and then
lyophilized. Lipopolysaccharide was isolated from dried
bacterial cells (4.45 g) by extraction using hot phenol/water
extraction [4]. The phenol phase LPS was a mixture
containing a large amount of low molecular mass glucan,
therefore it was further purified by GPC, on Bio-Gel A-15 m
column (3 · 150 cm) with 300 m
M
triethylamine-EDTA
buffer (pH 7) as eluent, monitored with a Waters differential
refractometer. The pure LPS was recovered in the void
volume and further purified by precipitation with 2-propanol
Correspondence to Antonio Molinaro, Dipartimento di Chimica
Organica e Biochimica, Universita
`
di Napoli Federico II,
Complesso Universitario Monte S. Angelo, via Cynthia 4,
80126 Napoli, Italy. Fax: +39 081674393, Tel.: +39 081674123,
E-mail:
Abbreviations: Fuc3NAc, 3-acetamido-3,6-dideoxy-galactose;
HPAEC, high performance anion exchange chromatography;
LPS, lipopolysaccharide; OPS, O-specific polysaccharide chain;
PSD, post source decay; Rha, rhamnose.
*Present address: Department of Chemistry, Swedish University of
Agricultural Sciences, SE-750 07 Uppsala, Sweden
Dedication: dedicated to Prof Lorenzo Mangoni on the occasion of his
70th birthday.
(Received 1 March 2002, revised 26 June 2002,
accepted 25 July 2002)
Eur. J. Biochem. 269, 4185–4193 (2002) Ó FEBS 2002 doi:10.1046/j.1432-1033.2002.03138.x
and in succession chromatographed on Biogel A 1.5-m (yield
370 mg, 8% of cell dry mass, w/w). The product released by
mild acid hydrolysis (aqueous 1% HOAc, 100 °C, 2 h) of the
LPS was applied to a GPC, Bio-Gel P-10 column
(3 · 90 cm) with ammonium bicarbonate buffer (pH 5) as
eluent. The polymeric fraction eluted in the void volume was
the O-polysaccharide (340 mg, yield 91% of LPS).
General and analytical methods
The monosaccharides were identified by GLC and
GLC-MS as acetylated O-methyl glycoside derivatives:
briefly, samples were treated with 1
M
HCl/MeOH at 80 °C
for 20 h, dried under reduced pressure and then acetylated
with acetic anhydride in pyridine at 80 °C for 30 min. The
absolute configuration of Rha and Fuc3NAc residues was
determined by the published method [5], using GLC of
acetylated (S)-2-octyl glycosides, temperature profile:
150 °C for 8 min, then 2 °Cmin
)1
to 200 °Cfor0min,
then 6 °Cmin
)1
to 260 °C for 5 min. The Fuc3NAc
retention time was compared with an authentic sample
obtained by synthesis [6].
Methylation analysis of polysaccharide was carried out
by standard procedure [7] and monitored by GLC-MS of
the partially methylated alditol acetates.
NMR spectroscopy
Chemical shifts obtained by NMR spectroscopy were
assigned using 2D homo- and heteronuclear experiments
at 799.96 MHz for proton and 201.12 MHz for carbon,
using the methyl group of acetone as reference for proton
(2.225 p.p.m) and 1,4-dioxane for carbon (67.4 p.p.m).
Spectra were recorded at 310K on a Varian UNITY
INOVA 800.
In addition to standard 1D proton spectra a series of 2D
spectra were obtained. Double quantum-filtered phase-
sensitive COSY experiment was performed using the Varian
standard program tndqcosy (Double-Quantum-filtered-
COrrelation-SpectroscopY, with water suppression), with
0.258 s acquisition time and 4096 data points in the F2
dimension. The data matrix was zero-filled in the F1
dimension to give a matrix of 4096 · 2048 points and was
resolution enhanced in both dimensions by a shifted sine-
bell function before Fourier transformation. Similarly, the
nuclear Overhauser experiment was performed using the
Varian standard tnnoesy program (Nuclear-Overhauser-
Enhancement – SpectroscopY, with water suppression),
with a mixing time of 25 ms. The TOCSY experiment was
performed using standard Varian program tntocsy (TOtal-
Correlation-SpectroscopY, with water suppression) with a
spinlock time of 80 ms. The heteronuclear experiments were
performed using pulse field gradient programs as gHSQC,
gHSQC-TOCSY, gHSQC-NOESY and gHMBC.
The spectra were assigned using the computer program
Pronto [8], which allows the simultaneous display of
different two-dimensional spectra and the individual label-
ling of cross peaks.
Mild hydrolysis
An aliquot of the OPS (10 mg) was dissolved in a
trifluoroacetic acid solution (0.01
M
) and left at 120 °Cfor
6 h. After lyophylization the sample was chromatographed
on Bio-Gel P2 (2 · 100 cm), using the same conditions as
above, two main products (fractions 1 and 2) were recovered
and analyzed by MALDI-TOF MS.
High-performance anion-exchange chromatography
Further purification of fraction 1 was performed by high
performance anion exchange chromatography (HPAEC)
with pulsed amperometric detection (GP40 pump connected
to a CarboPac PA-100 column (4 · 250 mm) and an ED40
electrochemical detector operated in the pulsed ampero-
metric detection mode; Dionex, Sunnyvale, CA, USA).
The eluent was 36 m
M
NaOH and an elution gradient
was formed with NaOAc (0–250 m
M
in 17 min) at
0.8 mLÆmin
)1
. A carbohydrate membrane desalter (Dionex;
0.1
M
H
2
SO
4
as regenerant at 6 mLÆmin
)1
) was employed
for on-line cation-exchange (H
+
/Na
+
) of the eluent. A
volume of 20 lL was injected from a sample solution earlier
analyzed with NMR and five fractions were manually
collected and freeze-dried.
MALDI-TOF MS
Fractions 1 and 2 from partial hydrolysis of the O-specific
polysaccharide were analyzed on a Bruker Reflex III
MALDI-TOF mass spectrometer (Bruker, Germany)
operated in the delayed extraction mode with an acceler-
ating voltage of 20 kV and a reflectron voltage of 22.8 kV.
A solution of each sample was mixed 1 : 1 (v/v) with the
matrix 2,5-dihydroxy-benzoic acid (20 mgÆmL
)1
in H
2
O/
CH
3
CN, 3 : 2) and 1 lL of the mixture was deposited on a
chromeplated stainless steel target and dried under reduced
pressure. After introduction of the target in the ion-source,
the laser power was adjusted to a level just above the
threshold for formation of ions and the results from 50 laser
shots were summed. A mixture of maltotriose, maltotetra-
ose, maltopentaose, maltohexaose and maltoheptaose was
used as external calibrant.
MALDI postsource decay (PSD) TOF MS experiments
were performed to study fragmentation patterns of oligo-
saccharides isolated (fraction 3) by HPAEC-PAD. The
samples for MALDI-PSD TOF MS were prepared as
described above. The laser power was adjusted to a level
considerably higher than the threshold value required to
form ions and the reflectron voltage was stepped down from
22.8 kV in seven steps (25% decrease in voltage in each
step). Combination of the recorded mass segments as well as
instrument calibration using fragments from the peptide
adrenocorticotropic (ACTH) hormone (18–39) clip were
performed using software supplied by Bruker. The ATCH
was purchased from Sigma.
Smith degradation
An aliquot of O-polysaccharide (20 mg) was N-deacety-
lated at 120 °CwithKOH4
M
for 16 h with stirring [2].
After neutralization, dialysis (cut-off 3500 Da) and
lyophilization, the sample (18 mg) was submitted to
Smith degradation [2]: it was treated with 50 m
M
NaIO
4
at 4 °C for 7 days, followed by addition of ethane-1,2-
diol, reduction (NaBH
4
), acidification (2
M
acetic acid),
dialysis and freeze-drying. Then the oxidized polymer
4186 A. Molinaro et al.(Eur. J. Biochem. 269) Ó FEBS 2002
was hydrolyzed with 1% HOAc at 100 °C, 1.5 h, and
acid was removed by freeze-drying. The product was
purified by Bio-Gel P2 (2 · 100 cm), eluted in the void
volume with 50 m
M
ammonium bicarbonate buffer
(pH 5), monitored with a Waters differential refractom-
eter, and dried (15 mg).
Molecular modelling
Molecular modelling was carried out using the consistence
valence force field in the Discover program [9]. The
monosaccharide residues were constructed using standard
bond lengths and angles in the Insight II program (MSI,
San Diego). Molecular dynamics simulations were per-
formed for the fragments containing from eight to ten
residues in a water box of sidelength of 50 A
˚
for 500 ps and
with a step length of 1 fs. Full coordinates were saved every
2.5 ps. Among the structures modelled were A–A–B–A–A–
B–A–A, A–A–B–A–
A–B–A–A, A–A–B–A–AvB–A–A and
A–A–B–
A–A–B–A–A (B: b-Rhap,A:a-Rhap, A:
a-Fucp3NAc(1fi2)a-Rhap). The phi and psi angles are
defined by H1–C1–O1–CX and C1–O1–CX–HX, respect-
ively, where X is the position of glycosylation.
RESULTS
Isolation, characterization of the LPS and isolation
of the OPS
The LPS fraction was extracted from dried cells using the
hot phenol/water method and isolated in the phenol phase,
further purified by precipitation with 2-propanol and, in
succession, chromatographed on Biogel A 1.5-m. The fatty
acids composition (3-hydroxydecanoic, 3-hydroxydodeca-
noic) and the presence of Kdo in the compositional analysis
of purified fraction confirmed the presence of a lipopoly-
saccharide. By SDS/PAGE the LPS showed a pattern
indicating a wide continuous distribution of molecular
mass. Mild acid hydrolysis with 1% HOAc yielded the lipid
A moiety as precipitate and the OPS was isolated from the
supernatant and further purified by gel-permeation chro-
matography.
Compositional, size of ring and linkage analysis
GLC-MS analysis of the acetylated O-methyl glycosides
and of the acetylated (S)-2-octyl glycoside derivatives
showed that OPS is composed by
L
-rhamnose and
3-acetamido, 3,6-deoxy-
D
-galactose (Fuc3NAc). This last
derivative was identified by comparison with an authentic
sample.
GLC-MS analysis of the partially methylated alditol
acetates yielded the following sugar composition:
2,3-disubstituted L-Rhap, 2,3-substituted L-Rhap,
terminal-D-Fucp3NAc in the ratios 2 : 1 : 1, respectively.
NMR analysis of the OPS
The presence of Rhap in both anomeric configurations a
and b was previously established on the Smith degraded
product [2], whereas the a configuration of Fucp3NAc was
inferred by the
1
J
C,H
values [10] of anomeric signals
measured in a coupled
13
C NMR spectrum of OPS. The
1
Hand
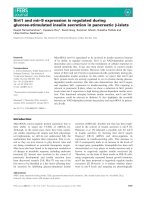
13
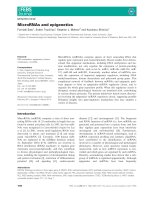
C NMR spectra of the OPS were indicative of a
highly complex structure (Fig. 1). In the
13
CNMR
spectrum, the a-anomeric signals attributable to Rhap and
Fucp3NAc residues were broadened in the region 101–
103 p.p.m., while the anomeric signals of b-Rhap units
(
1
J
C,H
¼ 160–163) [11] occurred around 97 p.p.m. In addi-
tion, the region of glycosylated carbon (76–82 p.p.m)
appeared very crowded suggesting a nonregular structure
of the polymer. Thus, despite the simplicity of composi-
tional analysis data, it appeared clear that this polymer was
arranged in a rather intricate assemblage. Therefore a
detailed 2D NMR analysis (Table 1) was performed at
800 MHz using homo- and heteronuclear experiments. By
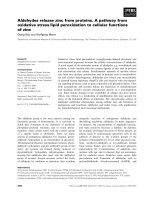
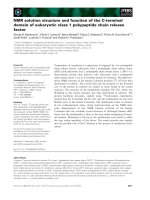
the combination of several 2D spectra it was possible to
assign four groups of spin systems, corresponding to four
different carbohydrate units (Fig. 2).
One type of spin system (F) showed anomeric signals in
the range of 5.043–5.086 p.p.m and a J
H1,H2
of 4Hzin
agreement with the a configuration. The methyl group for
all signals of system F resonated at 1.16 p.p.m and
16.0 p.p.m. (H6/C6). The J
H,H
-values for H3–H4 and
H4–H5 were indicative of a galacto configuration (3–4 Hz
and less than 1 Hz, respectively). The carbon chemical shifts
indicated no substitution except for C3 having a shift at
51.9 p.p.m. in agreement with the presence of an acetamido
group, and the NAc could be assigned with a proton
chemical shift at 2.05 p.p.m and a carbon chemical shift at
22.8 p.p.m. Thus, all of signals in the spin system F were
identified as terminal a-Fuc3NAc in different chemical/
magnetic environments.
Three other spin systems (B, A and
A) were all recognized
as Rha residues as they possessed a small J
H2-H3
value
( 3 Hz) and H6/C6 chemical shifts (1.3/17.4 p.p.m)
distinctive of a methyl group.
One type of the Rha spin systems (B) was characterized
by the anomeric signals at 4.8 p.p.m and 98 p.p.m.
(Fig. 2). The anomeric
1
J
C,H
-value (161 Hz) indicated the b
configuration. A further indication of the b configuration
was the observation of a coupling constant H1 to H2,
between 0.5 and 1 Hz, and the presence of the nuclear
Fig. 1. The
1
H- and
13
C-NMR spectra of OPS. Spectra were recorded
in D
2
O at 310K at 799.96 MHz for proton and 201.12 MHz for car-
bon, using methyl signal of acetone as reference for proton
(2.225 p.p.m) and 1,4-dioxane for carbon (67.4 p.p.m).
Ó FEBS 2002 O-chain structure from Xanthomonas campestris pv. vitians (Eur. J. Biochem. 269) 4187
Overhauser effect among H1, H3 and H5. The carbon
chemical shifts were indicative of a substitution at C3, as
found by a downfield shift of this carbon signal
( 81 p.p.m). All data identified spin system B as 3-substi-
tuted-b-Rha.
Thelasttwotypesofspinsystems(
AandA)were
both endorsed as a-Rha residues (
1
J
C,H
¼ 174 Hz and
3
J
H1-H2
¼ 1 Hz). The anomeric protons were present at
5.3 p.p.m and 5.1 p.p.m and correlated to two different
carbon signals in the HSQC spectrum at 101 p.p.m and
103 p.p.m., respectively (Fig. 3). The a-Rha unit with
anomeric proton occurring around 5.1 p.p.m. (A) was
assigned as 3-substituted-a-Rha owing to C3 low field
chemical shift ( 78 p.p.m). The a-Rha residue with an
anomeric resonance occurring around 5.3 p.p.m. (
A)
was identified as 2,3-di-substituted-a-Rha because of the
downfield chemical shifts of C2 and C3 carbons at 76 or
79 p.p.m., respectively. Hence, this last residue was identi-
fied as the nodal unit.
The a-Fuc3NAc residue was linked to the 2 position of
the nodal a-Rha. This was deduced by an interresidual nOe
between the anomeric proton of the a-Fuc3NAc and the H1
and H2 of the a-Rha and by the cross peak in the gHSQC-
NOESY of the same anomeric proton to C2 of the a-Rha
(Fig. 3).
Similarly, by NOESY and gHSQC-NOESY (Fig. 3) the
b-Rha residue could be assigned to be substituted by an
a-Rha unit at the 3 position and linked (1fi3) to a-Rha.
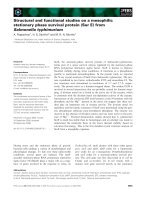
From the NOESY spectrum (Fig. 4), it was possible to
establish that the a-Rha residue could be both substituted at
the 3 position by either a-Rha or b-Rha residues and linked
(1fi3) to either a-Rha or b-Rha residues.
Table 1. Chemical shift for the assigned residues in identified fragments in the LPS.
Fragment
a
Residue Type 1 2 3456NAcNOE
b
A–B–A–A/B b-Rha
1
H 4.814 4.128 3.65 3.52 3.451 1.318
13
C 97.8 71.4 81.1 72.3 72.8 17.4
A–B–A–A/B b-Rha
1
H 4.818 4.083 3.66 3.517 3.447 1.318 4.18
13
C 97.8 71.4 80.4 72.3 72.8 17.4
A–B–A–
A b-Rha
1
H 4.764 4.113 3.66 3.50 3.403 1.307
13
C 97.3 71.4 81.3 72.3 72.8 17.4
A–B–A–A b-Rha
1
H 4.770 4.060 3.66 3.50 3.390 1.307 4.07
13
C 97.3 71.4 80.5 72.3 72.8 17.4
B–A–B–A a-Rha
1
H 5.068 4.239 4.07 3.57 3.88 1.28 3.65
13
C 102.8 68.2 78.3 72.4 69.7 17.4
B–A–B–A a-Rha
1
H 5.072 4.232 4.07 3.57 3.88 1.28 3.65
13
C 102.8 68.2 78.3 72.4 69.7 17.4
B–A–A a-Rha
1
H 5.084 4.239 4.07 3.57 3.88 1.28 3.92
13
C 102.8 68.2 78.3 72.4 69.7 17.4
B–A–A–
A a-Rha
1
H 5.119 4.213 3.950 3.57 3.88 1.28 3.95
13
C 102.5 68.2 77.6 72.4 69.7 17.4
B–A–
A–A a-Rha
1
H 5.124 4.230 3.962 3.57 3.88 1.28 4.05
13
C 102.5 68.2 77.6 72.4 69.7 17.4
A–A–B a-Rha
1
H 5.016 4.140 3.918 3.57 3.89 1.30 3.65
13
C 103.0 70.7 79.1 72.4 69.9 17.4
A–A–B a-Rha
1
H 5.004 4.136 3.927 3.57 3.89 1.30 3.91
13
C 103.0 70.7 78.7 72.4 69.9 17.4
B–A–A–A a-Rha
1
H 5.034 4.142 3.918 3.57 3.89 1.30 3.91
13
C 103.0 70.7 78.7 72.4 69.9 17.4
B–A–B a-Rha
1
H 5.261 4.250 4.18 3.74 3.88 1.33 3.66
13
C 101.5 76.2 77.8 71.2 69.9 17.4
Fuc3NAc
1
H 5.060 3.78 4.18 3.74 4.11 1.16 2.05 4.25
13
C 100.9 67.2 51.9 71.0 67.9 16.0 22.8
B–
A–A a-Rha
1
H 5.273 4.250 4.180 3.74 3.88 1.31 3.92
13
C 101.5 76.2 77.8 71.2 69.9 17.4
Fuc3NAc
1
H 5.086 3.80 4.18 3.746 4.11 1.16 2.05 4.25
13
C 100.9 67.2 51.9 71.0 67.9 16.0 22.8
B–
A–A a-Rha
1
H 5.327 4.231 4.07 3.75 3.88 1.35 4.06
13
C 101.4 75.8 77.4 71.2 70.0 17.4
Fuc3NAc
1
H 5.043 3.78 4.18 3.74 4.11 1.16 2.05 4.23
13
C 100.9 67.2 51.9 71 67.9 16.0 22.8
A–A–B a-Rha
1
H 5.25 4.09 4.08 3.75 3.89 1.32 3.66
13
C 101.5 79.8 77.4 72.9 69.9 17.4
Fuc3NAc
1
H 5.066 3.78 4.18 3.74 4.11 1.16 2.05 4.09
13
C 101.7 67.2 51.9 71 67.9 16.0 22.8
a
The following abbreviations are used: B; b-Rha, A; a-Rha, A; a-Fuc3NAc (1–2) a-Rha).
b
In this column the inter residue NOEs from the
anomeric
1
H used to assign the linkages are given.
4188 A. Molinaro et al.(Eur. J. Biochem. 269) Ó FEBS 2002
Therefore, the above spectroscopic assumptions were in
full agreement with a rhamnan backbone in which one b-Rha
is alternating between one, two or up to three a-Rha2:
fi3)bRha(1fi3)aRha(1fi
fi3)bRha(1fi3)aRha(1fi3)aRha(1fi
fi3)bRha(1fi3)aRha(1fi3)aRha(1fi3)aRha(1fi
The degree of fucosylation (i.e. a-Fuc3NAc(1fi2) a-Rha: a-
Rha) could be estimated to be in the order of 2 : 3, by
measurement of anomeric protons area.
This led to 14 possible combinations: (B ¼ b-Rha,
A ¼ a-Rha,
A ¼ a-Fuc3NAc (1fi2) a-Rha)
B–A, B–
A
B–A–A, B–A–
A, B–A–A, B–A–A
B–A–A–A, B–A–A–
A, B–A–A–A, B–A–A–A, B–A–A–A,
B–
A–A–A, B–A–A–A, B–A–A–A
Several of these combinations were found by means of an
in-depth NMR analysis.
The a-Fuc3NAc influenced the chemical shifts of the
b-Rha residue when this latter was directly linked at nodal
unit, mainly on its H2 (4.128 p.p.m. without Fuc3NAc and
4.083 p.p.m. with Fuc3NAc). In this way, it was possible to
discriminate between b-Rha unit linked to a nodal or to an
unsubstituted a-Rha residue.
On the other hand it was also possible to assign b-Rha
when it was substituted by a nodal Rha or 3-a-Rha. This
was visible on the C3 chemical shift of the b-Rha unit
(80.4 p.p.m. with nodal and 81.2 p.p.m. without).
The a-Fuc3NAc also influenced the b-Rha chemical
shifts when this was attached to Rha two units away
from the nodal residue, but on different atoms. In partic-
ular, changes were clearly visible on H1 and C1 and
furthermore on H4, H5 and H6 (for all see Table 1). It was
not possible to see any effect on the b-Rha whether it was
substituted at C3 by a-Rha or by the a-Fuc3NAc(1fi2)
a-Rha disaccharide.
The conclusion is that b-Rha could be assigned in the
following combinations (the assigned b-Rha are in bold):
A-B–A–A/B,
A-B–A–A/B, A-B–A–AandA–B–A–A.
(Table 1).
The assignment of the a-Rha has been more difficult due
to many possible combinations. It was possible to identify
the C3 substituent, that is to say b-Rha, a-Rha or nodal
Rha, by a nOe from H3 of a-Rha to the anomeric proton of
the substituting residue.
The residue to which the a-Rha was linked was recog-
nized examining the inter residue nOe of its anomeric
proton to H3 of the substituted residue, again b-Rha, a-Rha
or nodal Rha. Further information was given by the
Fig. 4. The NOESY spectrum showing the significant NOEs for the
interresidual assignment, e.g. A-B for the connectivity a-Rha(1–3)b-Rha.
Fig. 2. Section of the
13
C-
1
H HSQC spectrum in which resonances of
the four different spin systems (A,
A, B, F) are shown.
Fig. 3. Sections of the HSQC and HSQC/NOESY spectra in which the
inter residue connectivities are shown with arrows, e.g. C1 (A) to C3 (B)
for the linkage a-Rha (1fi3)b-Rha.
Ó FEBS 2002 O-chain structure from Xanthomonas campestris pv. vitians (Eur. J. Biochem. 269) 4189
observation that the a-Fuc3NAc also influenced the chem-
ical shift of a-Rha if linked one or two units away towards
the terminal end. The following fragments were assignable
(the assigned a-Rha being bold):
B–A–B–A, B–A–B–
A, B–A–A–A, B–A–A–A, B–A–A–A/
B, A–A–A, A–A–B,
A–A–B, B–A–B, B–A–A, B–A–A, A–
A–B (Table 1).
In summary, eight of the 14 possible combinations could
be assigned by NMR, as illustrated below. The remaining
possible combinations might be present in low amounts or
the chemical shifts are simply too close to the fragments
identified.
B–A, B–
A
B–A–A, B–
A–A, B–A–A
B–A–A–A, B–
A–A–A, B–A–A–A
Molecular modelling
In order to explain some unusual variations in chemical
shifts of the assigned fragments, a series of molecular
dynamics (MD) simulations in water have been performed.
The observed differences in chemical shift can largely be
explained by direct glycosylation shifts and by evaluation of
the executed MD simulations.
The chemical shift of C2 in the a-Rha without Fuc3NAc
is dependent on the substituting residue at C3, i.e. if it is
substituted by a-Rha the C2 chemical shift is 70 p.p.m
and if substituted by b-Rha it is 68 p.p.m. The difference
is as expected from previous studies of glycosylation effect
[12].
For the C-2 of a-Rha in the fragment A-
A-B, a rather
downfield chemical shift is observed, not only explicable by
the normal glycosylation shifts. This can be partially
explained by a fairly restricted conformation of the
Fuc3NAc linkage in this fragment. The change in the
conformational preference is also reflected in the chemical
shifts of C1 of Fuc3NAc, which is downfield in comparison
to the other fragments. A change in the / and w angles has
been shown to give rise to a difference in the chemical shift
of the carbons at the glycosidic linkage [13]. Likewise, C3 of
b-Rha resonates at 81.2 p.p.m. if it is substituted by an
a-Rha and at 80.4 p.p.m. if it is substituted by a nodal
a-Rha, in fragments as in A–B–A–A/B and
A–B–A–A. This
small consistent difference is most likely correlated with a
more restricted conformation of the a-linkage when a-Rha
is substituted by Fuc3NAc, as, e.g. demonstrated by a
change in the average //w angles from 27/)15 to 50/20.
This should also affect the chemical shift of C1 of the a-Rha,
but because this carbon also experiences a direct glycosy-
lation effect it cannot be directly observed.
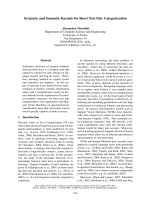
The chemical shift of H5 in the b-Rha certainly depends
on the nature of the two Rha residues towards the reducing
end. If one of these two is a Rha bearing a Fuc3NAc unit,
the H5 chemical shift is upfield shifted by 0.05 p.p.m., which
is in agreement with a short distance in the MD simulations
between the H5 of b-Rha and the methyl group of the
Fuc3NAc that is folding towards the terminal nonreducing
end of the polymer (Fig. 5). This short distance apparently
does not give rise to any detectable nOe.
The chemical shifts of the Rha residues are hardly
affected by the Fuc3NAc substitution. This is in accordance
with the observation that the Rha one residue towards the
nonreducing end has no close contacts to the Fuc3NAc in
the MD simulations (Fig. 5).
MALDI-TOF-MS analysis
In order to support the high structural heterogeneity of the
OPS, a detailed MALDI-TOF analysis was performed on
the oligosaccharide fractions (1 and 2) obtained by gel
permeation chromatography after partial acid hydrolysis of
OPS.
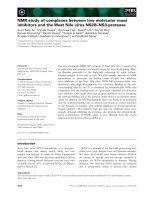
The mass spectrum from MALDI-TOF analysis of
fraction 1 is shown in Fig. 6A. The sample was mainly
constituted of tetra- to heptasaccharides composed of Rha
residues. Each oligosaccharide was carrying 0–2 Fuc3NAc
substituents in accordance with the compositional and
methylation analyses proving that the polysaccharide is
composed of a linear rhamnan backbone substituted with
Fuc3NAc residues. The mass spectrum in Fig. 6A provides
some information about the distribution of the Fuc3NAc
residues on the Rha backbone. The cluster of ions
originating from pentasaccharides contains sodium adduct
ions corresponding to oligosaccharides with the composi-
tions Rha
5
,Rha
4
Fuc3NAc and Rha
3
(Fuc3NAc)
2
.The
cluster of ions from tetrasaccharides has sodium adduct ions
corresponding to oligosaccharides with the compositions
Rha
4
,Rha
3
Fuc3NAc and Rha
2
(Fuc3NAc)
2
, but the latter
ion is of very low intensity indicating that Fuc3NAc
substituents are rarely positioned on neighbouring Rha
units. Fraction 2 was found to contain larger oligosaccha-
rides than fraction 1 (Fig. 6B). The Fuc3NAc distribution
on the Rha backbone of these oligosaccharides was similar
as in fraction 1, the cluster of ions originating from
octasaccharides contained ions from sodium adducts of
Rha
8
,Rha
7
Fuc3NAc, Rha
6
(Fuc3NAc)
2
and Rha
5
(Fuc3-
NAc)
3
, whereas the sodium adduct ions of Rha
10
Fuc3NAc,
Rha
9
(Fuc3NAc)
2
,Rha
8
(Fuc3NAc)
3
and Rha
7
(Fuc3NAc)
4
were prominent among ions formed from undecasaccha-
rides. This indicates statistically that few neighbouring Rha
units are substituted with Fuc3NAc, just as was found for
fraction 1.
Fig. 5. Stick and ball representation of a minimum energy conformation
of A-A-B-A-
A-B-A-A. The Fuc3NAc residue points back towards the
Rha two residues towards the nonreducing end. (B; b-Rha, A; a-Rha,
A; nodal a-Rha)
4190 A. Molinaro et al.(Eur. J. Biochem. 269) Ó FEBS 2002
In order to gain more informations on the Fuc3NAc
substitution the fraction 1 was further fractionated on
HPAEC. The chromatogram and a MALDI-TOF mass
spectrum of the isolated fraction 3 are displayed in
Fig. 7A and B. Then the sample was submitted to
MALDI-PSD TOF MS analysis and the results from
analysis of the ions of m/z 853.4 and 999.4 are shown in
Fig. 8A and B). Figure 8A shows the PSD spectrum
from analysis of the ion of m/z 853.4. The m/z of the
precursor ion corresponds to the sodium adduct ion of
Rha
3
(Fuc3NAc)
2
. The spectrum is dominated by B- and
Y-series types of ions [14] and provides some information
concerning the Fuc3NAc-substitution pattern of the
precursor ion. No fragment ions corresponding to the
loss of a reducing end Rha (B-type, m/z 689.4) or a
nonreducing end Rha (Y-type, m/z 707.4) are visible.
This suggests that Fuc3NAc is linked to both the
reducing end as well as to the nonreducing end of the
Rha-backbone of the oligosaccharide, i.e. the structure is
Fuc3NAc–Rha–Rha–(Fuc3NAc)–RhaOH. Figure 8B
shows the PSD spectrum from analysis of the ion of
m/z 999.4 (Rha
4
(Fuc3NAc)
2
, sodium adduct). This
spectrum also lacks prominent fragment ions correspond-
ing to loss of a reducing end Rha (B-type, m/z 835.4) or
a nonreducing end Rha (Y-type, m/z 853.4), indicating
that both the nonreducing end and the reducing end of
the Rha-backbone of the oligosaccharide are substituted
with Fuc3NAc. Thus, the structure is Fuc3NAc–Rha–
Rha–Rha–(Fuc3NAc)–RhaOH. Sodium adduct ions
corresponding to Rha
3
Fuc3NAc and Rha
4
Fuc3NAc
were also analyzed with MALDI-PSD-TOF MS
(data not shown). As these ions only contained one
Fuc3NAc residue each, these experiments could not
provide any information concerning the Fuc3NAc distri-
bution on the Rha backbone. These experiments showed,
however, that when a Rha, not substituted with a
Fuc3NAc, was present at the reducing end and/or the
nonreducing end, the loss of Rha always resulted in ions
Fig. 7. The HPAEC chromatogram (A) of the fraction 1 and the
MALDI-TOF MS spectrum (B) of the isolated fraction 3 are displayed.
Fig. 6. MALDI-TOF MS spectra of fractions 1 (A) and 2 (B) obtained
by gel permeation chromatography after a partial acid hydrolysis of
OPS. The main ions present in the spectra are explicated.
Ó FEBS 2002 O-chain structure from Xanthomonas campestris pv. vitians (Eur. J. Biochem. 269) 4191
of considerable intensity. Thus, the absence of fragment
ions corresponding to losses of reducing end or nonre-
ducing end Rha in the PSD spectra shown in Fig. 8A
and B, probably reflects structural features of the studied
ions and not inherent low abundance of such fragment
ions.
It should be noted, however, that the samples analyzed by
MALDI-TOF MS were produced by partial hydrolysis of
the polysaccharide thus the distribution of the proposed
oligosaccharide fragments in the OPS is random. On the
other hand the distribution of Fuc3NAc residues should
reflect the distribution in the native polysaccharide, actually
no free reducing Fuc3NAc was found in the analysis of the
hydrolysis products.
DISCUSSION
In conclusion, all the data suggest that the structure of this
polymer has neither a real repeating unit nor a masked one.
As it is shown below, Fuc3NAc (in italic) is a nonstoichio-
metric substituents, and when present has no fixed a-Rhap
to substitute. The rhamnan backbone is more frequently a
trisaccharide, n is more frequently equal to two but it can
also assume values equal to one and to three.
The assembly of O-polysaccharide structures has been
extensively studied in animal associated bacteria, in which
they are for the most of cases rigorously repetitive. A
structural heterogeneity has been found in few OPS of
Xanthomonas campestris pvs. campestris [15], begoniae
[16], vignicola [17], Xanthomonas fragrariae [18] and Pseudo-
monas fluorescens [19]. In all of these polymers the lack of
exacting regularity is due to the presence of a monosac-
charide in nonstoichiometric amounts on the side chain.
Nevertheless, despite these examples of not strictly repetitive
polymers, the OPS from X. campestris seems to be the first
true case of an unsystematic biosynthetic polymerization.
The nonstoichiometric side branch glycosylation by Fuc3-
NAc can be considered as a post polymerization decoration,
this is well demonstrated by the finding of the homologous
polymer without any side branch in the aqueous phase.
What remains obscure still, is the assembly of the polymer
backbone, which is definitely irregular in respect to the other
examples already described in the literature [1]. In animal
pathogen bacteria, the polymerization reaction can be
conducted according to the ABC transporter pathway in
which subsequent residues are added by the glycosyl
transferases to the nonreducing end of the acceptor chain
at the cytoplasmic face [20]. In some cases a single enzyme
catalyses the formation of more linkages and this, of course,
poses difficulties for the maintenance of the fidelity of the
repetitive structure. Therefore biosynthetic studies towards
the comprehension of this irregular biosynthesis are needed.
ACKNOWLEDGEMENTS
This paper is dedicated to Prof Lorenzo Mangoni on the occasion of his
70th birthday.
A. M. is grateful to Prof M. Adinolfi for the kind gift of
D-Fuc3NAc. The 800 MHz spectra were obtained using the Varian
Unity Inova spectrometer of the Danish Instrument Center for NMR
Spectroscopy of Biological Macromolecules. The authors wish to thank
Dr Zoina for supplying cells of X. campestris.
REFERENCES
1. Corsaro, M. M., De Castro, C., Molinaro, A. & Parrilli M. (2001)
Structure of lipopolysaccharides from phytopathogenic bacteria.
In Recent Research Developments in Phytochemistry (Pandalai, G.,
ed.). Research Signpost, 5, 119–138.
Fig. 8. MALDI-PSD TOF MS spectra and fragment elucidations of
the oligosaccharide fraction 3 are shown. The fragment ions are ori-
ginated from the ions at m/z 853.4 (A) and 999.4 (B). The dotted lines
are showing the lacking of fragment ions corresponding to the presence
of a reducing end Rha or a nonreducing end Rha.
4192 A. Molinaro et al.(Eur. J. Biochem. 269) Ó FEBS 2002
2. Molinaro,A.,Evidente,A.,Lanzetta,R.,Parrilli,M.&Zoina,A.
(2000) O-specific polysaccharide structure of the aqueous lipopo-
lysaccharide fraction from Xanthomonas campestris pv. vitians
strain 1839. Carbohydr. Res. 328, 435–439.
3. Molinaro, A., Lanzetta, R., Evidente, A., Parrilli, M. & Holst, O.
(1999) Isolation and characterization of the lipopolysaccharide
from Xanthomonas hortorum pv. vitians. FEMS Microbiol. Lett.
181, 49–53.
4. Westphal, O. & Jann, K. (1965) Bacterial lipopolysaccharides:
Extraction with phenol-water and further applications of the
procedure. Methods. Carbohydr. Chem. 5, 83–91.
5. Leontein,K.&Lo
¨
nngren, J. (1978) Determination of the absolute
configuration of sugars by gas-liquid chromatography of their
acetylated 2-octyl glycosides. Methods Carbohydr. Chem. 62, 359–
362.
6. Adinolfi, M., Barone, G., Corsaro, M., Lanzetta, R., Mangoni, L.
& Monaco, P. (1995) Synthesis of methyl 3-acetamido-3,
6-dideoxy-
L
-galactopyranosides and of methyl 3-acetamido-
3,6-dideoxy-
L
-gulopyranosides by reduction of 3-ulose O-methyl-
oximes. J. Carbohydr. Chem. 14, 913–928.
7. Ciucanu, I. & Kerek, F. (1984) A simple method for the per-
methylation of carbohydrates. Carbohydr. Res. 131, 209–217.
8. Kjaer, M., Andersen, K.V. & Poulsen, F.M. (1994) Automated
and semiautomated analysis of homo- and heteronuclear multi-
dimensional nuclear magnetic resonance spectra of proteins: the
program PRONTO. Methods Enzymol. 239, 288–308.
9. Hagler, A.T., Dauber, P. & Lifson, S. (1979) Consistent force field
studies of intermolecular forces in hydrogen-bonded crystals. 3.
The C: OÆÆÆH–O hydrogen bond and the analysis of the energetics
and packing of carboxylic acids. J. Am. Chem. Soc. 101, 5131–
5141.
10. Bock, K. & Pedersen, C. (1974) Carbon-13-hydrogen coupling
constants in hexopyranoses. J. Chem. Soc., Perkin Trans. 2, 293–
297.
11. Lipkind, G.M., Shashkov, A.S., Knirel, Y.A., Vinogradov, E.V. &
Kochetkov, N.K. (1988) A computer-assisted structural analysis
of regular polysaccharides on the basis of
13
C-NMR data. Car-
bohydr. Res. 175, 59–75.
12. Shashkov, A.S., Lipkind, G.M., Knirel, Y.A. & Kochetkov, N.K.
(1988) Stereochemical factors determining the effects of glycosy-
lation on the
13
C chemical shifts in carbohydrates. Magn. Reson.
Chem. 26, 735–747.
13. Bock, K., Brignole, A. & Sigurskjold, B.W. (1986) Conforma-
tional dependence of
13
C nuclear magnetic resonance chemical
shifts in oligosaccharides. J. Chem. Soc., Perkin Trans. 2, 1711–
1713.
14. Domon, B. & Costello, C.E. (1988) A systematic nomenclature for
carbohydrate fragmentations in FAB-MS/MS spectra of glyco-
conjugates. Glycoconjugate J. 5, 397–409.
15. Molinaro, A., Evidente, A., Fiore, S., Iacobellis, N.S., Lanzetta,
R. & Parrilli, M. (2000) Structure elucidation of the O-chain from
the major lipopolysaccharide of the Xanthomonas campestris
strain 642. Carbohydr. Res. 325, 222–229.
16. Senchenkova, S.N., Shashkov, A.S., Laux, P., Knirel, Y.A. &
Rudolph, K. (1999) The O-chain polysaccharide of the lipopoly-
saccharide of Xanthomonas campestris pv. begoniae GSPB 525 is a
partially 1-xylosylated 1-rhamnan. Carbohydr. Res. 319, 148–153.
17. Senchenkova, S.N., Shashkov, A.S., Kecskes, M.L., Ahohuendo,
B.C., Knirel, Y.A. & Rudolph, K. (2000) Structure of the
O-specific polysaccharide of the lipopolysaccharides of Xantho-
monas campestris pv vignicola GSPB 2795 and GSPB. Carbohydr.
Res. 329, 831–838.
18. Molinaro, A., Evidente, A., Iacobellis, N., Lanzetta, R., Manzo,
E. & Parrilli, M. (2001) Structural determination of the O-specific
polysaccharide from the Xanthomonas fragariae lipopolysac-
charide fraction. Eur. J. Org. Chem. 5, 927–931.
19. Knirel, Y.A., Zdorovenko, G.M., Paramonov, N.A., Vere-
meychenko, S.P., Toukach, F.V. & Shashkov, A.S. (1996) Somatic
antigens of pseudomonads: structure of the O-specific poly-
saccharide of the reference strain for Pseudomonas fluorescens
(IMV 4125, ATCC 13525, biovar A). Carbohydr. Res. 291, 217–
224.
20. Keenleyside, W.J. & Whitfield, C. (1999) Genetics and biosynth-
esis of lipopolysaccharide O-antigens. In EndotoxininHealthand
Disease (Morrison, D.C., Brade, H., Opal, S. & Vogel, S., eds), pp.
331–358. M. Dekker, Inc., New York.
Ó FEBS 2002 O-chain structure from Xanthomonas campestris pv. vitians (Eur. J. Biochem. 269) 4193