Báo cáo khoa học: "Sentiment Summarization: Evaluating and Learning User Preferences" pot
Bạn đang xem bản rút gọn của tài liệu. Xem và tải ngay bản đầy đủ của tài liệu tại đây (178.08 KB, 9 trang )
Proceedings of the 12th Conference of the European Chapter of the ACL, pages 514–522,
Athens, Greece, 30 March – 3 April 2009.
c
2009 Association for Computational Linguistics
Sentiment Summarization: Evaluating and Learning User Preferences
Kevin Lerman
Columbia University
New York, NY
Sasha Blair-Goldensohn
Google, Inc.
New York, NY
Ryan McDonald
Google, Inc.
New York, NY
Abstract
We present the results of a large-scale,
end-to-end human evaluation of various
sentiment summarization models. The
evaluation shows that users have a strong
preference for summarizers that model
sentiment over non-sentiment baselines,
but have no broad overall preference be-
tween any of the sentiment-based models.
However, an analysis of the human judg-
ments suggests that there are identifiable
situations where one summarizer is gener-
ally preferred over the others. We exploit
this fact to build a new summarizer by
training a ranking SVM model over the set
of human preference judgments that were
collected during the evaluation, which re-
sults in a 30% relative reduction in error
over the previous best summarizer.
1 Introduction
The growth of the Internet as a commerce
medium, and particularly the Web 2.0 phe-
nomenon of user-generated content, have resulted
in the proliferation of massive numbers of product,
service and merchant reviews. While this means
that users have plenty of information on which to
base their purchasing decisions, in practice this is
often too much information for a user to absorb.
To alleviate this information overload, research on
systems that automatically aggregate and summa-
rize opinions have been gaining interest (Hu and
Liu, 2004a; Hu and Liu, 2004b; Gamon et al.,
2005; Popescu and Etzioni, 2005; Carenini et al.,
2005; Carenini et al., 2006; Zhuang et al., 2006;
Blair-Goldensohn et al., 2008).
Evaluating these systems has been a challenge,
however, due to the number of human judgments
required to draw meaningful conclusions. Of-
ten systems are evaluated piecemeal, selecting
pieces that can be evaluated easily and automati-
cally (Blair-Goldensohn et al., 2008). While this
technique produces meaningful evaluations of the
selected components, other components remain
untested, and the overall effectiveness of the entire
system as a whole remains unknown. When sys-
tems are evaluated end-to-end by human judges,
the studies are often small, consisting of only a
handful of judges and data points (Carenini et
al., 2006). Furthermore, automated summariza-
tion metrics like ROUGE (Lin and Hovy, 2003)
are non-trivial to adapt to this domain as they re-
quire human curated outputs.
We present the results of a large-scale, end-to-
end human evaluation of three sentiment summa-
rization models applied to user reviews of con-
sumer products. The evaluation shows that there
is no significant difference in rater preference be-
tween any of the sentiment summarizers, but that
raters do prefer sentiment summarizers over non-
sentiment baselines. This indicates that even sim-
ple sentiment summarizers provide users utility.
An analysis of the rater judgments also indicates
that there are identifiable situations where one sen-
timent summarizer is generally preferred over the
others. We attempt to learn these preferences by
training a ranking SVM that exploits the set of
preference judgments collected during the evalu-
ation. Experiments show that the ranking SVM
summarizer’s cross-validation error decreases by
as much as 30% over the previous best model.
Human evaluations of text summarization have
been undertaken in the past. McKeown et al.
(2005) presented a task-driven evaluation in the
news domain in order to understand the utility of
different systems. Also in the news domain, the
Document Understanding Conference
1
has run a
number of multi-document and query-driven sum-
marization shared-tasks that have used a wide
1
/>514
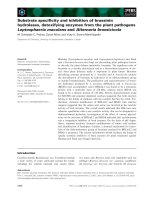
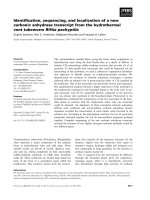
iPod Shuffle: 4/5 stars
“In final analysis the iPod Shuffle is a decent player that offers a sleek
compact form factor an excessively simple user interface and a low
price” “It’s not good for carrying a lot of music but for a little bit of
music you can quickly grab and go with this nice little toy” “Mine came
in a nice bright orange color that makes it easy to locate.”
Figure 1: An example summary.
range of automatic and human-based evaluation
criteria. This year, the new Text Analysis Con-
ference
2
is running a shared-task that contains an
opinion component. The goal of that evaluation is
to summarize answers to opinion questions about
entities mentioned in blogs.
Our work most closely resembles the evalua-
tions in Carenini et al. (2006, 2008). Carenini et
al. (2006) had raters evaluate extractive and ab-
stractive summarization systems. Mirroring our
results, they show that both extractive and abstrac-
tive summarization outperform a baseline, but that
overall, humans have no preference between the
two. Again mirroring our results, their analysis in-
dicates that even though there is no overall differ-
ence, there are situations where one system gener-
ally outperforms the other. In particular, Carenini
and Cheung (2008) show that an entity’s contro-
versiality, e.g., mid-range star rating, is correlated
with which summary has highest value.
The study presented here differs from Carenini
et al. in many respects: First, our evaluation is
over different extractive summarization systems in
an attempt to understand what model properties
are correlated with human preference irrespective
of presentation; Secondly, our evaluation is on a
larger scale including hundreds of judgments by
hundreds of raters; Finally, we take a major next
step and show that it is possible to automatically
learn significantly improved models by leveraging
data collected in a large-scale evaluation.
2 Sentiment Summarization
A standard setting for sentiment summarization
assumes a set of documents D = {d
1
, . . . , d
m
}
that contain opinions about some entity of interest.
The goal of the system is to generate a summary S
of that entity that is representative of the average
opinion and speaks to its important aspects. An
example summary is given in figure 1. For sim-
plicity we assume that all opinions in D are about
the entity being summarized. When this assump-
tion fails, one can parse opinions at a finer-level
2
/>(Jindal and Liu, 2006; Stoyanov and Cardie, 2008)
In this study, we look at an extractive summa-
rization setting where S is built by extracting rep-
resentative bits of text from the set D, subject to
pre-specified length constraints. Specifically, as-
sume each document d
i
is segmented into can-
didate text excerpts. For ease of discussion we
will assume all excerpts are sentences, but in prac-
tice they can be phrases or multi-sentence groups.
Viewed this way, D is a set of candidate sentences
for our summary, D = {s
1
, . . . , s
n
}, and summa-
rization becomes the following optimization:
arg max
S⊆D
L(S) s.t.: LENGTH(S) ≤ K (1)
where L is some score over possible summaries,
LENGTH(S) is the length of the summary and K
is the pre-specified length constraint. The defini-
tion of L will be the subject of much of this sec-
tion and it is precisely different forms of L that
will be compared in our evaluation. The nature of
LENGTH is specific to the particular use case.
Solving equation 1 is typically NP-hard, even
under relatively strong independence assumptions
between the sentences selected for the summary
(McDonald, 2007). In cases where solving L is
non-trivial we use an approximate hill climbing
technique. First we randomly initialize the sum-
mary S to length ∼K. Then we greedily in-
sert/delete/swap sentences in and out of the sum-
mary to maximize L(S) while maintaining the
bound on length. We run this procedure until no
operation leads to a higher scoring summary. In
all our experiments convergence was quick, even
when employing random restarts.
Alternate formulations of sentiment summa-
rization are possible, including aspect-based sum-
marization (Hu and Liu, 2004a), abstractive sum-
marization (Carenini et al., 2006) or related tasks
such as opinion attribution (Choi et al., 2005). We
choose a purely extractive formulation as it makes
it easier to develop baselines and allows raters to
compare summaries with a simple, consistent pre-
sentation format.
2.1 Definitions
Before delving into the details of the summariza-
tion models we must first define some useful func-
tions. The first is the sentiment polarity func-
tion that maps a lexical item t, e.g., word or short
phrase, to a real-valued score,
LEX-SENT(t) ∈ [−1, 1]
515
The LEX-SENT function maps items with positive
polarity to higher values and items with negative
polarity to lower values. To build this function we
constructed large sentiment lexicons by seeding a
semantic word graph induced from WordNet with
positive and negative examples and then propagat-
ing this score out across the graph with a decaying
confidence. This method is common among sen-
timent analysis systems (Hu and Liu, 2004a; Kim
and Hovy, 2004; Blair-Goldensohn et al., 2008).
In particular, we use the lexicons that were created
and evaluated by Blair-Goldensohn et al. (2008).
Next we define sentiment intensity,
INTENSITY(s) =
t∈s
|LEX-SENT(t)|
which simply measures the magnitude of senti-
ment in a sentence. INTENSITY can be viewed as a
measure of subjectiveness irrespective of polarity.
A central function in all our systems is a sen-
tences normalized sentiment,
SENT(s) =
t∈s
LEX-SENT(t)
α + INTENSITY(s)
This function measures the (signed) ratio of lexical
sentiment to intensity in a sentence. Sentences that
only contain lexical items of the same polarity will
have high absolute normalized sentiment, whereas
sentences with mixed polarity items or no polar-
ity items will have a normalized sentiment near
zero. We include the constant α in the denomi-
nator so that SENT gives higher absolute scores to
sentences containing many strong sentiment items
of the same polarity over sentences with a small
number of weak items of the same polarity.
Most sentiment summarizers assume that as in-
put, a system is given an overall rating of the en-
tity it is attempting to summarize, R ∈ [−1, 1],
where a higher rating indicates a more favorable
opinion. This rating may be obtained directly from
user provided information (e.g., star ratings) or au-
tomatically derived by averaging the SENT func-
tion over all sentences in D. Using R, we can de-
fine a mismatch function between the sentiment of
a summary and the known sentiment of the entity,
MISMATCH(S) = (R −
1
|S|
s
i
∈S
SENT(s
i
))
2
Summaries with a higher mismatch are those
whose sentiment disagrees most with R.
Another key input many sentiment summarizers
assume is a list of salient entity aspects, which are
specific properties of an entity that people tend to
rate when expressing their opinion. For example,
aspects of a digital camera could include picture
quality, battery life, size, color, value, etc. Find-
ing such aspects is a challenging research problem
that has been addressed in a number of ways (Hu
and Liu, 2004b; Gamon et al., 2005; Carenini et
al., 2005; Zhuang et al., 2006; Branavan et al.,
2008; Blair-Goldensohn et al., 2008; Titov and
McDonald, 2008b; Titov and McDonald, 2008a).
We denote the set of aspects for an entity as A and
each aspect as a ∈ A. Furthermore, we assume
that given A it is possible to determine whether
some sentence s ∈ D mentions an aspect in A.
For our experiments we use a hybrid supervised-
unsupervised method for finding aspects as de-
scribed and evaluated in Blair-Goldensohn et al.
(2008).
Having defined what an aspect is, we next de-
fine a summary diversity function over aspects,
DIVERSITY(S) =
a∈A
COVERAGE(a)
where COVERAGE(a) ∈ R is a function that
weights how well the aspect is covered in the
summary and is proportional to the importance of
the aspect as some aspects are more important to
cover than others, e.g., “picture quality” versus
“strap” for digital cameras. The diversity func-
tion rewards summaries that cover many important
aspects and plays the redundancy reducing role
that is common in most extractive summarization
frameworks (Goldstein et al., 2000).
2.2 Systems
For our evaluation we developed three extractive
sentiment summarization systems. Each system
models increasingly complex objectives.
2.2.1 Sentiment Match (SM)
The first system that we look at attempts to ex-
tract sentences so that the average sentiment of the
summary is as close as possible to the entity level
sentiment R, which was previously defined in sec-
tion 2.1. In this case L can be simply defined as,
L(S) = −MISMATCH(S)
Thus, the model prefers summaries with average
sentiment as close as possible to the average sen-
timent across all the reviews.
516
There is an obvious problem with this model.
For entities that have a mediocre rating, i.e., R ≈
0, the model could prefer a summary that only
contains sentences with no opinion whatsoever.
There are two ways to alleviate this problem. The
first is to include the INTENSITY function into L,
L(S) = α · INTENSITY(S) − β · MISMATCH(S)
Where the coefficients allow one to trade-off sen-
timent intensity versus sentiment mismatch.
The second method, and the one we chose based
on initial experiments, was to address the problem
at inference time. This is done by prohibiting the
algorithm from including a given positive or nega-
tive sentence in the summary if another more pos-
itive/negative sentence is not included. Thus the
summary is forced to consist of only the most pos-
itive and most negative sentences, the exact mix
being dependent upon the overall star rating.
2.2.2 Sentiment Match + Aspect Coverage
(SMAC)
The SM model extracts sentences for the summary
without regard to the content of each sentence rel-
ative to the others in the summary. This is in con-
trast to standard summarization models that look
to promote sentence diversity in order to cover as
many important topics as possible (Goldstein et
al., 2000). The sentiment match + aspect cov-
erage system (SMAC) attempts to model diver-
sity by building a summary that trades-off max-
imally covering important aspects with matching
the overall sentiment of the entity. The model does
this through the following linear score,
L(S) = α · INTENSITY(S) − β · MISMATCH(S)
+γ · DIVERSITY(S)
This score function rewards summaries for be-
ing highly subjective (INTENSITY), reflecting the
overall product rating (MISMATCH), and covering
a variety of product aspects (DIVERSITY). The co-
efficients were set by inspection.
This system has its roots in event-based summa-
rization (Filatova and Hatzivassiloglou, 2004) for
the news domain. In that work an optimization
problem was developed that attempted to maxi-
mize summary informativeness while covering as
many (weighted) sub-events as possible.
2.2.3 Sentiment-Aspect Match (SAM)
Because the SMAC model only utilizes an entity’s
overall sentiment when calculating MISMATCH, it
is susceptible to degenerate solutions. Consider a
product with aspects A and B, where reviewers
overwhelmingly like A and dislike B, resulting in
an overall SENT close to zero. If the SMAC model
finds a very negative sentence describing A and
a very positive sentence describing B, it will as-
sign that summary a high score, as the summary
has high intensity, has little overall mismatch, and
covers both aspects. However, in actuality, the
summary is entirely misleading.
To address this issue, we constructed the
sentiment-aspect match model (SAM), which not
only attempts to cover important aspects, but cover
them with appropriate sentiment. There are many
ways one might design a model to do this, includ-
ing linear combinations of functions similar to the
SMAC model. However, we decided to employ a
probabilistic approach as it provided performance
benefits based on development data experiments.
Under the SAM model, each sentence is treated as
a bag of aspects and their corresponding mentions’
sentiments. For a given sentence s, we define A
s
as the set of aspects mentioned within it. For a
given aspect a ∈ A
s
, we denote SENT(a
s
) as the
sentiment associated with the textual mention of a
in s. The probability of a sentence is defined as,
p(s) = p(a
1
, . . . , a
n
, SENT(a
1
s
), . . . , SENT(a
n
s
))
which can be re-written as,
a∈A
s
p(a, SENT(a
s
)) =
a∈A
s
p(a)p(SENT(a
s
)|a)
if we assume aspect mentions are generated inde-
pendently of one another. Thus we need to esti-
mate both p(a) and p(SENT(a
s
)|a). The probabil-
ity of seeing an aspect, p(a), is simply set to the
maximum likelihood estimates over the data set
D. Furthermore, we assume that p(SENT(a
s
)|a)
is normal about the mean sentiment for the as-
pect µ
a
with a constant standard deviation, σ
a
.
The mean and standard deviation are estimated
straight-forwardly using the data set D. Note that
the number of parameters our system must es-
timate is very small. For every possible aspect
a ∈ A we need three values: p(a), µ
a
, and σ
a
.
Since |A| is typically small – on the order of 5-10
– it is not difficult to estimate these models even
from small sets of data.
Having constructed this model, one logical ap-
proach to summarization would be to select sen-
tences for the summary that have highest proba-
bility under the model trained on D. We found,
517
however, that this produced very redundant sum-
maries – if one aspect is particularly prevalent in
a product’s reviews, this approach will select all
sentences about that aspect, and discuss nothing
else. To combat this we developed a technique that
scores the summary as a whole, rather than by in-
dividual components. First, denote SAM(D) as the
previously described model learned over the set of
entity documents D. Next, denote SAM(S) as an
identical model, but learned over a candidate sum-
mary S, i.e., given a summary S, compute p(a),
m
a
, and σ
a
for all a ∈ A using only the sentences
from S. We can then measure the difference be-
tween these models using KL-divergence:
L(S) = −KL(SAM(D), SAM(S))
In our case we have 1 + |A| distributions – p(a),
and p(·|a) for all a ∈ A – so we just sum the KL-
divergence of each. The key property of the SAM
system is that it naturally builds summaries where
important aspects are discussed with appropriate
sentiment, since it is precisely these aspects that
will contribute the most to the KL-divergence. It
is important to note that the short length of a can-
didate summary S can make estimates in SAM(S)
rather crude. But we only care about finding the
“best” of a set of crude models, not about finding
one that is “good” in absolute terms. Between the
few parameters we must learn and the specific way
we use these models, we generally get models use-
ful for our purposes.
Alternatively we could have simply incorpo-
rated the DIVERSITY measure into the objec-
tive function or used an inference algorithm that
specifically accounts for redundancy, e.g., maxi-
mal marginal relevance (Goldstein et al., 2000).
However, we found that this solution was well
grounded and required no tuning of coefficients.
Initial experiments indicated that the SAM sys-
tem, as described above, frequently returned sen-
tences with low intensity when important aspects
had luke-warm sentiment. To combat this we re-
moved low intensity sentences from consideration,
which had the effect of encouraging important
luke-warm aspects to mentioned multiple times in
order to balance the overall sentiment.
Though the particulars of this model are unique,
fundamentally it is closest to the work of Hu and
Liu (2004a) and Carenini et al. (2006).
3 Experiments
We evaluated summary performance for reviews
of consumer electronics. In this setting an entity
to be summarized is one particular product, D is
a set of user reviews about that product, and R is
the normalized aggregate star ratings left by users.
We gathered reviews for 165 electronics products
from several online review aggregators. The prod-
ucts covered a variety of electronics, such as MP3
players, digital cameras, printers, wireless routers,
and video game systems. Each product had a min-
imum of four reviews and up to a maximum of
nearly 3000. The mean number of reviews per
product was 148, and the median was 70. We
ran each of our algorithms over the review corpus
and generated summaries for each product with
K = 650. All summaries were roughly equal
length to avoid length-based rater bias
3
. In total
we ran four experiments for a combined number of
1980 rater judgments (plus additional judgments
during the development phase of this study).
Our initial set of experiments were over the
three opinion-based summarization systems: SM,
SMAC, and SAM. We ran three experiments com-
paring SMAC to SM, SAM to SM, and SAM to
SMAC. In each experiment two summaries of the
same product were placed side-by-side in a ran-
dom order. Raters were also shown an overall rat-
ing, R, for each product (these ratings are often
provided in a form such as “3.5 of 5 stars”). The
two summaries on either side were shown below
this information with links to the full text of the
reviews for the raters to explore.
Raters were asked to express their preference
for one summary over the other. For two sum-
maries S
A
and S
B
they could answer,
1. No preference
2. Strongly preferred S
A
(or S
B
)
3. Preferred S
A
(or S
B
)
4. Slightly preferred S
A
(or S
B
)
Raters were free to choose any rating, but were
specifically instructed that their rating should ac-
count for a summaries representativeness of the
overall set of reviews. Raters were also asked
to provide a brief comment justifying their rat-
ing. Over 100 raters participated in each study,
and each comparison was evaluated by three raters
with no rater making more than five judgments.
3
In particular our systems each extracted four text ex-
cerpts of roughly 160-165 characters.
518
Comparison (A v B) Agreement (%) No Preference (%) Preferred A (%) Preferred B (%) Mean Numeric
SM v SMAC 65.4 6.0 52.0 42.0 0.01
SAM v SM 69.3 16.8 46.0 37.2 0.01
SAM v SMAC
†
73.9 11.5 51.6 36.9 0.08
SMAC v LT
†
64.1 4.1 70.4 25.5 0.24
Table 1: Results of side-by-side experiments. Agreement is the percentage of items for which all raters
agreed on a positive/negative/no-preference rating. No Preference is the percentage of agreement items
in which the raters had no preference. Preferred A/B is the percentage of agreement items in which the
raters preferred either A or B respectively. Mean Numeric is the average of the numeric ratings (converted
from discreet preference decisions) indicating on average the raters preferred system A over B on a scale
of -1 to 1. Positive scores indicate a preference for system A. † significant at a 95% confidence interval
for the mean numeric score.
We chose to have raters leave pairwise prefer-
ences, rather than evaluate each candidate sum-
mary in isolation, because raters can make a pref-
erence decisions more quickly than a valuation
judgment, which allowed for collection of more
data points. Furthermore, there is evidence that
rater agreement is much higher in preference deci-
sions than in value judgments (Ariely et al., 2008).
Results are shown in the first three rows of ta-
ble 1. The first column of the table indicates the
experiment that was run. The second column indi-
cates the percentage of judgments for which the
raters were in agreement. Agreement here is a
weak agreement, where three raters are defined to
be in agreement if they all gave a no preference rat-
ing, or if there was a preference rating, but no two
preferences conflicted. The next three columns in-
dicate the percentage of judgments for each pref-
erence category, grouped here into three coarse as-
signments. The final column indicates a numeric
average for the experiment. This was calculated
by converting users ratings to a scale of 1 (strongly
preferred S
A
) to -1 (strongly preferred S
B
) at 0.33
intervals. Table 1 shows only results for items in
which the raters had agreement in order to draw
reliable conclusions, though the results change lit-
tle when all items are taken into account.
Ultimately, the results indicate that none of the
sentiment summarizers are strongly preferred over
any other. Only the SAM v SMAC model has a
difference that can be considered statistically sig-
nificant. In terms of order we might conclude that
SAM is the most preferred, followed by SM, fol-
lowed by SMAC. However, the slight differences
make any such conclusions tenuous at best. This
leads one to wonder whether raters even require
any complex modeling when summarizing opin-
ions. To test this we took the lowest scoring model
overall, SMAC, and compared it to a leading text
baseline (LT) that simply selects the first sentence
from a ranked list of reviews until the length con-
straint is violated. The results are given in the last
row of 1. Here there is a clear distinction as raters
preferred SMAC to LT, indicating that they did
find usefulness in systems that modeled aspects
and sentiment. However, there are still 25.5%
of agreement items where the raters did choose a
simple leading text baseline.
4 Analysis
Looking more closely at the results we observed
that, even though raters did not strongly prefer
any one sentiment-aware summarizer over another
overall, they mostly did express preferences be-
tween systems on individual pairs of comparisons.
For example, in the SAM vs SM experiment, only
16.8% of the comparisons yielded a “no prefer-
ence” judgment from all three raters – by far the
highest percentage of any experiment. This left
83.2% “slight preference” or higher judgments.
With this in mind we began examining the com-
ments left by raters throughout all our experi-
ments, including a set of additional experiments
used during development of the systems. We ob-
served several trends: 1) Raters tended to pre-
fer summaries with lists, e.g., pros-cons lists; 2)
Raters often did not like text without sentiment,
hence the dislike of the leading text system where
there is no guarantee that the first sentence will
have any sentiment; 3) Raters disliked overly gen-
eral comments, e.g., “The product was good”.
These statements carry no additional information
over a product’s overall star rating; 4) Raters did
recognize (and strongly disliked) when the overall
sentiment of the summary was inconsistent with
the star rating; 5) Raters tended to prefer different
519
systems depending on what the star rating was. In
particular, the SMAC system was generally pre-
ferred for products with neutral overall ratings,
whereas the SAM system is preferred for products
with ratings at the extremes. We hypothesize that
SAM’s low performance on neutral rated products
is because the system suffers from the dual imper-
atives of selecting high intensity snippets and of
selecting snippets that individually reflect partic-
ular sentiment polarities. When the desired senti-
ment polarity is neutral, it is difficult to find a snip-
pet with lots of sentiment, whose overall polarity
is still neutral, thus SAM may either ignore that
aspect or include multiple mentions of that aspect
at the expense of others; 6) Raters also preferred
summaries with grammatically fluent text, which
benefitted the leading text baseline.
These observations suggest that we could build
a new system that takes into account all these
factors (weighted accordingly) or we could build
a rule-based meta-classifier that selects a single
summary from the four systems described in this
paper based on the global characteristics of each.
The problem with the former is that it will require
hand-tuning of coefficients for many different sig-
nals that are all, for the most part, weakly corre-
lated to summary quality. The problem with the
latter is inefficiency, i.e., it will require the main-
tenance and output of all four systems. In the next
section we explore an alternate method that lever-
ages the data gathered in the evaluation to auto-
matically learn a new model. This approach is
beneficial as it will allow any coefficients to be au-
tomatically tuned and will result in a single model
that can be used to build new summaries.
5 Summarization with Ranking SVMs
Besides allowing us to assess the relative perfor-
mance of our summarizers, our evaluation pro-
duced several hundred points of empirical data in-
dicating which among two summaries raters pre-
fer. In this section we explore how to build im-
proved summarizers with this data by learning
preference ranking SVMs, which are designed to
learn relative to a set of preference judgments
(Joachims, 2002).
A ranking SVM typically assumes as input a set
of queries and associated partial ordering on the
items returned by the query. The training data is
defined as pairs of points, T = {(x
k
i
, x
k
j
)
t
}
|T |
t=1
,
where each pair indicates that the i
th
item is pre-
ferred over the j
th
item for the k
th
query. Each
input point x
k
i
∈ R
m
is a feature vector repre-
senting the properties of that particular item rel-
ative to the query. The goal is to learn a scoring
function s(x
k
i
) ∈ R such that s(x
k
i
) > s(x
k
j
) if
(x
k
i
, x
k
j
) ∈ T . In other words, a ranking SVM
learns a scoring function whose induced ranking
over data points respects all preferences in the
training data. The most straight-forward scoring
function, and the one used here, is a linear classi-
fier, s(x
k
i
) = w · x
k
i
, making the goal of learning
to find an appropriate weight vector w ∈ R
m
.
In its simplest form, the ranking SVM opti-
mization problem can be written as the following
quadratic programming problem,
min
1
2
||w||
2
s.t.: ∀(x
k
i
, x
k
j
) ∈ T ,
s(x
k
i
) − s(x
k
j
) ≥ PREF(x
k
i
, x
k
j
)
where PREF(x
k
i
, x
k
j
) ∈ R is a function indicating
to what degree item x
k
i
is preferred over x
k
j
(and
serves as the margin of the classifier). This opti-
mization is well studied and can be solved with a
wide variety of techniques. In our experiments we
used the SVM-light software package
4
.
Our summarization evaluation provides us with
precisely a large collection of preference points
over different summaries for different product
queries. Thus, we naturally have a training set T
where each query is analogous to a specific prod-
uct of interest and training points are two possi-
ble summarizations produced by two different sys-
tems with corresponding rater preferences. As-
suming an appropriate choice of feature represen-
tation it is straight-forward to then train the model
on our data using standard techniques for SVMs.
To train and test the model we compiled 1906
pairs of summary comparisons, each judged by
three different raters. These pairs were extracted
from the four experiments described in section 3
as well as the additional experiments we ran dur-
ing development. For each pair of summaries
(S
k
i
, S
k
j
) (for some product query indexed by k),
we recorded how many raters preferred each of the
items as v
k
i
and v
k
j
respectively, i.e., v
k
i
is the num-
ber of the three raters who preferred summary S
i
over S
j
for product k. Note that v
k
i
+ v
k
j
does not
necessarily equal 3 since some raters expressed no
preference between them. We set the loss function
PREF(S
k
i
, S
k
j
) = v
k
i
− v
k
j
, which in some cases
4
/>520
could be zero, but never negative since the pairs
are ordered. Note that this training set includes all
data points, even those in which raters disagreed.
This is important as the model can still learn from
these points as the margin function PREF encodes
the fact that these judgments are less certain.
We used a variety of features for a candidate
summary: how much capitalization, punctuation,
pros-cons, and (unique) aspects a summary had;
the overall intensity, sentiment, min sentence sen-
timent, and max sentence sentiment in the sum-
mary; the overall rating R of the product; and con-
junctions of these. Note that none of these fea-
tures encode which system produced the summary
or which experiment it was drawn from. This is
important, as it allows the model to be used as
standalone scoring function, i.e., we can set L to
the learned linear classifier s(S). Alternatively
we could have included features like what system
was the summary produced from. This would have
helped the model learn things like the SMAC sys-
tem is typically preferred for products with mid-
range overall ratings. Such a model could only be
used to rank the outputs of other summarizers and
cannot be used standalone.
We evaluated the trained model by measuring
its accuracy on predicting a single preference pre-
diction, i.e., given pairs of summaries (S
k
i
, S
k
j
),
how accurate is the model at predicting that S
i
is
preferred to S
j
for product query k? We measured
10-fold cross-validation accuracy on the subset of
the data for which the raters were in agreement.
We measure accuracy for both weak agreement
cases (at least one rater indicated a preference and
the other two raters were in agreement or had no
preference) and strong agreement cases (all three
raters indicated the same preference). We ignored
pairs in which all three raters made a no preference
judgment as both summaries can can be consid-
ered equally valid. Furthermore, we ignored pairs
in which two raters indicated conflicting prefer-
ences as there is no gold standard for such cases.
Results are given in table 2. We compare the
ranking SVM summarizer to a baseline system
that always selects the overall-better-performing
summarization system from the experiment that
the given datapoint was drawn from, e.g., for all
the data points drawn from the SAM versus SMAC
experiment, the baseline always chooses the SAM
summary as its preference. Note that in most ex-
periments the two systems emerged in a statistical
Preference Prediction Accuracy
Weak Agr. Strong Agr.
Baseline 54.3% 56.9%
Ranking SVM 61.8% 69.9%
Table 2: Accuracies for learned summarizers.
tie, so this baseline performs only slightly better
than chance. Table 2 clearly shows that the rank-
ing SVM can predict preference accuracy much
better than chance, and much better than that ob-
tained by using only one summarizer (a reduction
in error of 30% for strong agreement cases).
We can thus conclude that the data gathered
in human preference evaluation experiments, such
as the one presented here, have a beneficial sec-
ondary use as training data for constructing a new
and more accurate summarizer. This raises an
interesting line of future research: can we iter-
ate this process to build even better summariz-
ers? That is, can we use this trained summarizer
(and variants of it) to generate more examples for
raters to judge, and then use that data to learn even
more powerful summarizers, which in turn could
be used to generate even more training judgments,
etc. This could be accomplished using Mechani-
cal Turk
5
or another framework for gathering large
quantities of cheap annotations.
6 Conclusions
We have presented the results of a large-scale eval-
uation of different sentiment summarization algo-
rithms. In doing so, we explored different ways
of using sentiment and aspect information. Our
results indicated that humans prefer sentiment in-
formed summaries over a simple baseline. This
shows the usefulness of modeling sentiment and
aspects when summarizing opinions. However,
the evaluations also show no strong preference be-
tween different sentiment summarizers. A detailed
analysis of the results led us to take the next step
in this line of research – leveraging preference
data gathered in human evaluations to automati-
cally learn new summarization models. These new
learned models show large improvements in pref-
erence prediction accuracy over the previous sin-
gle best model.
Acknowledgements: The authors would like to
thank Kerry Hannan, Raj Krishnan, Kristen Parton
and Leo Velikovich for insightful discussions.
5
521
References
D. Ariely, G. Loewenstein, and D. Prelec. 2008. Co-
herent arbitrariness: Stable demand curves without
stable preferences. The Quarterly Journal of Eco-
nomics, 118:73105.
S. Blair-Goldensohn, K. Hannan, R. McDonald,
T. Neylon, G.A. Reis, and J. Reynar. 2008. Building
a sentiment summarizer for local service reviews. In
WWW Workshop on NLP in the Information Explo-
sion Era.
S.R.K. Branavan, H. Chen, J. Eisenstein, and R. Barzi-
lay. 2008. Learning document-level semantic prop-
erties from free-text annotations. In Proceedings of
the Annual Conference of the Association for Com-
putational Linguistics (ACL).
G. Carenini and J. Cheung. 2008. Extractive vs. nlg-
based abstractive summarization of evaluative text:
The effect of corpus controversiality. In Interna-
tional Conference on Natural Language Generation
(INLG).
G. Carenini, R.T. Ng, and E. Zwart. 2005. Extract-
ing knowledge from evaluative text. In Proceedings
of the International Conference on Knowledge Cap-
ture.
G. Carenini, R. Ng, and A. Pauls. 2006. Multi-
document summarization of evaluative text. In Pro-
ceedings of the Conference of the European Chap-
ter of the Association for Computational Linguistics
(EACL).
Y. Choi, C. Cardie, E. Riloff, and S. Patwardhan. 2005.
Identifying sources of opinions with conditional ran-
dom fields and extraction patterns. In Proceedings
the Joint Conference on Human Language Technol-
ogy and Empirical Methods in Natural Language
Processing (HLT-EMNLP).
E. Filatova and V. Hatzivassiloglou. 2004. A formal
model for information selection in multi-sentence
text extraction. In Proceedings of the International
Conference on Computational Linguistics (COL-
ING).
M. Gamon, A. Aue, S. Corston-Oliver, and E. Ringger.
2005. Pulse: Mining customer opinions from free
text. In Proceedings of the 6th International Sympo-
sium on Intelligent Data Analysis (IDA).
J. Goldstein, V. Mittal, J. Carbonell, and
M. Kantrowitz. 2000. Multi-document sum-
marization by sentence extraction. In Proceedings
of the ANLP/NAACL Workshop on Automatic
Summarization.
M. Hu and B. Liu. 2004a. Mining and summariz-
ing customer reviews. In Proceedings of the Inter-
national Conference on Knowledge Discovery and
Data Mining (KDD).
M. Hu and B. Liu. 2004b. Mining opinion features in
customer reviews. In Proceedings of National Con-
ference on Artificial Intelligence (AAAI).
N. Jindal and B. Liu. 2006. Mining comprative sen-
tences and relations. In Proceedings of 21st Na-
tional Conference on Artificial Intelligence (AAAI).
T. Joachims. 2002. Optimizing search engines using
clickthrough data. In Proceedings of the ACM Con-
ference on Knowledge Discovery and Data Mining
(KDD).
S.M. Kim and E. Hovy. 2004. Determining the senti-
ment of opinions. In Proceedings of Conference on
Computational Linguistics (COLING).
C.Y. Lin and E. Hovy. 2003. Automatic evaluation
of summaries using n-gram cooccurrence statistics.
In Proceedings of the Conference on Human Lan-
guage Technologies and the North American Chap-
ter of the Association for Computational Linguistics
(HLT-NAACL).
R. McDonald. 2007. A Study of Global Inference
Algorithms in Multi-document Summarization. In
Proceedings of the European Conference on Infor-
mation Retrieval (ECIR).
K. McKeown, R.J. Passonneau, D.K. Elson,
A. Nenkova, and J. Hirschberg. 2005. Do
Summaries Help? A Task-Based Evaluation of
Multi-Document Summarization. In Proceedings
of the ACM SIGIR Conference on Research and
Development in Information Retrieval.
A.M. Popescu and O. Etzioni. 2005. Extracting prod-
uct features and opinions from reviews. In Proceed-
ings of the Conference on Empirical Methods in Nat-
ural Language Processing (EMNLP).
V. Stoyanov and C. Cardie. 2008. Topic identification
for fine-grained opinion analysis. In Proceedings of
the Conference on Computational Linguistics (COL-
ING).
I. Titov and R. McDonald. 2008a. A joint model of
text and aspect ratings. In Proceedings of the An-
nual Conference of the Association for Computa-
tional Linguistics (ACL).
I. Titov and R. McDonald. 2008b. Modeling on-
line reviews with multi-grain topic models. In Pro-
ceedings of the Annual World Wide Web Conference
(WWW).
L. Zhuang, F. Jing, and X.Y. Zhu. 2006. Movie re-
view mining and summarization. In Proceedings
of the International Conference on Information and
Knowledge Management (CIKM).
522