Báo cáo Y học: C-labelling experiments potx
Bạn đang xem bản rút gọn của tài liệu. Xem và tải ngay bản đầy đủ của tài liệu tại đây (168.72 KB, 6 trang )
Analysis of flux estimates based on
13
C-labelling experiments
Bjarke Christensen*, Andreas Karoly Gombert† and Jens Nielsen
Center for Process Biotechnology, BioCentrum DTU, Technical University of Denmark, DK-2800 kg. Lyngby, Denmark
Modelling of the fluxes in central metabolism can be
performed by combining labelling experiments with meta-
bolite balancing. Using this approach, multiple samples
from a cultivation of Saccharomyces cerevisiae in metabolic
and isotopic steady state were analysed, and the metabolic
fluxes in central metabolism were estimated. In the various
samples, the estimates of the central metabolic pathways, the
tricarboxylic acid cycle, the oxidative pentose phosphate
pathway and the anaplerotic pathway, showed an unprece-
dented reproducibility. The high reproducibility was
obtained with fractional labellings of individual carbon
atoms as the calculational base, illustrating that the more
complex modelling using isotopomers is not necessarily
superior with respect to reproducibility of the flux estimates.
Based on these results some general difficulties in flux
estimation are discussed.
Keywords: metabolic network analysis; GC-MS; labelling
experiments; pentose phosphate pathway.
Methods for quantifying intracellular fluxes are important
for understanding the interactions of the pathways in
metabolic networks, and such methods are therefore
essential for the metabolic engineering approach to redi-
recting the metabolism towards production of desired
metabolites. Flux estimation methods may be based on
metabolite balances over intracellular metabolites, labelling
experiments, or a combination of metabolite balances and
labelling experiments. Thus, much information has been
obtained from metabolite balances, which have been used to
study carbon flux distribution, redox metabolism and
energetics of cellular metabolism [1]. This method is
mathematically attractive, as the equation system arising
from metabolite balancing is linear. The metabolite balan-
cing approach leads to estimates of the individual fluxes, but
if only relative activities of certain pathways are of interest, a
method based exclusively on labelling experiments, so-called
metabolic flux ratio analysis, can be used [2]. However, to
extract the most information on a metabolic network, it is
necessary to use a combination of metabolite balances and
labelling experiments, as illustrated by the studies of
Corynebacterium glutamicum and Penicillium chrysogenum
[3,4]. The mathematical problem of estimating metabolic
fluxes from a combination of metabolite balances and
labelling experiments is complex [5,6] and analytical solu-
tions to the problem are therefore difficult or impossible to
obtain. Reversible reactions, in particular, add to the
complexity of the system, as the degree of reversibility
cannot be addressed by mass balances. Thus, to apply
labelling balancing to such systems, it is necessary to use
models that account for the transitions of carbon atoms that
occur in reversible reactions [3]. In particular, the combina-
tion of several reversible reactions that is encountered in the
pentose phosphate pathway (PP pathway) constitutes a
highly complex system that may seriously affect the
estimation of the physiologically important flux through
the oxidative PP pathway [7]. Considerable efforts have
therefore been put into developing efficient numerical
methods that can handle the complexity of the nonlinear
equations derived from the labelling experiments [5,8]. The
numerical methods may operate either with metabolite
isotopomers, which give a complete description of the
labelling state of a metabolite pool, or with fractional
labellings of the individual carbon atom positions in a
metabolite. There is a quite substantial difference in the
complexity of these two approaches, and although the
general approach, i.e. the isotopomer-based method, is
intrinsically superior to the fractional labelling-based
method, the latter is often applied because of its relative
simplicity.
The labelling experiments are typically performed as
continuous cultures that are fed with labelled glucose as the
sole carbon source. When isotopic steady state is reached,
the hydrolysed biomass is analysed with respect to the
labelling patterns of the amino acids and sometimes also
glucose and other carbohydrates. The amino acids and
carbohydrates are derived from central metabolites, and due
to the isotopic steady state, the labelling patterns of the
central metabolites (which are the labelling patterns used for
flux estimation) are reflected by the labelling patterns of
these compounds [3]. The labelling patterns may be
analysed by either NMR spectroscopy or GC-MS [2–4].
Depending on the situation, the two techniques have
different advantages. For instance, the NMR method has
proved to be very useful for investigating aspects related to
lysine biosynthesis [9], while the GC-MS technique has been
shown to be well suited for studying the relative rates of
amino acid biosynthesis and amino acid uptake from the
medium [10,11]. While the two techniques are generally
comparable with respect to the information on the labelling
Correspondence to J. Nielsen, Center for Process Biotechnology,
BioCentrum DTU, Technical University of Denmark,
DK-2800 Kgs. Lyngby, Denmark.
Abbreviations: PP pathway, pentose phosphate pathway.
*Present address: Novozymes A/S, Krogshøjvej 36, DK-2880
Bagsværd, Denmark
Present address: Departamento de Engenharia Quı
´
mica,
University of Sa
˜
o Paulo, Brazil.
(Received 3 September 2001, revised 19 April 2002,
accepted 26 April 2002)
Eur. J. Biochem. 269, 2795–2800 (2002) Ó FEBS 2002 doi:10.1046/j.1432-1033.2002.02959.x
patterns, a GC-MS method is favoured by a higher
sensitivity, which is important as labelling experiments
typically are carried out on a small scale. Thus, to obtain
sufficient biomass for the NMR analysis to be feasible, the
entire biomass content of the bioreactor is often needed, and
the experiment therefore has to be terminated [2,3]. This
means that statistical analysis of flux estimates based on the
NMR analysis is based on a single sample, and the isotopic
steady-state condition, i.e. the condition where a stationary
state of isotope enrichment is reached, is therefore not
experimentally verified. In this study, a GC-MS method was
used to measure the labelling pattern of the biomass in the
waste stream from the chemostat of Saccharomyces cere-
visiae [12]. The labelling patterns that were measured in the
chemostat of S. cerevisiae verified the isotopic steady state,
and by performing the flux estimation on the basis of
the labelling patterns of each sample, a measure of the
reproducibility of the flux estimates was obtained. The
isotopomer-based method is compared with the fractional
labelling-based approach, and the flux estimates are
discussed with respect to their reliability as indicators of
physiological conditions.
METHODS
Cultivation
The cultivation, which is identical to the chemostat cultiva-
tion described by Gombert et al. [12], was carried out as a
continuous cultivation in a bioreactor with a working
volume of 150 mL and a dilution rate of 0.1Æh
)1
. Cultivation
was started as a batch culture containing naturally labelled
glucose as the sole carbon source. After the batch phase, the
culture was switched to continuous operation by starting
feeding with medium identical to the medium used for the
batch cultivation. The volume was kept constant by a
continuously operating pump. When metabolic steady state
had been reached, the feed was changed to a medium
identical to the previous media, but containing [1-
13
C]glu-
cose as the sole carbon source. Samples for the labelling
analysis were taken by collecting waste over a time interval
of 1 h, corresponding to a volume of 15 mL. Details on
the cultivation conditions and sample treatment are given in
Gombert et al.[12].
Labelling and flux analysis
The flux analysis was based on the labelling patterns of
derivatives of the glucose and the amino acids that were
obtained from acid hydrolysis of the biomass. Thus, one
glucose derivative, glucose pentaacetate, and two different
amino acid derivatives, N-ethoxycarbonyl amino acid ethyl
esters and N-(N¢,N¢-dimethyl)methylene amino acid ethyl
esters, were synthesized and analysed by GC-MS [4,13]. The
mass spectra obtained from the GC-MS analysis were
converted into so-called summed fractional labellings, which
were used in the flux estimation procedure. The summed
fractional labelling of a molecule or of a fragment hereof is
identical to the sum of the fractional labellings of the carbon
atoms contained in the molecule or fragment. Summed
fractional labellings are very useful in combination with
GC-MS, as they can be calculated directly from the mass
isotopomer distribution [4]. The flux estimation was based
on a combination of labelling balances and metabolite
balances, where the set of fluxes giving the best fit to the
measured labelling and metabolite data is found by an
iterative process [4]. Thus, the estimated flux distribution for
each sample will be affected by all types of variations that
could possibly be associated with the steady-state assump-
tion, the sampling and measurement process and the flux
estimation, which are issues that have been put forward as
potential shortcomings of flux estimation methods that are
based on GC-MS measurements [14]. In the flux calcula-
tions, a standard deviation of 1%
13
C-labelling was used.
RESULTS AND DISCUSSION
Central metabolic pathways
Table 1 shows the summed fractional labellings of six
samples taken from the waste stream of the bioreactor in
metabolic steady state. The fact that there are only small
variations, typically in the order of < 1%
13
C-labelling,
indicates that an isotopic steady state was reached. These
measurements were used to calculate the flux distribution in
the metabolic network (Appendix A). For each individual
sample, a flux distribution was estimated, yielding a total of
six completely independent estimates of the flux distribu-
tion. Thus, this procedure allows for a maximum of
variation of the flux estimates, as all steps from sampling
to flux estimation were carried out separately for each
individual sample, and the procedure is therefore well suited
for testing the reproducibility of the flux estimates. The key
results are summarized in Table 2, where it can be seen that
there are only small standard deviations in the estimates of
the central fluxes, such as the flux through the PP pathway,
the Embden–Meyerhof–Parnas pathway, and the tricarb-
oxylic acid cycle. With relative standard deviations of
< 3%, the standard deviations for these three central fluxes
are remarkably low, showing that the completely indepen-
dent sets of labelling measurements that were used for the
calculations give rise to very consistent estimates of the
activities of the central metabolic pathways.
The estimate of the flux through the oxidative part of the
PP pathway is particularly interesting, as this pathway
accounts for a large part of the NADPH production needed
for the anabolism. The data in Table 3 illustrate that the
applied method, which is based on GC-MS measurements
of summed fractional labellings, gives estimates that lie in a
relatively narrow interval compared with the results from
other studies. The main reason for the high reproducibility is
to be found in the fact that the set of labelling measurements
include a measurement of the glucose 6-phosphate-derived
carbohydrate compounds, e.g. glycogen, glucan and treha-
lose. The low labelling of the glucose 6-phosphate pool
shows that there is a high degree of reversibility between the
fructose 6-phosphate and the glucose 6-phosphate pool, and
with this reversibility being estimated as ÔhighÕ,itis
numerically much easier to estimate the flux through the
oxidative PP pathway. Leaving out this measurement, the
precise value of which is not very crucial, causes great
fluctuations in the estimates of the PP pathway.
In contrast with the high reproducibility of the estimates
of the net-fluxes, the extents of reversibility in the reactions
in the nonoxidative part of the PP pathway could not be
estimated with any satisfactory consistency. In spite of this
2796 B. Christensen et al. (Eur. J. Biochem. 269) Ó FEBS 2002
seemingly important shortcoming of the method, the net
fluxes, including the oxidative PP pathway flux, through the
central metabolic pathways could still be estimated very
reproducibly, Fig. 1, showing that the precise estimates of
the reversibilities of those reactions are not necessarily
essential for the estimation of the net-fluxes. To this end, it
should be added that inclusion of the exchange reactions,
the omission of which were recently pointed out by van
Winden et al. to be a possible pitfall of the flux calculations
based on
13
C-labelling experiments, had no effect on the net-
flux estimates of either the oxidative PP-pathway flux or the
fluxes of the other main pathways in the central metabolism
(Table 2) [21]. The reactions that were omitted were
exchange reactions, where exchange refers to the original
Table 1. Summed fractional labellings.
Residence times
Fragment
a
C-atoms
b
5.12 5.69 7.44 7.84 8.24 9.18
Ser175 1, 2 3.7 3.5 2.7 2.2 2.7 3.5
Ser132 2, 3 34.6 34.7 33.5 33.3 33.5 33.6
Gly175 1, 2 6.0 5.9 5.6 5.9 5.7 5.5
Gly144 1, 2 5.9 5.9 6.4 5.7 6.1 6.3
Gly85 2 3.8 3.6 3.8 3.7 3.6 3.5
Ala116 2, 3 36.0 35.9 36.1 36.3 36.3 36.1
Ala99 2, 3 36.1 35.8 36.1 36.0 36.1 35.9
Ala158 1, 3 38.0 38.7 38.2 39.5 38.8 38.1
Leu158 2, 6 106.3 105.8 105.0 106.4 107.3 106.1
Val144 2, 5 72.9 73.1 73.1 73.8 73.7 73.5
Val143 1, 2 7.3 7.1 7.3 7.0 7.0 6.7
Val127 2, 5 73.7 72.8 72.8 73.3 72.7 72.9
Val186 1, 5 74.1 74.5 75.3 73.5 76.0 75.0
Asp188 2, 4 57.0 56.9 57.1 57.5 57.3 57.1
Asp115 2 12.2 11.8 11.9 12.5 11.6 12.0
Asp216 1, 4 64.5 63.8 64.7 64.8 64.6 64.5
Ile158 2, 6 93.4 94.0 94.5 93.4 93.4 93.5
Thr175 1, 2 17.5 18.9 17.9 17.7 17.3 18.5
Thr146 2, 4 55.0 54.2 53.7 52.5 56.0 54.8
Pro142 2, 5 86.2 85.4 85.6 85.4 85.8 85.6
Lys156 2, 6 117.2 116.8 117.6 117.5 117.1 117.2
Glu143 1, 2 40.1 39.6 41.0 40.2 40.6 39.4
Glu230 1, 5 99.8 99.2 100.0 101.2 98.9 100.9
Phe192 2, 9 93.2 91.4 89.4 87.5 85.9 91.9
Phe143 1, 2 3.1 3.0 3.0 3.0 2.9 2.9
Glucose331 1, 6 92.0 92.3 91.2 92.8 91.9 91.2
a
Refers to the metabolite that was measured, where the three-letter code corresponds to standard amino acid abbreviations, and the number
corresponds to the mass of the (unlabelled) fragment.
b
ÔC-atomsÕ lists the carbon atoms of the amino acids or glucose that are present in the
fragment. For instance, the sum of the fractional labelling of C2, the fractional labelling of C3 and the fractional labelling of C4 of threonine
(Thr146) was measured to 55.0% after 5.12 residence times of labelled feed. For the flux calculations, a standard deviation of 1%
13
C-
labelling was used for each fragment. Thus, e.g. for the Thr146 fragment measured after 5.12 residence times, the mean ± SD defines an
interval of 54.0–56.0%. The time for the samples is given as residence times. With a dilution rate of D ¼ 0.1Æh
)1
, a residence time is
equivalent to 10 h.
Table 2. Flux estimates and standard deviation of central metabolic pathways in S. cerevisiae. Flux calculations were performed with a network that
includes the exchange reactions (marked with an asterisk) in Appendix A, which were mentioned by van Winden et al. [21]. The remaining flux
calculations were performed with a network without these reactions. The flux estimates derived from the extended metabolic network are not
included in the calculation of the average values and the standard deviations. ÔC4 decarboxylationÕ is a flux representing the combined contribution
of decarboxylation of malate and decarboxylation of oxaloacetate. The time for the samples is given as residence times. With a dilution rate of
D ¼ 0.1Æh
)1
, a residence time is equivalent to 10 h.
Residence times 5.12 5.69 7.44 7.84 8.24 9.18 9.18* Average SD
PP pathway 43.2 44.4 44.3 41.5 42.4 43.8 43.9 43.3 1.0
Embden–Meyerhof–Parnas pathway 34.6 33.4 33.6 36.3 35.4 34.0 33.9 34.5 1.0
Tricarboxylic acid cycle 60.1 60.9 60.3 60.2 59.9 58.7 59.2 60.0 0.7
Pyruvate carboxylation 25.4 29.3 23.3 24.3 25.7 24.7 25.9 25.5 1.9
C4 decarboxylation 4.7 8.8 2.8 3.5 4.8 4.0 4.6 4.8 1.9
Net anaplerosis 20.7 20.5 20.5 20.9 20.9 20.7 21.3 20.7 0.2
Ó FEBS 2002 Flux analysis based on C-13 data (Eur. J. Biochem. 269) 2797
meaning of exchanging C
2
-andC
3
-units in transketolase
and transaldolase reactions [17], and not in the sense that
was introduced by Wiechert et al. [5] as a means to include
reversibility of the reactions in the network. Reversibility of
all reactions in the nonoxidative PP pathway was included
in all calculations.
Flux dependent influence on the reproducibility
of the flux estimations
Similar to the reversibilities of the reactions in the nonoxi-
dative PP pathway, the transport reactions across the
mitochondrial membrane are examples of reactions that
may be difficult to estimate. Thus, the transport of acetyl-
CoA from the cytosol to the mitochondrion is estimated to
somewhere between 5.1 and 52.7, and also the estimate of
the transport of pyruvate from the cytosol to the mito-
chondria varies substantially. The reason for this is to be
found in the labelling patterns of alanine and valine, which
are assumed to be synthesized from cytosolic and mito-
chondrial pyruvate, respectively. Under the conditions of
the experiment, the labelling patterns of alanine and valine
are almost identical, and the labelling patterns of cytosolic
and mitochondrial pyruvate are consequently close to being
identical. Acetyl-CoA may be derived from both mitoch-
ondrial and cytosolic pyruvate, and as these two pools of
pyruvate do not exhibit compartmental variations, the
labelling patterns of the cytosolic and mitochondrial acetyl-
CoA pools will be labelled almost identically. When
metabolites of a certain type are located in different
compartments, but still have identical labelling patterns,
the pools of these metabolites can be lumped together.
From a modelling point of view, any flux between such
identical pools is meaningless, which is reflected by the large
variations in the flux estimates (Fig. 1). Since the difficulties
in estimating the transport fluxes are caused by the lack of
differences in labelling patterns, information on the isotop-
omer distributions would not give improved resolution of
the fluxes.
The difficulties in estimating acetyl-CoA transport fluxes
are caused by the low flux through the malic enzyme
catalysed reaction, which is a mitochondrial reaction.
Therefore, if this reaction had taken place to a greater
extent, the mitochondrial and cytosolic pools of pyruvate
would be labelled differently, and the labelling patterns of
the acetyl-CoA pools would now differ, enabling calculation
of the exchange flux between these pools. Thus, there may
be a strong coupling between the precision of the flux
estimates and the magnitudes of the fluxes in the network.
Flux estimates based on the labelling patterns
of proteinogenic amino acids
Quite interestingly, if the transport of acetyl-CoA across the
mitochondrial membrane had not been included in the
network, much more reproducible flux estimates would
have been found. Thus, an erroneous network may lead to
highly reproducible, yet incorrect, flux estimates, illustrating
that reproducibility should not be taken to be a measure of
the precision. This result is even more interesting when the
very base of the calculations, the amino acid labelling
patterns, is taken into consideration. The proteinogenic
amino acids are derived from several different central
metabolites, and their labelling patterns are taken to reflect
the labelling patterns of their respective precursors. How-
ever, it is important to realise that the labelling patterns of
proteinogenic amino acids reflect the flux distribution at the
time that the protein pool was synthesized, highlighting that
there is an implicit assumption of proportionality between
glucose uptake and protein biosynthesis. This is true for the
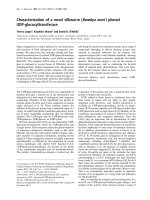
Fig. 1. Metabolic flux distribution in S. ce revisiae growinginameta-
bolic and isotopic steady state chemostat culture at dilution rate
D ¼ 0.1Æh
)1
and with glucose as the sole carbon source. Five different
samples were taken during the steady state, and based on the labelling
patterns of each of these samples, a flux distribution was estimated,
leading to five different sets of fluxes. The pair of values represents the
lowest and the highest estimates that were found in the five different
flux distributions.
Table 3. Pentose phosphate pathway flux estimates from the literature.
The pentose phosphate pathway fluxes are scaled with respect to the
glucose uptake flux, which was arbitrarily set to 100. Thus, for every
100 mol of glucose taken up by the cells, the fluxes indicate how many
moles of glucose 6-phosphate were converted through the oxidative
pentose phosphate pathway.
Estimate (lower limit–upper limit)
Marx et al. [15] 67 (53–78)
Marx et al. [16] 76.3 (56.8–95.9)
Schmidt et al. [17] 72.0 (66.3–74.9)
Sauer et al. [18] 72.0 (64.8–79.2)
Dauner et al. [19] 20 (11–29)
Dauner et al. [19] 34 (16–52)
This study 43.3 (41.5–44.4)
2798 B. Christensen et al. (Eur. J. Biochem. 269) Ó FEBS 2002
average culture in metabolic steady state, but as the labelling
patterns are generated on a microscopic scale in individual
cells that undergo, for instance, cell cycle-dependent meta-
bolic phenomena, the average behaviour of the cells may
differ materially from the behaviour of the individual cells,
and the metabolism of the cells producing the most protein
– and not necessarily metabolizing the most substrate ) will
therefore have a dominating impact on fluxes calculated for
the entire culture. Thus, when protein labelling patterns are
used for flux estimations, it is assumed that glucose
consumption is directly coupled to protein biosynthesis,
which is an assumption that is unlikely to be true for all
microbial systems.
CONCLUSIONS
Using a simple approach based on summed fractional
labelling data, we have obtained highly reproducible
estimates of the central fluxes in S. cerevisiae. The technique
is therefore likely to be sensitive to small metabolic
variations caused by changes in growth conditions or
genetic make-up of the microorganism.
It was not possible to find reproducible estimates of the
reversible fluxes in the PP pathway, but quite interestingly,
this had no influence on the estimate of the oxidative PP
pathway flux. Summed fractional labelling data, which are
readily available from GC-MS measurements, therefore
render the effects of reversibilities in the PP pathway
unimportant for the estimation of the flux through the
oxidative PP pathway.
As was the case for the reversible fluxes of the PP
pathway, the estimates of the transport flux of acetyl-CoA
between the cytosolic and mitochondrial compartments
could not be estimated with any satisfactory consistency.
This shortcoming was due to low malic enzyme activity,
demonstrating that the magnitude of certain fluxes in the
network may seriously affect the precision with which other
fluxes can be estimated. This result also implies that the
validity of simulations showing that a given set of
measurements holds sufficient information for estimating
the fluxes in a network is difficult to assess.
With the above discussion we have also tried to illustrate
that a metabolic network is a mathematical abstraction
whose properties, i.e. network structure and flux distribu-
tion, may not necessarily be a good description of the actual
physiological state, no matter how precisely the fluxes are
estimated. For instance, it is important to realise that when
the labelling patterns of the proteinogenic amino acids are
used as the basis for the calculations, the estimated fluxes
represent the metabolic fluxes during protein biosynthesis,
and not necessarily during the production of a metabolite of
interest in a given situation. Thus, the flux values estimated
for the various reactions may be affected by a number of
physiological phenomena that are not accounted for in the
model.
These observations lead to the conclusion that at a certain
stage, any greater precision that may be gained in the flux
estimates by using complex isotopomer modelling lose
meaning with respect to physiological interpretations,
leaving the impression that the value of the isotopomer
balancing approach lies in identifying unknown structural
features of metabolic networks, and not in more precise
estimates of the flux distribution. Thus, the strength of the
detailed isotopomer modelling is that the superior informa-
tion content of the measurements can be used for detecting
inconsistencies between the measurements and the model
structure, and thereby isotopomer modelling can function
as an excellent tool for discriminating between different
metabolic networks.
REFERENCES
1. van Gulik, W.M. & Heijnen, J.J. (1995) A metabolic network
stoichiometry analysis of microbial growth and product forma-
tion. Biotechnol. Bioeng. 48, 681–698.
2. Sauer, U., Lasko, D.R., Fiaux, J., Hochuli, M., Glaser, R.,
Szyperski, T., Wu
¨
thrich, K. & Bailey, J.E. (1999) Metabolic flux
ratio analysis of genetic and environmental modulations of
Escherichia coli central carbon metabolism. J. Bacteriol. 181,
6679–6688.
3. Marx, A., de Graf, A.A., Wiechert, W., Eggeling, L. & Sahm, H.
(1996) Determination of the fluxes in the central metabolism of
Corynebacterium glutamicum by nuclear magnetic resonance
spectroscopy combined with metabolite balancing. Biotechnol.
Bioeng. 49, 111–129.
4. Christensen, B. & Nielsen, J. (2000) Metabolic network analysis of
Penicillium chrysogenum using
13
C-labeled glucose. Biotechnol.
Bioeng. 68, 652–659.
5. Wiechert, W. & de Graaf, A.A. (1997) In vivo stationary flux
analysis by
13
C labeling experiments. Adv. Biochem. Eng. Bio-
technol. 54, 109–154.
6. Schmidt, K., Carlsen, M., Nielsen, J. & Villadsen, J. (1997)
Modeling isotopomer distributions in metabolic networks using
isotopomer mapping matrices. Biotechnol. Bioeng. 55, 831–840.
7. Follstad, B.D. & Stephanopoulos, G. (1998) Effect of reversible
reactions on isotope label redistribution. Analysis of the pentose
phosphate pathway. Eur. J. Biochem. 252, 360–371.
8. Wiechert, W., Mo
¨
llney, M., Petersen, S. & de Graaf, A.A. (2001)
A universal framework for
13
C metabolic flux analysis. Metabol.
Eng. 3, 265–283.
9. Sonntag, K., Eggeling, L., de Graaf, A.A. & Sahm, H. (1993) Flux
partitioning in the split pathway of lysine synthesis in Cor-
ynebacterium glutamicum. FEBS 213, 1325–1331.
10. Christiansen, T., Christensen, B. & Nielsen, J. (2002) Metabolic
network analysis of Bacillus clausii on minimal and semi-rich
medium using
13
C-labeled glucose. Metabol. Eng.,inpress
11. Jensen, N.B.S., Christensen, B., Nielsen, J. & Villadsen, J. (2002)
The simultaneous biosynthesis and uptake of amino acids by
Lactococcus lactis studied by
13
C labelling experiments. Bio-
technol. Bioeng. 78, 11–16.
12. Gombert, A.K., dos Santos, M.M., Christensen, B. & Nielsen, J.
(2001) Network identification and flux quantification in the central
metabolism of Saccharomyces cerevisiae under different conditions
of glucose repression. J. Bacteriol. 183, 1441–1451.
13. Christensen, B. & Nielsen, J. (1999) Isotopomer analysis using
GC-MS. Metabol. Eng. 1, 282–290.
14. Mo
¨
llney, M., Wiechert, W., Kownatzki, D. & de Graaf, A.A.
(1999) Bidirectional reaction steps in metabolic networks. IV.
Optimal design of isotopomer labeling experiments. Biotechnol.
Bioeng. 66, 86–103.
15. Marx, A., Eikmans, B.J., Sahm, H., de Graaf, A.A. & Eggeling, L.
(1999) Response of the central metabolism in Corynebacterium
glutamicum to the use of an NADH-dependent glutamate dehy-
drogenase. Metabol. Eng. 1, 35–48.
16. Marx, A., Striegel, K., de Graaf, A.A., Sahm, H. & Eggeling, L.
(1997) Response of the central metabolism of Corynebacterium
glutamicum to different flux burdens. Biotechnol. Bioeng. 56,
168–180.
17. Schmidt, K., Nørregaard, L.C., Pedersen, B., Meissner, A., Duus,
J.Ø., Nielsen, J. & Villadsen, J. (1999) Quantification of
Ó FEBS 2002 Flux analysis based on C-13 data (Eur. J. Biochem. 269) 2799
intracellular metabolic fluxes from fractional enrichment and
13
C-
13
C coupling constraints on the isotopomer distribution in
labeled biomass components. Metabol. Eng. 1, 166–179.
18. Sauer, U., Hatzimanikatis, V., Bailey, J.E., Hochuli, M., Szyper-
ski, T. & Wu
¨
thrich, K. (1997) Metabolic fluxes in riboflavin-pro-
ducing Bacillus subtilis. Nat. Biotechnol. 15, 448–452.
19. Dauner, M., Bailey, J.E. & Sauer, U. (2001) Metabolic flux ana-
lysis with a comprehensive isotopomer model in Bacillus subtilis.
Biotechnol. Bioeng. 76, 144–156.
20. Flanigan, I., Collins, J.G., Arora, K.K., MacLeod, J.K. & Wil-
liams, J.P. (1993) Exchange reactions catalyzed by group-tran-
ferring enzymes oppose the quantitation and the unravelling of the
identity of the pentose phosphate pathway. J. Biochem. 213,
477–485.
21. van Winden, W., Verheijen, P. & Heijnen, S. (2001) Possible pit-
falls of flux calculations based on
13
C-labeling. Metabol. Eng. 3,
151–162.
APPENDIX A
Glucose uptake
Glucose fi glucose 6-P
EMP-pathway
Glucose 6-P fi fructose 6-P (reversible)
Fructose 6-P fi 2 glyceraldehyde 3-P
Glyceraldehyde 3-P fi phosphoenolpyruvate
Phosphoenolpyruvate fi pyruvate (cytosolic)
PP-pathway
Glucose 6-P fi pentose 5-P +CO
2
2Pentose5-Pfi sedoheptulose 7-P + glyceraldehyde 3-P
(reversible)
Sedoheptulose 7-P + glyceraldehyde 3-P fi fructose 6-P +
erythrose 4-P (reversible)
Pentose 5-P + Erythrose 4-P fi fructose 6-P + glyceral-
dehyde 3-P (reversible)
*Pentose 5-P + glyceraldehyde 3-P fi pentose 5-P + gly-
ceraldehyde 3-P
*Fructose 6-P + erythrose 4-P fi fructose 6-P + eryth-
rose 4-P
*Sedoheptulose 7-P + pentose 5-P fi sedoheptulose 7-
P + Pentose 5-P
*Fructose 6-P + glyceraldehyde 3-P fi fructose 6-P +
glyceraldehyde 3-P
*Sedoheptulose 7-P + erythrose 4-P fi sedoheptulose
7-P + erythrose 4-P
Ethanol, acetate and glycerol formation
Pyruvate (cytosolic) fi ethanol CO
2
Acetaladehyde fi acetate
Glyceraldehyde 3-P fi glycerol
Formation of Acetyl-CoA in the cytosol
Acetate fi acetyl-CoA (cytosolic)
Anaplerotic reaction (cytosolic)
Pyruvate (cytosolic) + CO
2
fi oxaloacetate (cytosolic)
TCA-cycle (considering scrambling around fumarate)
Pyruvate (mitochondrial) fi acetyl-CoA (mitochon-
drial) + CO
2
Oxaloacetate (mitochondrial) + acetyl-CoA (mitochon-
drial) fi isocitrate
Isocitrate fi 2-oxoglutarate + CO
2
2-Oxoglutarate fi fumarate + CO
2
Oxaloacetate (mitochondrial) fi fumarate (reversible,
scrambling included)
Transports
Oxaloacetate (mitochondrial) fi oxaloacetate (cytosolic)
(reversible)
Acetyl-CoA (cytosolic) fi acetyl-CoA (mitochondrial)
Pyruvate (cytosolic) fi pyruvate (mitochondrial)
Threonine/serine/glycine metabolism (all enzymes
assumed to be cytoplasmic)
Glyceraldehyde 3-P fi serine
Serine fi glycine+C
1
-tetrahydrofolate (reversible)
Oxaloacetate (cytosolic) fi threonine
Threonine fi glycine + acetaldehyde (reversible)
Malic enzyme (oxaloacetate decarboxylation,
mitochondrial)
Oxaloacetate (mitochondrial) fi pyruvate (mitochond-
rial) + CO
2
Drain of intermediates to macromolecules
In the model, the following intracellular metabolites are
used for biosynthesis of macromolecules: glucose 6-P,
pentose 5-P, erythrose 4-P, glyceraldehyde 3-P, phosphoe-
nolpyruvate, pyruvate (mitochondrial), pyruvate (cytosolic),
oxaloacetate (cytosolic), 2-oxoglutarate, acetyl-CoA (cyto-
solic), acetyl-CoA (mitochondrial), serine, glycine,
C
1
-tetrahydrofolate and threonine.
Excreted products
The model includes fluxes representing the production of the
following metabolite: ethanol, acetate, glycerol and CO
2
.
Note
Thereactionsaremarkedwithanasteriskareso-called
exchange reactions, and these reactions were omitted in
some of the flux estimations, see text. The reactions followed
by ÔreversibleÕ are reversible reactions, and both the forward
and the reverse direction of the reaction were included in the
calculations.
2800 B. Christensen et al. (Eur. J. Biochem. 269) Ó FEBS 2002