Báo cáo Y học: Characterization of heparin binding by a peptide from amyloid P component using capillary electrophoresis, surface plasmon resonance and isothermal titration calorimetry ppt
Bạn đang xem bản rút gọn của tài liệu. Xem và tải ngay bản đầy đủ của tài liệu tại đây (303.93 KB, 8 trang )
Characterization of heparin binding by a peptide from amyloid P
component using capillary electrophoresis, surface plasmon resonance
and isothermal titration calorimetry
Maria J. Hernaiz
1
, Laurie A. LeBrun
1
,YiWu
1
, Jette W. Sen
2
, Robert J. Linhardt
1
and Niels H. H. Heegaard
2
1
Division of Medicinal and Natural Products Chemistry, Department of Chemistry and Department of Chemical Engineering,
University of Iowa, USA;
2
Department of Autoimmunology, Statens Serum Institut, Copenhagen, Denmark
Synthetic peptides based on amino-acid residues 27–38 of
human serum amyloid P component represent a novel type
of heparin binders as they do not contain clusters of basic
amino acids or other known features associated with protein
or peptide heparin binding. Here, we characterize the bind-
ing using capillary electrophoresis (CE), surface plasmon
resonance (SPR), and isothermal titration calorimetry
(ITC). By CE, heparin-binding activity was readily apparent
for both a regular peptide and a slightly N-terminally
modified form, while a sequence-scrambled peptide had no
measurable binding. Dissociation constants in the 1–15 l
M
range were estimated, but only a minor part of the binding
isotherm was covered by the experiments. SPR measure-
ments using immobilized peptides verified heparin binding,
the range of the binding constants, and the reduced binding
of the sequence-scrambled peptide. Structurally defined
heparin oligosaccharides were used to establish that while
the tetrasaccharide is too small to exhibit strong binding,
little difference in binding strength is observed between
hexa- and tetradeca-saccharides. These experiments also
confirmed the almost complete lack of activity of the
sequence-scrambled peptide. The amino-acid sequence-
dependent binding and the importance of a disulfide bond in
the peptide were verified by ITC, but the experimental con-
ditions had to be modified because of peptide precipitation
and ITC yielded significantly weaker binding constants than
the other methods. While the precise function of the peptide
in the intact protein remains unclear, the results confirm the
specificity of the glycosaminoglycan interaction with regard
to peptide sequence by applying two additional biophysical
techniques and showing that the N-terminal part of the
peptide may be modified without changing the heparin
binding capabilities.
Keywords: amyloid P component; heparin binding; surface
plasmon resonance; capillary electrophoresis; isothermal
titration calorimetry.
Amyloid P component (AP) is a heparin-binding serum
protein, which is also found outside the circulation in
basement membranes, connective tissue, and in all types of
amyloid deposits [1–5]. Because of its largely unknown
physiological function [6], its affinity for amyloid, and
possible involvement in the pathogenesis of systemic lupus
erythematosus [7], the structure and activity of AP are
intensely studied [8–12]. In a search for functional peptides
in the AP structure with homology to known cell attach-
ment peptides, a control peptide representing residues 27–38
of AP (AP-1) was surprisingly found to support cell
attachment [13]. The peptide was subsequently found to
bind heparin and other anionic carbohydrates including
DNA, with apparent dissociation constants in the 0.5–
10 l
M
range based on capillary electrophoresis (CE) and
solid-phase inhibition assays [14–16]. We found that the
tryptic glycopeptide corresponding to amino acids 14–38 of
AP glycopeptide binds heparin [16] and that the attached
carbohydrate protects against proteolytic breakdown [17].
A dissociation constant of 1.5 l
M
was estimated for the
interaction with low molecular mass heparin [18]. The
amino-acid sequence of this heparin-binding peptide does
not fit any of the classical known heparin binding consensus
sequences which consist of clustered basic residues [19–21]
nor does it seem to conform to the turn sequences seen in the
fibroblast growth factor family [22]. Thus, it may represent a
new type of heparin binding sequence. The current study
was undertaken to confirm and extend the results of the
original study that was solely based on CE performed at
pH 2.5 [14] and to get data on the interaction kinetics and
thermodynamics using independent micromethods. Surface
plasmon resonance measurements [23] and isothermal
titration calorimetry represent alternative methods for
performing binding studies involving mixtures of low
molecular mass reactants and low amounts of samples
[24]. These methods are therefore used in the present study
together with CE to measure the strength of the AP-1
Correspondence to N. Heegaard, Department of Autoimmunology,
Statens Serum Institut, Artillerivej 5, Copenhagen S,
DK-2300, Denmark.
Fax: + 45 32683876, Tel.: + 45 32683378,
E-mail:
Abbreviations: AP or SAP, serum amyloid P component; AP-1,
S-pyridylated synthetic peptide (H-EKPLQNFTLCFR-NH
2
); CE,
capillary electrophoresis; EDC, 1-(3-dimethylaminopropyl)-3-
ethylcarbodiimide hydrochloride; GAG, glycosaminoglycan; ITC,
isothermal titration calorimetry; M, marker peptide (Ac-PSKD-OH);
mAP-1, modified AP-1; RU, resonance units; scrambled AP-1/
scrAP-1, S-pyridylated synthetic peptide (H-TRLFPKECLNQF-
NH
2
); SPR, surface plasmon resonance.
(Received 31 January 2002, revised 15 April 2002,
accepted 22 April 2002)
Eur. J. Biochem. 269, 2860–2867 (2002) Ó FEBS 2002 doi:10.1046/j.1432-1033.2002.02964.x
peptide interaction with heparin, to evaluate the amino-acid
sequence specificity of the binding, and to assess if a minimal
heparin structure necessary for binding can be defined.
MATERIALS AND METHODS
Chemicals and materials
AP-(27–38)-peptide (H-EKPLQNFTLCFR-NH
2
)(AP-1),
scrambled AP-(27–38)-peptide (H-TRLFPKECLNQF-
NH
2
) (scrAP-1), and the marker peptide (Ac-PSKD-OH)
(M) were obtained from Schafer-N (Copenhagen, Den-
mark). Streptavidin sensor chip, CM 5 chip, NaCl/Hepes
buffer, and EDC/NHS were from Biacore (Uppsala,
Sweden). Low molecular weight heparin (LMW heparin,
molecular mass 5000 Da), sodium salt from porcine intes-
tinal mucosa was from Calbiochem (La Jolla, CA, USA).
Gycosaminoglycan heparin and semipurified heparin (hep-
arin peptidoglycan) were both sodium salts of porcine
intestine in origin with 150 UÆmg
)1
, an average molecular
mass 12 000 Da and were obtained from Celsus Labor-
atories (Cincinnati, OH, USA). Oligosaccharides, DUAp2S
(1[fi4)-a-
D
-GlcNpS6S(1fi4)-a-
L
-IdoAp2S(1]
n
fi4)-
a-
D
-GlcNpS6S (where n ¼ 1,2…,6, corresponding to tetra-
saccharide, hexasaccharide, octasaccharide, decasaccharide,
dodecasaccharide and tetradecasaccharide, and DUA is
4-deoxy-a-
L
-threo-hexenopyranosyluronic acid), were pre-
pared from bovine lung heparin by controlled enzymatic
depolymerization with heparin lyase I and purified to
homogeneity as previously described [25].
Protection of peptides and characterization by MS
AP-1 peptides were S-pyridylated to protect their Cys-
residue; 1 m
M
peptide in 10 mL 0.1% (v/v) aqueous
trifluoroacetic acid (Fluka, Buchs, Switzerland) was incu-
bated with 2 m
M
4,4¢-dithiodipyridine (Aldrich, Steinheim,
Germany) by stirring at 37 °C for 1 h. The reaction product
was purified by reversed phase HPLC on a preparative C18
column (22 · 250 mm, 10 lm particle size) from Vydac
(Hesperia, CA, USA). A flow rate of 10 mLÆmin
)1
and a
20-min gradient of 20–45% acetonitrile in 0.1% trifluoro-
acetic acid were used and the reaction product was
identified through its distinct 280 nm absorbance that the
unmodified peptides lack. An S-carboxyamidomethylated
AP-1 peptide was prepared in the same way by reacting
1.3 m
M
peptide in dilute NaCl/P
i
with 24 m
M
iodoaceta-
mide for 1 h at room temperature. The collected material
was lyophilized and the peptide masses were subsequently
verified by mass spectrometry on a Mariner ESI-TOF mass
spectrometer equipped with a standard ion source (PerSep-
tive Biosystems, Framingham, MA, USA). For N-terminal
sequencing, the peptides were dissolved in 30% acetonitrile,
0.2% formic acid and fragmented by collision induced
dissociation (CID). The settings were: Skimmer 1 potential
50 V, quadropole DC potential 10 V, and nozzle potential
400 V.
CE and CE-based binding assays
CE was performed on a Beckman P/ACE 2050 instrument.
Electrophoresis buffer was 0.1
M
sodium phosphate,
pH 7.46. Detection was by UV-absorbance at 200 nm and
the separation path was a 50-lm inner diameter uncoated
fused silica capillary with 50 cm to the detector window and
of 57 cm total length. Separations were carried out at 17 or
18 kV corresponding to a current of approximately 85 lA
at a capillary temperature thermostatting of 20 °C. The
capillary was rinsed after electrophoresis for 1 min with
each of the following: 0.1
M
NaOH,water,andelectro-
phoresis buffer. Samples were pressure injected for 8 s after
a 2-s preinjection of water and were subjected to electro-
phoresis from a separate set of buffer vials than those used
for prerinse. The AP-1 peptide preparation used for the CE
experiments was found to contain a mixture of regular AP-1
and modified (dehydrated, see below) AP-1 (mAP-1) while
scrAP-1 was homogeneous. When indicated, the unmodi-
fied AP-1 was purified to homogeneity by RP-HPLC using
a C18 column and a 0–70% gradient of acetonitrile in 0.1%
trifluoroacetic acid for 20 min at 1 mLÆmin
)1
. The collected
material from 150 lLof0.5mgÆmL
)1
peptide was dried
down in a centrifugal vacuum evaporator and resolubilized
in 50 lL of water. Peptide concentration was estimated by
CE based on a standard curve of peak areas vs. peptide
concentration using the starting AP-1 preparation with a
known total peptide concentration and known distribution
between mAP-1 and AP-1 (1 : 0.9 based on peak areas).
Correlation coefficients (r
2
) of standard curves were > 0.98.
Binding assays were performed by analysis of preincubated
mixtures of various concentrations of the peptides (inclu-
ding a marker peptide) with a constant concentration of
LMW heparin. Preliminary experiments were carried out
with mixtures of the scrambled and the unpurified AP-1
preparation in 10 m
M
sodium phosphate, pH 7.46 with or
without added LMW heparin. Subsequent binding experi-
ments were carried out by diluting a stock peptide solution
at various concentrations in the 10 m
M
phosphate or in
water and then split it into two 8-lL samples. To one sample
2 lL water was added, and to the other 2 lL LMW heparin
(0.01 mgÆmL
)1
in water) corresponding to a final heparin
concentration of 0.4 l
M
and total peptide concentrations
covering the range of 10–30 l
M
. Samples were incubated
overnight at 4 °C and then analyzed by CE. Peptide peak
areas in the incubations with heparin (representing free,
unbound peptide) were converted to concentrations using
the peptide standard curve and subtracted from the total
concentration of peptide present in each incubation to get
the amount of bound peptide. The internal marker (non-
reacting peptide) was used to ensure that each set of
incubations were similarly diluted and in case the marker
deviated from its calculated peak area value, the total
peptide concentration was adjusted accordingly.
Surface plasmon resonance (SPR) measurements
The SPR measurements were performed on a BIAcore 2000
instrument operated using BIA evaluation v3.2 software.
Buffers were filtered and deoxygenated and all experiments
were carried out at 25 °C.
Immobilization of regular and scrambled AP peptides
on carboxymethylated chips
Regular and scrambled AP-1 peptides were coupled to
carboxymethylated chips (CM5 chips) as follows: the CM5
chip was activated using an injection pulse of an equimolar
Ó FEBS 2002 Characterization of a novel heparin-binding peptide (Eur. J. Biochem. 269) 2861
mix of NHS and N-ethyl-N-(dimethylaminopropyl)carbo-
diimide (EDC) (35 lL, 5 lLÆmin
)1
, final concentration
0.05
M
, mixed immediately prior to injection). The surface
wasthencleanedwiththeextracleanstepavailableinthe
instrument. The 80-lL peptide solution was then injected
manually (100 lgÆmL
)1
into 3 m
M
citrate). Four different
pH values (4.5, 5, 5.5, and 6) were examined. A pH of 4.5
resulted in the immobilization of the greatest amount of
regular and scrambled AP-1 peptides. Excess unreacted sites
on the sensor surface were blocked with a 35-lL injection of
1
M
ethanolamine and the surface was again cleaned with
the extraclean program. Glycosaminoglycan heparin sam-
ples for binding studies were prepared in 10 m
M
sodium
phosphate buffer, pH 7.40. Samples (15 lL) were injected
into each cell at a flow rate of 5 lLÆmin
)1
(over a
concentration range of 10–300 l
M
). At the end of each
sample injection, the same buffer was continuously flowed
over the sensor surface to monitor dissociation. At the end
of each run, the sensor surface was regenerated by injecting
a10-lL pulse of 2
M
NaCl, followed by reinstituting flow
with sodium phosphate buffer and the next test compound
while recording sensorgrams. Kinetic parameters were
evaluated using the
BIAEVALUATION
software (ver. 3.0.2,
1999). Signals from control cells were subtracted from the
signal generated by the flow cell containing immobilized
AP-1 peptides.
Isothermal titration calorimetry (ITC)
ITC was performed on a model 4209 microtitration
calorimeter (Hart Scientific, Pleasant Grove, UT, USA).
The interaction between regular and scrambled AP-1 with
glycosaminoglycan heparin was measured. Heparin
(1.3 mL of 50 l
M
) was titrated with 25 10-lL injections
of peptide (1.5 m
M
). The samples were in 10 m
M
sodium
phosphate buffer at pH 6. The experiments were per-
formed at 25 °C using an external water bath. Peak
areas were analyzed using the
BINDWORKS
(version 1)
program from Applied Thermodynamics. The experi-
mental procedures and data fitting have been previously
described [24].
RESULTS
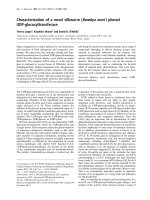
Heparin binding of AP-1 peptides characterized by CE
By using CE, it was possible to separate the sequence-
scrambled version of AP-1 from the regular version at a pH
of 7.46 (Fig. 1). In addition, with this particular preparation
of regular AP-1, we observed a modified form of AP-1
(mAP-1), represented by the first peak in the electrophero-
gram. Mass spectrometry showed that the preparation
contained approximately equal amounts of two compo-
nents with monoisotopic masses of 1603.13 and 1585.34.
The mass of 1603.13 is in agreement with the theoretical
monoisotopic mass of 1602.78 for AP-1. By amino-acid
sequencing using MS, we found that the mass deficit of
approximately 18 in the modified peptide corresponds to the
first two residues (results not shown). This is compatible
with N-terminal Glu and Lys side chains cyclizing and
losing water in the process. The MS-observed fragmen-
tation pattern of the two N-terminal amino-acid residues of
mAP-1 supported this notion (data not shown).
Heparin reactivity was subsequently assessed by adding
heparin (200 l
M
) to the electrophoresis buffer (Fig. 1B).
Both the regular AP-1 peptide and the N-terminally
modified form (both at 75 l
M
in the sample) disappeared
from the peak profile, i.e. they both bind heparin while the
scrambled AP-1 peptide (156 l
M
in the sample) was not
affected. The binding peptides complex with the highly
negatively charged heparin and therefore migrate much
slower than nonbound peptides. A defined complex peak
was not seen. This indicates that the peptide–heparin
complexes dissociate during the time of the experiment.
However, the interaction is not so weak that a dynamic
equilibirum exists during the analysis allowing all molecules
to spend the same fraction of time in complexes (which
would give regular shifts in peak positions; see reviews on
the theory of affinity electrophoresis [26]). An additional
reason for not obtaining one defined complex peak may be
that the population of binding sites on heparin is hetero-
geneous.
A direct binding assay was then carried out using
preincubated samples and CE to simultaneously separate
the three peptides and quantify the amount of free peptide
at different concentrations. This is a different set-up than the
one shown in Fig. 1 because samples are pre-equilibrated.
The analyses showed peaks representing the fraction of
Fig. 1. Heparin binding specificity of synthetic AP-1 peptides in capil-
lary electrophoresis (CE). A 1 : 1 mixture of AP-1 peptide and the
scrambled AP-1 peptide (both 0.5 mgÆmL
)1
in water, final concen-
trations 156 l
M
) were analyzed by CE in the absence (A) or presence
(B) of 1 mgÆmL
)1
(200 l
M
) LMW heparin in the electrophoresis buf-
fer. The AP-1 peptide preparation contained both the expected peptide
and a variant (mAP-1) which was found by MS to be modified with
respect to the two N-terminal amino-acid residues. The peak labeled as
M corresponds to the marker peptide.
2862 M. J. Hernaiz et al. (Eur. J. Biochem. 269) Ó FEBS 2002
heparin-binding AP-1 peptides that are not bound depend-
ing on the total peptide concentration in the equilibrium
mixture. The data in Fig. 2 are the peptide peak areas in the
sample mixture at different peptide concentrations incuba-
ted with a constant amount of LMW heparin or water
(controls). Thus, the differences in the positions of the fitted
straight lines are indicative of the amount of bound peptide.
It is clear that binding of heparin by the scrambled peptide is
very low while there is a robust binding by the two other
peptides as also suggested by the preliminary assay (Fig. 1).
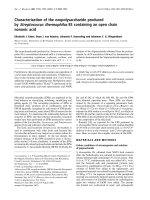
However, the variability of the measurements leading to
relative standard deviations in excess of 25% in repeated
experiments makes reliable binding constant estimates
difficult (Fig. 3). By performing the experiments with
purified AP-1 and by incubating the samples in the absence
of salt (water instead of phosphate buffer), we obtained less
scattered data, as illustrated by the data points (asterisks) in
Fig. 3 that were obtained using 0.4 l
M
heparin. When
fitting one-site binding hyperbolas, K
d
values around 1 l
M
were obtained for the less precise data obtained with the
peptide mixture in dilute phosphate. With the 0.4 l
M
heparin data obtained in water and using purified AP-1, a
better curve fit (r
2
> 0.98) was obtained that gave a K
d
value of 16 l
M
, which is in good agreement with data
previously obtained using pH 2.5 citrate as the electrophor-
esis buffer [14]. While we can conclude that the mAP-1 does
not appear to bind heparin differently from AP-1 and that
no binding can be detected with the scrambled AP-1 peptide
(despite the fact that this peptide has the same amino-acid
composition as AP-1), the data cover only a limited part of
the binding curve because of peptide solubility problems
and because of the limits of detection offered by UV-based
detection in CE. The data therefore required support from
independent micromethods for binding assays such as SPR
and ITC.
SPR measurements of peptide–heparin interaction
A strong nonspecific binding between streptavidin surface
(control cell) and AP-peptides precluded useful SPR results
from experiments where AP-1 peptides were flowed over a
biotinylated heparin surface. The R
max,
observed in the
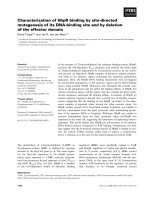
Fig. 2. CE-based quantitative binding assays of preincubated heparin-
peptide samples demonstrate that AP-1 and mAP-1 peptides bind heparin
while the scrambled AP-1 does not. Shown are peak area values for each
of the free (unbound) peptides in the mixture after incubation with
water (circles) or with LMW heparin (filled circles) as a function of the
total peptide concentration. A stock solution consisting of 125 l
M
scrambled peptide and 62 l
M
of each of the AP-1 and the mAP-1
peptides and 41 l
M
of the marker peptide in 10 m
M
phosphate,
pH 7.46 was further diluted in 2 · 20-lL aliquots and to one aliquot
was added 4 lL LMW heparin (final concentration: 3.2 l
M
) while the
other received the same volume of water. After incubating overnight at
4 °C the samples were analyzed by CE at 17 kV.
Fig. 3. CE-derived binding curves and binding constant estimates.
Shown are bound peptide as a function of free peptide for sets of
experiments performed at different constant LMW heparin concen-
trations (circles, 1.6 l
M
heparin; diamonds, 0.8 l
M
heparin; and
asterisks, 0.4 l
M
heparin). Also, the experiment at 0.4 l
M
heparin was
performed with purified AP-1 alone and took place in the absence of
phosphate buffer while the 1.6 and 0.8 l
M
data are from experiments
performed with a mixture of the three peptides in the presence of
10 m
M
phosphate, pH 7.46.
Ó FEBS 2002 Characterization of a novel heparin-binding peptide (Eur. J. Biochem. 269) 2863
sensorgram of the control cell without heparin was higher
than in the rest of the flow cells in these experiments,
indicating a peptide–streptavidin interaction (data not
shown). Instead of immobilizing the heparin ligand, we
therefore immobilized the peptides through amine coupling.
The peptide preparations used for these experiments were
homogeneous as verified by mass spectrometry (data not
shown). The successful immobilization of AP peptides was
confirmed by the observation of a 2500 resonance unit
(RU) increase in the chip for regular peptide and 3200 RU
for the scrambled.
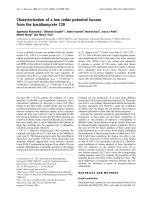
Sensorgrams for the binding of heparin to immobilized
regular and scrambled AP-1 peptides are shown in Fig. 4.
The initial part of these curves represents a buffer flowing
past the sensor surface. The second and rising part of the
curves correspond to the response of the sensor surface
observed as a sample injection volume flows past the
immobilized peptides. The final portion of the curves
correspond to the dissociation of bound heparin after the
sample volume has passed the sensor chip and empty buffer
flows past the sensor surface again. The observed rate
constant, k
obs
,wasevaluatedfromeachtraceandusedto
calculate the association rate constant (k
on
). A plot of k
s
as a
function of ligand concentration yields a slope of the
association rate constant, k
on
. The ratio k
off
/k
on
generates
the overall dissociation constant (K
d
).
Kinetic analysis of the interaction between regular AP-1
peptide and heparin, afforded a k
off
/k
on
¼ 1.4 · 10
)3
s
)1
/
9 · 10
2
M
)1
Æs
)1
, corresponding to a K
d
of 1.6 l
M
. Identical
calculations for scrambled AP-1 peptide and heparin yielded
a k
off
/k
on
¼ 1.9 · 10
)2
s
)1
/5 · 10
2
M
)1
Æs
)1
, corresponding
to a K
d
of 38 l
M
. The binding of regular peptide is over
20-fold stronger than scrambled peptide. Thus, the data
agree with the CE analyses with respect to the difference
in binding between the regular and scrambled AP-1 and
shows that even in the event of blocking of amino groups on
the peptide (through the immobilization) the binding is
strong.
SPR measurements of peptide interaction with sized
oligosaccharides
The approach used for measuring the binding of heparin was
also used in an attempt to define a minimal binding structure
of heparin using sized oligosaccharides. Homogeneous,
structurally defined heparin oligosaccharides of the general
formula DUAp2S (1[fi4)-a-
D
-GlcNpS6S(1fi4)-a-
L
-
IdoAp2S(1fi]
n
4)-a-
D
-GlcNpS6S, where n ¼ 1, tetrasaccha-
ride (X2); n ¼ 2, hexasaccharide (X3); n ¼ 3, octasaccharide
(X4); n ¼ 4, decasaccharide (X5); n ¼ 5, dodecasaccharide
(X6); n ¼ 6, tetradecasaccharide (X7) were used.
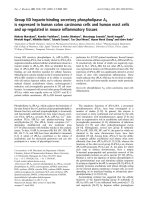
Sensorgrams for the binding of immobilized regular AP-1
peptide to heparin oligosaccharides are shown in Fig. 5. The
ratio k
off
/k
on
was again used to calculate the dissociation
constant (K
d
) from each trace (Table 1). With the scrambled
peptide on the surface the oligosaccharides gave a much
weaker signal and no K
d
could be calculated from the weak
binding that was observed (Fig. 5B).
With the exception of the tetrasaccharide, which showed
relatively weak binding, little molecular mass dependence
was observed for the interactions with the regular AP-1
peptide. However, all of the heparin oligosaccharides bound
slightly weaker to the regular AP-1 peptide than in the SPR
experiments with full size heparin (Fig. 4). The main
difference in the binding of AP-1 to oligosaccharides vs.
intact heparin appears to be a 5–10 times slower off-rate for
intact heparin. This may be the result of multivalent
interactions between a single heparin chain and multiple
AP-1 peptides on the surface of the biosensor chip that are
not possible in the case of the smaller heparin oligosaccha-
rides. This multipoint attachment will slow the off rate as
observed. The peptide sequence specificity of the binding is
clearly illustrated by the absence of a measurable interaction
with the scrambled peptide. For the regular AP-1 peptide,
the data agree with the results of the CE measurements by
yielding 2–10 l
M
K
d
values.
ITC measurements
ITC directly measures the heat released (or absorbed) from
ligand binding to a macromolecule. The titration curves
obtained showed considerable noise, possibly due to
precipitation of the peptide-carbohydrate complex at the
high concentrations required for these measurements (data
not shown). Despite these problems, K
d
values of 2 · 10
)3
and 1 · 10
)2
M
were calculated for regular AP-1 and
scrambled AP-1, respectively. These values again demon-
strate the sequence specificity of the interaction even
Fig. 4. SPR sensorgrams of AP-1 peptide–heparin interaction. (A)
interaction with regular AP-1 peptide. The concentrations of heparin
are: (r)50l
M
(j)100 l
M
(m) 200 l
M
, and (––) 300 l
M
. (B) The
interaction with scrambled AP-1 peptide. The concentrations of hep-
arin are: (- - -) 200 l
M
(–– ) – ––) 250 l
M
, and (–––) 300 l
M
.
2864 M. J. Hernaiz et al. (Eur. J. Biochem. 269) Ó FEBS 2002
though the values of the dissociation constants were higher,
i.e. indicative of a weaker binding than those measured
using CE and SPR experiments. The S-carboxyamidometh-
ylated AP-1 was found to be without measurable binding
affinity.
DISCUSSION
The current study confirms and extends our initial obser-
vation using affinity CE [14] by applying two additional
biophysical techniques to confirm the specificity of this
interaction with regards to peptide sequence. Furthermore,
our study uses structurally defined heparin oligosaccharides
to establish that while the tetrasaccharide is too small to
exhibit strong binding, little difference in binding strength is
observed between hexa- and tetradeca-saccharides. Also,
the CE experiments demonstrate the novel finding that the
N-terminal portion of the peptide may be partly modified
without apparent effect on heparin-binding capabilities. The
K
d
values for AP-1 peptide binding to heparin measured by
the ITC method differ significantly from the SPR and CE
measurements. These differences might result from the
differences in experimental conditions associated with each
measurement [25]. Measurement of K
d
values are very
method dependent [27]. SPR values involve the immobil-
ization of one of the binding partners, i.e. it is a two-phase
measurement. While affinity CE and ITC are both solution
phase binding assays; a reduced pH value was required in
ITC to maintain peptide solubility at the high concentra-
tions required in this method to observe measurable heats of
binding. The difference in pH is expected to markedly affect
the K
d
value measured. A large difference between ITC and
SPR binding constant measurements has also been reported
on heparin’s interaction with heparin-binding growth-
associated molecule (HB-GAM) [28]. In the present study,
it is important to point out that in each type of measure-
ment, the natural peptide is being compared to the
scrambled sequence peptide under identical conditions. In
all cases, the natural peptide binds over 10-fold tighter than
the scrambled sequence peptide. SPR demonstrated that an
oligosaccharide length of greater than a tetrasaccharide size
gave optimal binding. It is interesting to note that practically
no interaction of sequence scrambled AP-1 peptide to
heparin oligosaccharides could be measured using SPR,
suggesting that this is indeed a sequence-specific interaction,
in agreement with the CE measurements of the affinity. The
current experiments also support the CE-based estimates of
binding constants [14], the importance of the C-terminus
[16], and the dependency of binding on the presence of an
S–S bridge [18]. Because separation and binding assessment
take place in one operation in CE, a mixture of three
peptides could be evaluated directly for binding while the
purified components had to be used in the SPR and ITC
approaches.
Model simulations of the AP-1 peptide structure show
that a random coil or b sheet form are more favored. A
search for this sequence by using
BLAST
(Basic Local
Alignment Search Tool) at NCBI (National Center for
Biotechnology Information) shows that it is only found
within serum amyloid P protein (SAP) [11]. This sequence
exists in a random L-shaped conformation in which all the
basic residues (i.e. Lys28 and Arg38) and hydrogen-
bonding residues (i.e. Gln31 and Asn32) lie on the same
face (Fig. 6). The only known heparin-binding motif
[29,30] that this sequence conforms weakly to is the one
proposed by Margalit et al. [21], where a critical distance
of 20 A
˚
between basic amino acids is proposed to
be important for interactions with heparin, irrespective
of whether the site folds into an a helix or a b sheet.
Fig. 5. SPR sensorgram of regular (A) and scrambled (B) AP-1 peptide–
heparin oligosaccharides interaction. The oligosaccharides shown are:
(X2) tetrasaccharide (X3) hexasaccharide (X4) octasaccharide (X5)
decasaccharide (X6) dodecasaccharide, and (X7) tetradecasaccharide.
Kinetic values calculated from the experiments with the regular peptide
are listed in Table 1.
Table 1. Kinetic measurement of the binding of heparin oligosaccharides
to the AP-1 peptide immobilized on the surface of an SPR chip (see
Fig. 5).
Heparin
oligosaccharide k
on
(
M
)1
Æs
)1
) k
off
(s
)1
) K
d
(l
M
) R
max
Tetrasaccharide 0.5 · 10
3
17 · 10
)3
34 75
Hexasaccharide 1.6 · 10
3
7 · 10
)3
4.4 200
Octasaccharide 1.6 · 10
3
18 · 10
)3
11 250
Decasaccharide 1.7 · 10
3
7 · 10
)3
4.1 240
Dodecasaccharide 1.4 · 10
3
6.8 · 10
)3
4.8 250
Tetradecasaccharide 2.9 · 10
3
6.0 · 10
)3
2.1 250
Ó FEBS 2002 Characterization of a novel heparin-binding peptide (Eur. J. Biochem. 269) 2865
A measurement of the distance between the Lys and Arg
in AP-1 shows that they are 27 A
˚
apart while the same
residues are separated by 11 A
˚
in the random conforma-
tion of the scrambled peptide. Modeling studies on SAP
(Fig. 6) suggest that the N-terminal portion of the AP-1
peptide [EKPLQN (27–32)] is surface exposed and is the
most likely portion of the peptide sequence to be involved
in heparin binding. In contrast, peptide studies clearly
demonstrate that the C-terminus [FTLCFR (33–38)] is the
most important portion of AP-1 for heparin binding
[16,17]. Additional studies will be required to understand
whether a conformational change, resulting from Ca
2+
binding to SAP, may explain the differences between
experimental results on the AP-1 peptide and modeling
studies on SAP.
ACKNOWLEDGEMENTS
This work has received economical support from The Danish Medical
Research Council (grant no. 9602230), Lundbeckfonden, M. L.
Jørgensen og Gunnar Hansens Fond, Fonden til Lægevidenskabens
Fremme, and Apotekerfonden af 1991 to N. H. H. H and from the US
National Institutes of Health (grants HL52622, GM38060, and
HL62244) to R. J. L.
REFERENCES
1. Skinner, M. & Cohen, A.S. (1988) Amyloid P Component. Meth
Enzymol. 163, 523–536.
2. Kalaria, R.N., Galloway, P.G. & Perry, G. (1991) Widespread
serum amyloid P immunoreactivity in cortical amyloid deposits
and the neurofibrillary pathology of Alzheimer’s disease and other
degenrative disorders. Neuropath. Appl. Neurobiol. 17, 189–201.
3. Mantzouranis, E.C., Dowton, S.B., Whitehead, A.S., Edge, M.D.,
Bruns, G.A.P. & Colten, H.R. (1985) Human serum amyloid P
component. cDNA isolation, complete sequence of pre-serum
amyloid P component, and localization of the gene to chromo-
some 1. J. Biol. Chem. 260, 7752–7756.
4. Hawkins, P.N., Myers, M.J., Lavender, J.P. & Pepys, M.B. (1988)
Diagnostic radionuclide imaging of amyloid: biological targeting
by circulating human serum amyloid P component. Lancet I,
1413–1418.
5. Pepys, M.B., Rademacher, T.W., Amatayakul-Chantler, S.,
Williams,P.,Noble,G.E.,Hutchinson,W.L.,Hawkins,P.N.,
Nelson, S.R., Gallimore, J.R., Herbert, J., Hutton, T. & Dwek,
R.A. (1994) Human serum amyloid P component is an
invariant constituent of amyloid deposits and has a uniquely
homogeneous glycostructure. Proc. Natl Acad. Sci. USA 91, 5602–
5606.
6. Pepys, M.B. & Baltz, M.L. (1983) Acute phase proteins
with special reference to C-reactive protein and related proteins
(pentaxins) and serum amyloid A protein. Adv. Immunol. 34,
141–212.
7. Bickerstaff,M.C.M.,Botto,M.,Hutchinson,W.L.,Herbert,J.,
Tennent, G.A., Bybee, A., Mitchell, D.A., Cook, H.T., Butler,
P.J.G., Walport, M.J. & Pepys, M.B. (1999) Serum amyloid P
component controls chromatin degradation and prevents anti-
nuclear autoimmunity. Nat. Med. 5, 694–697.
8. Coker, A.R., Purvis, A., Baker, D., Pepys, M.B. & Wood, S.P.
(2000) Molecular chaperone properties of serum amyloid P com-
ponent. FEBS Lett. 473, 199–202.
9. Hutchinson, W.L., Hohenester, E. & Pepys, M.B. (2000) Human
serum amyloid P component is a single uncomplexed pentamer in
whole serum. Mol. Med. 6, 482–493.
10.Botto,M.,Hawkins,P.N.,Bickerstaff,M.C.M.,Herbert,J.,
Bygrave, A.E., McBride, A., Hutchinsson, W.L., Tennent, G.A.,
Walport, M.J. & Pepys, M.B. (1997) Amyloid deposition is
delayed in mice with targeted deletion of the serum amyloid P
component gene. Nat. Med. 3, 855–859.
11. Emsley, J., White, H.E., O’Hara, B.P., Oliva, G., Srinivasan, N.,
Tickle, I.J., Blundell, T.L., Pepys, M.B. & Wood, S.P. (1994)
Structure of pentameric human serum amyloid P component.
Nature 367, 338–345.
12. Hohenester,E.,Hutchinson,W.L.,Pepys,M.B.&Wood,S.P.
(1997) Crystal structure of a decameric complex of human serum
amyloid P component with bound dAMP. J. Mol. Biol. 269,
570–578.
13. Dhawan, S., Fields, R.L. & Robey, F.A. (1990) A novel peptide
from amyloid P component supports cell attachment. Biochem.
Biophys. Res. Commun. 171, 1284–1290.
14. Heegaard, N.H.H. & Robey, F.A. (1992) Use of capillary zone
electrophoresis to evaluate the binding of anionic carbohydrates to
synthetic peptides derived from serum amyloid P component.
Anal. Chem. 64, 2479–2482.
15. Heegaard, N.H.H. & Robey, F.A. (1993) Use of capillary zone
electrophoresis for the analysis of DNA-binding to a peptide
derived from amyloid P component. J. Liq. Chromatogr. 16, 1923–
1939.
16. Heegaard, N.H.H., Heegaard, P.M.H., Roepstorff, P. & Robey,
F.A. (1996) Ligand binding sites in human serum amyloid P
component. Eur. J. Biochem. 239, 850–856.
17. Heegaard, N.H.H. (1999) Microscale characterization of the
structure-activity relationship of a heparin-binding glycopeptide
using affinity capillary electrophoresis and immobilized enzymes.
J. Chromatogr. A 853, 189–195.
18. Heegaard, N.H.H. (1998) A heparin-binding peptide from human
serum amyloid P component characterized by affinity capillary
electrophoresis. Electrophoresis 19, 442–447.
Fig. 6. Ribbon structure of serum amyloid protein (SAP) monomer [11]
in which the AP-1 peptide is shown in black. The basic and hydrogen
bonding residues in the AP-1 sequence are labeled. The residues on the
horizontal portion of the L-shaped biding site reside on the external
surface of the protein.
2866 M. J. Hernaiz et al. (Eur. J. Biochem. 269) Ó FEBS 2002
19. Cardin, A.D. & Weintraub, H.J.R. (1989) Molecular modeling
of protein–glycosaminoglycan interactions. Arteriosclerosis 9,
21–32.
20. Sobel, M., Soler, D.F., Kermode, J.C. & Harris, R.B. (1992)
Localization and characterization of a heparin binding domain
peptide of human von Willebrand factor. J. Biol. Chem. 267,
8857–8862.
21. Margalit, H., Fischer, N. & Ben Sasson, S.A. (1993) Comparative
analysis of structurally defined heparin binding sequences reveals a
distinct spatial distribution of basic residues. J. Biol. Chem. 268,
19228–19231.
22. Mach, H., Volkin, D.B., Burke, C.J., Middaugh, C.R., Linhardt,
R.J.,Fromm,J.R.,Loganathan,D.&Mattsson,L.(1993)Nature
of the interaction of heparin with acidic fibroblast growth factor.
Biochemistry 32, 5480–5489.
23. Karlsson, R., Michaelsson, A. & Mattsson, L. (1991) Kinetic
analysis of monoclonal antibody–antigen interactions with a
new biosensor based analytical system. J. Immunol. Methods 145,
229–240.
24. Hileman, R.E., Jennings, R.N. & Linhardt, R.J. (1998) Thermo-
dynamic analysis of the heparin interaction with a basic cyclic
peptide using isothermal titration calorimetry. Biochemistry 37,
15231–15237.
25. Pervin,A.,Gallo,C.,Jandik,K.A.,Han,X.J.&Linhardt,R.J.
(1995) Preparation and structural characterization of large
heparin-derived oligosaccharides. Glycobiology 5, 83–95.
26. Heegaard, N.H.H. (2001) Capillary Electrophoresis. In Protein–
Ligand Interactions: Hydrodynamics and Calorimetry (Harding,
S.E. & Chowdhry, B.Z., eds), pp. 171–195. Oxford University
Press, Oxford, UK.
27. Connors, K.A. (1987) In Binding Constants. The Measurement of
Molecular Complex Stability, pp. 363–372. John Wiley & Sons,
New York.
28. Fath, M., VanderNoot, V., Kilpelainen, I., Kinnunen, T.,
Rauvala, H. & Linhardt, R.J. (1999) Interaction of soluble and
surface-bound heparin binding growth-associated molecule with
heparin. FEBS Lett. 454, 105–108.
29. Hileman, R.E., Fromm, J.R., Weiler, J.M. & Linhardt, R.J. (1998)
Glycosaminoglycan–protein interactions: definition of consensus
sites in glycosaminoglycan binding proteins. Bioessays 20, 156–167.
30. Capila, I. & Linhardt, R.J. (2002) Heparin–protein interactions.
Angewandte Chemie Int. Ed. 41, 390–412.
Ó FEBS 2002 Characterization of a novel heparin-binding peptide (Eur. J. Biochem. 269) 2867