Transcriptome analysis of the brain provides insights into the regulatory mechanism for coilia nasus migration
Bạn đang xem bản rút gọn của tài liệu. Xem và tải ngay bản đầy đủ của tài liệu tại đây (635.06 KB, 7 trang )
Wang et al. BMC Genomics
(2020) 21:410
/>
RESEARCH ARTICLE
Open Access
Transcriptome analysis of the brain
provides insights into the regulatory
mechanism for Coilia nasus migration
Meiyao Wang1,2,3, Gangchun Xu1,2, Yongkai Tang1,3 and Pao Xu1,2,3*
Abstract
Background: Coilia nasus (C. nasus) is an important anadromous fish species that resides in the Yangtze River of
China, and has high ecological and economical value. However, wild resources have suffered from a serious
reduction in population, attributed to the over-construction of water conservancy projects, overfishing, and
environmental pollution. The Ministry of Agriculture and Rural Affairs of the People’s Republic of China has issued a
notice banning the commercial fishing of wild C. nasus in the Yangtze River. Wild C. nasus populations urgently
need to recover. A better understanding of C. nasus migration patterns is necessary to maximize the efficiency of
conservation efforts. Juvenile C. nasus experience a simultaneous effect of increasing salinity and cold stress during
seaward migration, and the brain plays a comprehensive regulatory role during this process. Therefore, to explore
the early seaward migration regulation mechanism of juvenile C. nasus, we performed a comparative transcriptome
analysis on the brain of juvenile C. nasus under salinity and cold stress simultaneously.
Results: Relevant neurotransmitters, receptors, and regulatory proteins from three categories of regulatory pathway
play synergistic regulatory roles during the migration process: neuronal signaling, the sensory system, and
environmental adaptation. The significant differential expression of growth-related hormones, thyroid receptors,
haptoglobin, and prolactin receptors was similar to the results of relevant research on salmonids and steelhead
trout.
Conclusions: This study revealed a regulatory network that the brain of juvenile C. nasus constructs during
migration, thereby providing basic knowledge on further studies could build on. This study also revealed key
regulatory genes similar to salmonids and steelhead trout, thus, this study will lay a theoretical foundation for
further study on migration regulation mechanism of anadromous fish species.
Keywords: Coilia nasus, Brain, Transcriptome, Salinity, Stress
* Correspondence:
1
Key Laboratory of Freshwater Fisheries and Germplasm Resources
Utilization, Ministry of Agriculture, Freshwater Fisheries Research Center,
Chinese Academy of Fishery Sciences, Wuxi 214081, China
2
Wuxi Fisheries College, Nanjing Agricultural University, Wuxi 214081, China
Full list of author information is available at the end of the article
© The Author(s). 2020 Open Access This article is licensed under a Creative Commons Attribution 4.0 International License,
which permits use, sharing, adaptation, distribution and reproduction in any medium or format, as long as you give
appropriate credit to the original author(s) and the source, provide a link to the Creative Commons licence, and indicate if
changes were made. The images or other third party material in this article are included in the article's Creative Commons
licence, unless indicated otherwise in a credit line to the material. If material is not included in the article's Creative Commons
licence and your intended use is not permitted by statutory regulation or exceeds the permitted use, you will need to obtain
permission directly from the copyright holder. To view a copy of this licence, visit />The Creative Commons Public Domain Dedication waiver ( applies to the
data made available in this article, unless otherwise stated in a credit line to the data.
Wang et al. BMC Genomics
(2020) 21:410
Background
The Coilia fish belongs to the family of Engraulidae and
the order of Clupeiforme, and is distributed in the midwest Pacific and Indian oceans. As a popular Coilia fish
species for consumers in China, Coilia nasus (C. nasus)
is a precious fish species in the Yangtze River. It is one
of the “Three Delicious Species in the Yangze River”,
with Reeve’s shad (Tenualosa reevesii) and obscure pufferfish (Takifugu fasciatus) being the other two species
[1, 2]. However, it has suffered from a serious population
reduction in recent years as a result of the overconstruction of water conservancy projects, overfishing,
and environmental pollution [3–5]. Consequently, the
catch yield has reduced by 60% and continues to drop
yearly [6]. It has been included on the “National Key
Protective Species List” of China. The Ministry of Agriculture and Rural Affairs of the People’s Republic of
China has issued a notice banning the fishing of wild C.
nasus in the Yangtze River for production. The restoration of wild C. nasus is urgently needed.
C. nasus is an important anadromous fish species. In
February, mature adults return to their native Yangtze
River and its tributaries to spawn. Their offspring move
to the estuaries, where they will remain until autumn,
and then migrate to the ocean for growth and fattening
[7, 8]. Therefore, during this process, juvenile C. nasus is
simultaneously exposed to increased salinity and cold
stress. There has been very few research on regulation
mechanism of C. nasus during migration, which were
mainly on regulatory pathways and function of key regulatory genes that function during spawning migration,
such as the comparative transcriptome analysis on brain
and liver of wild adult C. nasus during spawning migration [9] and function analysis on FoxL2 and Cyp19a1of
C. nasus during anadromous migration [10]. The results
indicated that many neurotransmitter signaling pathways
in brain and relevant receptors, transporters, and regulatory proteins were significantly upregulated. Meanwhile,
most pathways in liver were downregulated and indicated its function in energy conservation during spawning migration. The brain serves as the center of the
nervous system in vertebrates and exerts a more comprehensive regulatory function than other tissues of perception system regulation, learning, and memory muscle
activity, through which the organism responds to the
changing environment [11, 12]. Therefore, research on
the influence of environmental factor variation on the
brain transcriptome will be beneficial for revealing the
comprehensive regulatory network that is formed during
C. nasus migration.
Traditionally, research on the effects of temperature
and salinity as environmental stressors in fish has been
carried out in the liver and gills due to the pivotal roles
of these organs in energy supply and osmoregulation.
Page 2 of 14
Recent studies that investigated the strengthening of the
brain regulatory function in response to salinity and cold
stress have indicated that the expression of hormones,
neurotransmitters, receptors, and key regulatory proteins
was upregulated [13–18]. Xu et al. [19] investigated the
effect of cold exposure on the brain transcriptome of the
Yellow rum (Nibea albiflora). The results indicated that
the most significantly enriched pathway was involved in
signal transduction. Salmonids, such as Atlantic salmon
(Salmo salar), coho salmon (Oncorhynchus kisutch), and
steelhead trout (Oncorhynchus mykiss gairdneri), in
addition to C. nasus, are also economically important
anadromous fish species. In order to explore their regulatory mechanisms during smoltification, some research
has been carried on trout, and resident and migratory
salmonids, including comparative transcriptome analyses
of the brain, liver, gill, kidney, and olfactory rosettes
[20–24]. The results of these analyses indicated that differentially expressed genes (DEGs) were mainly involved
in development and metabolism [20, 21]. Relevant research on Atlantic salmon indicated that DEGs were involved in electron transport, oxygen transport and
endocrinology, there was no change in the expression of
thyroid-stimulating hormone (TSH), which is different
from the results of similar research on steelhead trout
and coho salmon [20, 22–24]. Additionally, a comparative transcriptome analysis on coho salmon in freshwater
and early marine environments showed that differential
regulatory pathways in the brain were mainly involved in
protein synthesis and MHC1-mediated antigen presentation [24]. These studies indicated that anadromous fish
species have differential regulatory mechanisms during
seaward migration. Therefore, it is essential to explore the
regulatory patterns in different anadromous fish species to
reveal the potential universal regulatory mechanisms.
Research on the regulatory mechanism of C. nasus
during migration is still in its infancy. Juvenile C. nasus
seaward migration is an important part of the species’
life history, but relevant research has not been carried
out. Given the simultaneous effects of salinity and cold
stress that juvenile C. nasus experiences during seaward
migration, we performed a comparative transcriptome
analysis of the brain under saline and cold stress, to investigate the regulatory role that the brain of juvenile C.
nasus plays during migration. We aimed to reveal key
regulatory pathways and genes, in order to construct a
regulatory network; lay the theoretical foundations for
further research on regulatory mechanisms during C.
nasus migration and for the optimization of artificial
breeding of C. nasus, which is beneficial for providing
high-quality fry fish for proliferation and release; and
contribute to efforts towards the restoration of wild C.
nasus. This study will also lay a theoretical foundation
for research on the regulation patterns of global Coilia
Wang et al. BMC Genomics
(2020) 21:410
Page 3 of 14
fish during migration. Combined with existing reports
on anadromous fish, this study will collect basic information on the regulation mechanism of anadromous fish
species during migration.
Results
To comprehensively explore regulation mechanism of
juvenile C. nasus during seaward migration, we performed comparative transcriptome analysis on juvenile
C. nasus under saline and cold stress simultaneously.
Top 10 GO terms, top 10 KEGG pathways and key
DEGs were obtained after library construction, sequencing, data filtering, assembly, annotation and differential
expression analysis. Correlation analysis on intraclass
difference in the control and stressed group was made,
validation of RNA-Seq data was carried out with quantitative real-time polymerase chain reaction (qPCR).
Transcriptome assembly and statistics of unigenes
The average RIN (RNA Integrity Number) for six brain
samples was 9.5. After quality filtering, the RNA-Seq of
six brain samples yielded around 46.36 million highquality sequence data. The Q value (Q30) was used as
the cutoff for quality control. The Q30 values of the
samples reached up to 93.03%, and the GC-content of
each sample reached around 48.5% (Table 1). The clean
reads obtained from the six transcriptome libraries were
assembled to full-length transcripts, and a total of 436,
325 unigenes were obtained after the elimination of redundant transcripts. The average transcript length was
795 bp, and N50 was 1001 bp. The average clean ratio
reached 99.8%.
Correlation analysis on intraclass differences in the
control and stressed group
CORREL function was used to analyze difference of FPKM
(Fragments per kilobase of transcript per million mapped
reads) of DEGs in the three replicated groups of control
group (C1-C3), as well as in the stressed group (E1-E3)
(Additional file 5: Table S4). The correlation analysis results
of C1-C2, C2-C3, C1-C3, E1-E2, E2-E3 and E1-E3 were as
follows, y = 0.835x + 0.9861and R2 = 0.8554 (correlation
coefficient r = 0.924863193), y = 1.1849x - 1.2712 and R2 =
0.9373 (r = 0.968150821), y = 1.0599x - 0.7987 and R2 = 0.92
(r = 0.959142331), y = 0.8144x + 1.0789 and R2 = 0.7603 (r=,
0.969855973), y = 0.9511x + 0.9828 and R2 = 0.9081 (r =
0.935047937), y = 0.9119x + 0.204 and R2 = 0.889 (r =
0.937179862). The results indicated that replicated groups in
the control group had strong correlation, as well as in the
stressed group, intraclass difference were both small in these
two groups. These differences were mainly caused by the individual differences of experimental animals and operation
difference during experiment, which are normal and acceptable difference. Therefore, Intra-group differences did not
affect the further analysis on differences between the control
and stressed group.
Top 10 gene ontology (GO) enrichment analysis on DEGs
Based on the GO enrichment analysis, 38,579 unigenes
were categorized into 62 functional groups from three
categories: biological processes (BP), molecular functions
(MF), and cellular components (CC) (Additional file 1:
Figure S1). Then, we conducted a further GO enrichment analysis on DEGs and obtained the top 10 GO
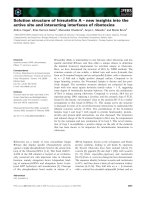
terms from each of the three categories (Fig. 1). Most BP
terms, with the exception of some involved in the general function (Nos. 1, 2, 5, and 6), were related to neuronal signal transduction (Nos. 3 and 7) or the sensory
system (Nos. 4 and 10). Most MF and CC terms were
relevant to synaptic transmission or the sensory system
and relevant components, such as neuropeptide binding,
glutamate receptor activity, the synaptic vesicle membrane, the cell junction, retinol binding, photosystem I,
the interphotoreceptor matrix, etc. The DEGs of each
term are shown in Additional file 2: Table S1.
Top 10 Kyoto encyclopedia of genes and genomes
(KEGG) enrichment analysis
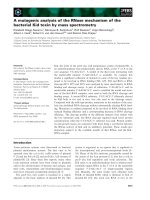
In total, we obtained 4721 DEGs (Additional file 2:
Table S1); 2020 DEGs were downregulated and 2701
DEGs were upregulated. As shown in Fig. 2, five
pathways were involved in neuronal signaling, including neuroactive ligand-receptor interaction, the calcium signaling pathway, glutamatergic synapse,
Table 1 Statistics of sequencing reads
Samples
C1a
C2a
C3a
S1a
S2a
S3a
Raw reads
46,644,438
46,486,085
46,608,652
46,401,430
46,355,046
46,667,900
RIN
9.3
9.1
9.6
9.7
9.7
9.4
Clean reads
46,544,340
46,390,980
46,502,440
46,328,580
46,266,780
46,570,300
Q30
92.43%
91.61%
92.28%
92.70%
92.59%
92.31%
(G + C) content
47.00%
47.50%
47.00%
47.00%
48.00%
47.50%
99.79%
99.8%
99.79%
99.84%
99.81%
99.8%
b
Clean ratio
a
C1-C3 refers to three replicated groups of the control group, S1-S3 refers to three replicated groups of the stressed group
b
Clean ratio equals clean reads/raw reads
Wang et al. BMC Genomics
(2020) 21:410
Page 4 of 14
Fig. 1 Top10 GO terms. Top 10 GO terms were enriched from DEGs of the C. nasus brain transcriptome. Number of DEGs enriched in each term
is shown at the right side of the bar. The vertical bar shows the three categories that the GO terms were enriched in: BP, MF, and CC
retrograde endocannabinoid signaling, and the serotonergic synapse. Two pathways were related to the
sensory system—olfactory transduction and phototransduction—and two were relevant to environmental
adaptation—circadian entrainment and ECM–receptor
interaction. The DEGs involved in these pathways are
shown in Additional file 2: Table S1.
Functional analysis on DEGs
According to a pathway hierarchy (Additional file 3:
Table S2), the top 10 GO and top 10 KEGG terms indicated that the DEGs were mainly involved in three categories: neuronal signaling, the sensory system, and
environmental adaptation. The relevant DEGs are listed
in Table 2.
Fig. 2 Top10 KEGG pathways. Top 10 KEGG pathways were enriched from DEGs of the C. nasus brain transcriptome. Three capital letters indicate
three main categories: (a), Environmental Information Processing; (b), Organismal systems; (c) Human Diseases
Wang et al. BMC Genomics
(2020) 21:410
Page 5 of 14
Table 2 Differentially expressed genes in response to salinity and cold stress
Category
Gene name
Gene definition
Log2FoLdchange P-value
Signal
transduction
ADCY2
adenylate cyclase 2
1.623024029
AHNAK
Neuroblast differentiation-associated protein
1.23991252
1.8059E-05
CBLN1
Cerebellin-1
1.477382614
2.64918E-05 +
CARTPT
Cocaine- and amphetamine-regulated transcript protein
1.705475308
2.57562E-05 +
EPHA4
Eph receptor A4
2.789583201
1.35975E-06 +
GRIN2A
glutamate receptor ionotropic, NMDA 2A
1.857980995
3.70302E-05 +
GRIA1
glutamate receptor 1
1.688055994
3.12289E-05 +
GRM5
metabotropic glutamate receptor 5
2.364836686
3.71795E-06 +
GABRD
gmma-aminobutyric acid receptor subunit gamma
5.95631015
9.03684E-16 +
GAL
Galanin peptide
27.63200829
4.90E-12
GALR1/R2
galanin receptor 1
2.606657572
4.26707E-05 +
GLDN
Gliomedin
2.294447358
5.23949E-06 +
GNG2
guanine nucleotide-binding protein G (I)/G (S)/G (O) subunit gamma-2
4.727920455
5.78933E-06 +
GNGT1
guanine nucleotide-binding protein G (T) subunit gamma-T1
7.078259014
6.39E-10
HTR4
5-hydroxytryptamine receptor 4
3.754887502
1.50417E-05 +
LRRTM4
Leucine-rich repeat transmembrane neuronal protein 4
2.331514144
1.57678E-05 +
MCH2
Pro-MCH 2
25.97596269
2.10002E-07 +
NCS1
Neuronal calcium sensor 1
2.047305715
1.22204E-05 +
NPBWR2
neuropeptides B/W receptor 2
4.054765803
2.71068E-09 +
NPY
neuropeptide Y
1.627628966
2.82109E-06 +
NSG1
Neuron-specific protein family member 1
1.047174058
4.29656E-05 +
NTSR1
Neurotensin receptor type 1
3.137503524
1.05811E-05 +
OPRL1
nociceptin receptor
1.521397372
3.59681E-05 +
PENKB
proenkephalin B (prodynorphin)
3.242856524
1.6675E-07
+
PNOC
Prepronociceptin
2.532269607
4.4328E-07
+
RIMS
regulating synaptic membrane exocytosis protein
1.002266607
2.38297E-05 +
SIPA1L1
signal-induced proliferation-associated 1 like protein 1
2.019469864
5.7446E-06
Sensory
system
Up/
Down
a
(+/-)
1.69565E-06 +
+
+
+
+
SV2
MFS transporter, VNT family, synaptic vesicle glycoprotein 2
1.105773138
3.32163E-05 +
SLC18A1_2
MFS transporter, DHA1 family, solute carrier family 18 (vesicular amine
transporter), member 1/2
5.129283017
1.5945E-05
SLC1A
solute carrier family 1 (glutamate transporter), member 7
4.169925001
2.75989E-05 +
SLC6A1
solute carrier family 6 (neurotransmitter transporter, GABA) member 1
-1.795641501
3.94984E-05
SNAP25
synaptosomal-associated protein 25
5.087462841
1.77515E-05 +
STAT
signal transducer and activator of transcription
2.359895945
4.93096E-05 +
SYNPR
Synaptoporin
5.087462841
5.35768E-08 +
SYT1/10
synaptotagmin-1
1.503662399
2.83789E-05 +
TAAR
trace amine associated receptor
3.5698751
2.98658E-05 +
TAC1
tachykinin 1
2.510961919
3.78253E-06 +
TENM1
Teneurin-1
2.895530733
8.37792E-07 +
OPRL1
Nociceptin receptor
1.521397372
3.59681E-05 +
AIPL1
Aryl-hydrocarbon-interacting protein-like 1
6.087462841
1.07977E-08 +
ANO7
Anoctamin -7
1.179072643
1.89574E-05 +
AVPR1B
Vasopressin V1b receptor
24.45513053
2.58472E-05 +
+
–
Wang et al. BMC Genomics
(2020) 21:410
Page 6 of 14
Table 2 Differentially expressed genes in response to salinity and cold stress (Continued)
Category
Stress
response
Gene name
Gene definition
Log2FoLdchange P-value
Up/
Down
a
(+/-)
CLDN
Claudin-22
3.896164189
6.32318E-07 +
CNGA2/
CNGB1
cyclic nucleotide gated channel alpha 2/beta 1
17.93156857
1.96876E-05 +
CRYAB
crystallin, alpha B
1.201986211
1.9046E-05
EYA4
Eyes absent homolog 4
-2.411813598
1.34683E-05
GABRB
gamma-aminobutyric acid receptor subunit beta
3.005805622
6.20322E-07 +
GNAT1_2
guanine nucleotide-binding protein G (t) subunit alpha 1/2
-4.727920455
5.78933E-06
GPRC5C
G-protein coupled receptor family C group 5 member C
25.21697079
3.47461E-06 +
GUCA1
guanylate cyclase activator 1
5.673002535
9.35629E-07 +
LRAT
phosphatidylcholine-retinol O-acyltransferase
25.95393638
2.31133E-07 +
LXN
Latexin
-1.459431619
5.90012E-06
–
NCKX1
solute carrier family 24 (sodium/potassium/calcium exchanger), member 1 3.554588852
2.60147E-05
–
PDE1
calcium/calmodulin-dependent 3’,5’-cyclic nucleotide phosphodiesterase
1.58282359
1.02849E-05 +
PDE6A/6B
rod cGMP-specific 3’,5’-cyclic phosphodiesterase subunit alpha/beta
-5.882643049
1.50714E-06
–
RCVRN
recoverin
-1.734266445
1.66801E-05
–
RGR
RPE-retinal G protein-coupled receptor
3.022367813
2.50182E-05 +
RHO
rhodopsin
-5.736965594
1.46417E-11
+
–
–
–
–
RLBP1
Retinaldehyde-binding protein 1
-3.594181031
6.71346E-07
RP1L1
Retinitis pigmentosa 1-like 1 protein
1.834221528
1.9372E-05
RPE65
retinoid isomerohydrolase
2.777607579
4.71976E-07 +
STRC
Stereocilin
-3.222392421
2.61719E-05
TAS1R1
taste receptor type 1 member 1
-3.544320516
4.83161E-05
TBR1
T-box brain protein 1
30.21465692
3.06E-28
+
–
–
+
–
TECTA
Alpha-tectorin
-2.725283789
2.72437E-06
TMC2
Transmembrane channel-like protein 2
3.896164189
6.32318E-07 +
TRPC3
Short transient receptor potential channel 3
-4.85077616
5.48984E-26
VAX1
Ventral anterior homeobox 1
25.21697079
3.47461E-06 +
AHCY
adenosylhomocysteinase
-3.689214537
1.72215E-05
–
AMD1
S-adenosylmethionine decarboxylase
-2.136372442
3.90066E-06
–
AQP9
aquaporin-4
4.882643049
3.44583E-06 +
ATP1B
sodium/potassium-transporting ATPase subunit beta
-1.026216857
1.43307E-05
CLDN
claudin
3.896164189
6.32318E-07 +
CYP51
sterol 14-demethylase
4.24879339
4.57294E-05 +
GHRH
Somatoliberin
4.307428525
9.87095E-07 +
HP
Haptoglobin
2.797137522
6.13977E-08 +
HSP70
Heat shock protein 70
1.985378817
6.00422E-08 +
METE
5-methyltetrahydropteroyltriglutamate--homocysteine methyltransferase
5.459431619
1.97921E-06 +
METK
S-adenosylmethionine synthetase
4.64385619
1.96876E-05 +
MTHFD
methylenetetrahydrofolate dehydrogenase
1.949534933
1.07109E-05 +
NTS
Neurotensin
5.544320516
9.11866E-11 +
PRLR
prolactin receptor
1.870147682
2.42871E-05 +
SLC6A5
Sodium- and chloride-dependent glycine transporter 2
3.440566897
1.10089E-06 +
SSTR1
somatostatin receptor 1
4.247927513
2.91451E-06 +
–
–
Wang et al. BMC Genomics
(2020) 21:410
Page 7 of 14
Table 2 Differentially expressed genes in response to salinity and cold stress (Continued)
Category
Gene name
Gene definition
Log2FoLdchange P-value
Up/
Down
a
(+/-)
TACR3
tachykinin receptor 3
-2.473931188
TRPC3
Short transient receptor potential channel 3
-5.48984E-26
1.9283E-24
RGS9
regulator of G-protein signaling 9
1.205267382
2.78147E-05 +
PRDX1/6
peroxiredoxin 6, 1-Cys peroxiredoxin
24.93156857
7.99857E-06 +
ATP1A/1B
sodium/potassium-transporting ATPase subunit alpha/beta
5.977279923
2.8038E-07
CACNB4/
CACNG4
voltage-dependent calcium channel beta-4/gamma-4
1.086335169
4.49908E-05 +
CADPS2
Calcium-dependent secretion activator 2
3.736965594
3.10145E-05 +
CORIN
Atrial natriuretic peptide-converting enzyme
1.595769256
2.17862E-05 +
GRIK1
glutamate receptor, ionotropic kainate 1
1.857980995
3.70302E-05 +
KCNA10
Potassium voltage-gated channel subfamily A member 10
2.475733431
1.21502E-06 +
KCNE1
potassium voltage-gated channel Isk-related subfamily E member 1
4.794415866
2.64187E-07 +
KCNIP1
Kv channel-interacting protein 1
1.478302393
3.18614E-05 +
KCNJ3
potassium inwardly-rectifying channel subfamily J member 3
1.538699778
1.97736E-05 +
KCNQ1
potassium voltage-gated channel KQT-like subfamily member 1
3.938599142
3.938599142 +
SCN4AB
Sodium channel protein type 4 subunit alpha B
4.266786541
6.43397E-12 +
1.14954E-05 +
–
+
a
Up/Down: DEGs upregulated or downregulated compared to the control group
Upregulated DEGs were those with log2Foldchange > 0, and downregulated DEGs were those with log2Foldchange < 0
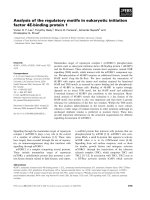
Validation of RNA-Seq data by qPCR
Ten DEGs were randomly selected from the RNA-Seq
data of upregulated and downregulated genes. As shown
in Fig. 3, expression of the genes were normalized to
beta-actin. The genes and primers used for qRT-PCR
were shown in Additional file 4: Table S3. P values for
genes in qRT-PCR were as follows, 0.36, 0.41, 0.25, 0.16,
0.33, 0.43, 0.36, 0.28, 0.18, 0.21. The correlation analysis
results for these detected DEGs in the brain are as follows: y = 0.9717x + 0.3891, and R2 = 0.8176 (r = 0.904,
p = 0) (Fig. 4), These ten DEGs exhibited a concordant
direction in both the RNA-Seq and qPCR analyses.
The results indicated that key pathways and DEGs were
mainly involved in the neuronal signal transduction,
Fig. 3 Validation of RNA-seq data. Validation of RNA-seq data was made by qPCR. X-axis, detected gene names; Y-axis, the relative expression
level was expressed as log2(fold change) in gene expression