Applying geostatistics to predict dissolvent oxygen (do) in water on the rivers in ho chi minh city
Bạn đang xem bản rút gọn của tài liệu. Xem và tải ngay bản đầy đủ của tài liệu tại đây (522.57 KB, 7 trang )
Hội nghị Khoa học Công nghệ lần thứ 4 - SEMREGG 2018
APPLYING GEOSTATISTICS TO PREDICT DISSOLVENT OXYGEN
(DO) IN WATER ON THE RIVERS IN HO CHI MINH CITY
Nguyen Cong Nhut
Faculty of Information Technology, Nguyen Tat Thanh University,
300A Nguyen Tat Thanh, District 4, Ho Chi Minh City
Email:
ABSTRACT
Geostatistics is briefly concerned with estimation and prediction for spatially continuous
phenomena, using data measured at a finite number of spatial locations to estimate values of interest
at unmeasured locations. In practice, the costs of installing new observational stations to observe
metropolitan water pollution sources, as DO (Dissolvent Oxygen), COD (Chemical Oxygen
Demand) and BOD (Biochemical oxygen Demand) concentrations are economically high. In this
study, spatial analysis of water pollution of 32 stations monitored during 3 years was carried out.
Geostatistics which has been introduced as a management and decision tool by many researchers
has been applied to reveal the spatial structure of water pollution fluctuation. In this article, I use the
recorded DO concentrations (is the amount of dissolvent oxygen in water requyred for the
respiration of aquatic organisms) at several observational stations on the rivers in Ho Chi Minh City
(HCMC), employ the Kriging interpolation method to find suitable models, then predict DO
concentrations at some unmeasured stations in the city. Our key contribution is finding good
statistical models by several criteria, then fitting those models with high precision. From the data
set, I found the best forecast model with the smallest forecast error to predict DO concentration on
rivers in Ho Chi Minh City. From there we propose to the authorities to improve areas where DO
concentrations exceed permissible levels.
Keywords: geostatistic, interpolation, kriging, spatial, variogram.
1. INTRODUCTION
1.1. Spatial data analysis
Water pollution is an issue of social concern both in Vietnam in particular and the world in
general. Water pollution caused by industrial factories increasingly degrades environments quality,
leads to severe problems in health for local inhabitants. The building of water quality monitoring
stations is also essential, but also difficult because of expensive installation costs, no good
information of selected areas for installation in order to achieve precise results. According to the
Center for Monitoring and Analysis Environment (Department of Natural Resources and
Environment HCMC), network quality monitoring water environment of HCMC has 32 stations
observation on water in the rivers in HCMC. However, with a large area, the city needs to install
more new monitoring stations. The cost to install a new machine costs tens of billions VND, and the
maintenance is also difficult. Therefore, the requyrements are based on the remaining monitoring
stations using mathematical models based to predict air pollution concentration at some unmeasured
stations in the city.
167
The fourth Scientific Conference - SEMREGG 2018
1.2. Ho Chi Minh City and Its water pollution problems
Sources of water pollution are diverse. Many industrial zones, industrial plants and urban areas
have discharged untreated wastewater to rivers and lakes which has polluted water sources severely.
As a result, water sources in many areas cannot be used. Socio-economic development in each river
basin is different and the contribution of pollutants to the environment from different sectors also
varies. However, the pressure of waste water mainly comes from industrial and domestic activities.
Waste water discharged from industrial establisments and industrial zones exerts the greatest
pressure on the surface water environment in the country. Agriculture is the largest user of water,
mainly for the irrigation of rice and other water intensive crops. Consequently, waste water
discharged by agricultural activities into surface water makes up the largest proportion. Quantity of
pollutants from untreated urban waste water. There is an increasing demand for running water in
urban areas to meet the need of population growth and the development of urban services.
Currently, most cities do not have a treatment system for domestic waste water. In those cities
which have this system, the rate of treated waste water is much lower than requyred. Untreated
domestic waste water from residential and tourism areas and discharged by small industrial and
handicraft establishments are the major cause of pollution to water sources within cities and their
outskirts.
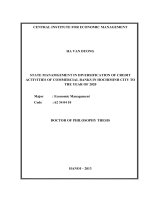
The study area is HCMC in South of Vietnam. It is located between 10o10'-10o38' northing and
106 22'-106o54' easting and the area has more than 2096 km2 (2018). HCMC has more than 9
million people (2018). Fig. 1 shows the study area. The city has a tropical climate, specifically a
tropical wet and dry climate, with an average humidity of 78 - 82 %. The average temperature is
28 oC (82oF) (degrees Farenheit).
o
Figure 1. Location of the study area.
a. Department of natural resources and environment HCMC
With the rapid population growth rate, the infrastructure has not yet been fully upgraded, and
some people are too aware of environmental protection. So, HCMC is currently facing a huge
environmental pollution problem. The status of untreated wastewater flowing directly into the river
system is very common. Many production facilities, hospitals and health facilities that do not have a
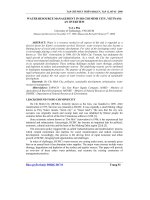
wastewater treatment system are alarming. Fig. 2 shows the geographical location of the monitoring
stations. The coordinates system used in Fig. 2 is Universal Transverse Mercator (UTM).
168
Hội nghị Khoa học Công nghệ lần thứ 4 - SEMREGG 2018
Figure 2. Map of water quality monitoring stations in HCMC.
2. MATERIALS AND METHODS
Dissolved oxygen (DO) refers to the level of free, non-compound oxygen present in water or
other liquyds. It is an important parameter in assessing water quality because of its influence on the
organisms living within a body of water. In limnology (the study of lakes), dissolved oxygen is an
essential factor second only to water itself. A dissolved oxygen level that is too high or too low can
harm aquatic life and affect water quality. The dataset is obtained from monitoring stations in the
rivers HCMC with these parameter DO. Fig. 2 shows map of water quality monitoring stations in
HCMC. DO data of water environment measures 32 stations from 2015 to 2017, (see Table 1). I
applied a geostatistical method to predict concentrations of air pollution at unobserved areas
surrounding observed ones.
Table 1. DO data of water quality monitoring stations in HCMC.
Station
X(m)
Y(m)
DO (mg/l)
Ba Son
687020.74
1193517.41
0.60
Den Do Apex
692372.50
1188205.59
2.10
Cat Lai Pier
695674.23
1190158.06
3.40
Rach Chiec-Sai Gon
691502.97
1196219.97
0.80
Phu Dinh Port
676558.28
1184762.57
0.20
Binh Khanh Ferry
693943.68
1180318.17
2.80
VCD-Binh Dien Bridge
674736.35
1183824.89
0.20
Tam Thon Hiep
704119.33
1173806.02
3.10
Soai Rap River
693691.06
1175042.20
2.30
Tan Thuan Port
688506.94
1190249.21
0.80
Phu Long Bridge
685004.43
1204724.99
1.50
Hoa Phu Pump station
676867.55
1215207.46
1.80
169
The fourth Scientific Conference - SEMREGG 2018
Station
X(m)
Y(m)
DO (mg/l)
Bridge Binh Trieu
687447.50
1197076.03
0.70
Lo Gom Bridge
678772.16
1187429.76
0.70
Chu Y Bridge
684059.70
1189290.14
0.90
An Loc Bridge
683576.38
1200370.94
0.70
Cai Stream
697408.50
1200142.76
1.10
Cat Lai
695671.18
1190161.11
0.70
Thi Tinh River
675253.16
1221229.09
2.20
Binh Loi Bridge
686955.30
1197608.09
3.70
Phu My
690858.99
1188710.28
3.00
Rach Tra
680156.73
1207934.77
0.70
Trung An
676079.87
1222198.63
2.20
Phu Cuong
679609.36
1214736.71
1.70
Hao Phu
677250.67
1215117.32
1.30
Phu Long
685004.36
1204737.28
3.20
Tam Thon Hiep
704291.61
1173475.08
3.70
Vam Co
712393.56
1158677.20
3.90
Binh Phuoc
687747.10
1201605.25
2.90
Vam Sat
696879.34
1160493.97
2.50
Nha Be
694496.87
1180871.54
2.20
Ben Cui
647959.62
1247597.60
2.20
The main tool in geostatistics is the variogram which expresses the spatial dependence
between neighbouring observations. The variogram ( ) can be defined as one-half the variance of
the difference between the attribute values at all points separated by has followed [1]
( )
( )
∑
( )
, ( )
(
)-2
(1)
where Z(s) indicates the magnitude of the variable, and N(h) is the total number of pairs of
attributes that are separated by a distance h.
Under the second-order stationary conditions [2], one obtains
[Z(s)]
and the covariance
Cov[Z(s), Z(s h)]
Then (h)
1
[Z(s) Z(s h)]2
2
[(Z(s)
)(Z(s h)
)]
[Z(s)Z(s h)
2
] C(h)
(2)
C(0) C(h)
The most commonly used models are spherical, exponential, Gaussian, and pure nugget effect
(Isaaks & Srivastava, 1989) [3]. The adequacy and validity of the developed variogram model is
tested satisfactorily by a technique called cross-validation.
170
Hội nghị Khoa học Công nghệ lần thứ 4 - SEMREGG 2018
Crossing plot of the estimate and the true value shows the correlation coefficient r2. The most
appropriate variogram was chosen based on the highest correlation coefficient by trial and error
procedure.
Kriging technique is an exact interpolation estimator used to find the best linear unbiased
estimate. The best linear unbiased estimator must have a minimum variance of estimation error. We
used ordinary kriging for spatial and temporal analysis. Ordinary kriging method is mainly applied
for datasets without and with a trend.
The general equation of linear kriging estimator is
n
ˆ )
Z(s
0
(3)
w i Z(si )
i 1
In order to achieve unbiased estimations in ordinary kriging the following set of equations
should be solved simultaneously.
n
w i (si ,s j )
(s0 ,si )
(4)
i 1
n
wi
1
i 1
ˆ
where Z(s
0 ) is the kriged value at location s0, Z(si) is the known value at location si, wi is the
weight associated with the data, is the Lagrange multiplier, and (
) is the value of variogram
corresponding to a vector with origin in si and extremity in sj.
Kriging minimizes the mean squared error of prediction
min e2
ˆ )]2
[Z(s0 ) Z(s
0
For second order stationary process the last equation can be written as
n
2
e
C(0) 2
n
w i w jC(si , s j ) subject to
w i C(s0 ,si )
i 1
n
n
wi
1
(5)
i 1
i 1 j 1
Therefore the minimization problem can be written as
n
min C(0) 2
n
n
w i C(s0 ,si )
i 1
n
w i w jC(si ,s j ) 2 (
i 1
j 1
w i 1)
(6)
i 1
where λ is the Lagrange multiplier. After differentiating (6) with respect to w1, w2,..., wn, and λ
and set the derivatives equal to zero we find that
n
n
jC(si ,s j )
j 1
C(s0 ,si )
0, i 1, 2,..., n and
wi
1
i 1
Using matrix notation the previous system of equations can be written as
171
The fourth Scientific Conference - SEMREGG 2018
C(s1 ,s 2 )
C(s1 ,s n ) 1
w1
C(s0 ,s1 )
C(s2 ,s1 ) C(s2 ,s 2 )
C(s1 ,s1 )
C(s2 ,s n ) 1
w2
C(s0 ,s 2 )
C(sn ,s1 ) C(sn ,s 2 )
1
1
C(sn ,s n ) 1
wn
C(s0 ,s n )
1
0
1
Therefore the weights w1, w2,..., wn and the Lagrange multiplier λ can be obtained by
W=C-1c
where
W
c
C
(w1, w 2 ,..., w n ,
)
(C(s0 ,s1 ), C(s0 ,s2 ),..., C(s0 ,sn ),1)
C(si ,s j ), i 1, 2,..., n,
j 1, 2,..., n,
1,
i
j 1, 2,..., n,
1,
i 1, 2,..., n,
j
n 1,
0,
i
j
n 1.
n 1,
n 1,
The GS+ software (version 5.1.1) was used for geostatistical analysis in this study (Gamma
Design Software, 2001) [4].
3. RESULTS AND DISCUSSIONS
In order to check the anisotropy of DO, the conventional approach is to compare variograms in
several directions (Goovaerts, 1997) [5]. In this study major angles of 0o, 45o, 90o, and 135o with an
angle tolerance of 45o were used for detecting anisotropy.
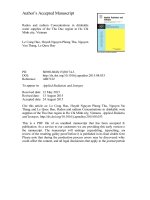
Figure 3. Fitted variogram for the spatial analysis of parameter DO.
Fig. 3 shows fitted variogram for spatial analysis of DO. Gaussian model [Nugget = 0.1 (mg/l);
Sill= 2 (mg/l); Range = 75864 (mg/l); r2 = 0.486]. It shows the best fitted omnidirectional variogram
of water pollution obtained based on cross-validation. Through variogram map of parameter DO,
the model of isotropic is suitable. The variogram values are presented in Table 2.
172
Hội nghị Khoa học Công nghệ lần thứ 4 - SEMREGG 2018
Table 2. Isotropic variogram values of DO.
Nugget
Sill
Range
r2
RSS
Linear
0.9
1.8
53583
0.485
1.05
Gaussian
1
2
75864
0.486
1.05
Spherical
0.22
1.421
4500
0.136
1.77
Exponetial
0.883
2.471
201600
0.484
1.06
Residual Sums of Squares (RSS) provides an exact measure of how well the model fits the
variogram data; the lower the reduced sums of squares, the better the model fits. When GS+ autofits
the model, it uses RSS to choose parameters for each of the variogram models by determining the
combination of parameter values that minimizes RSS for any given model. The Residual SS
displayed in the This Fit box is calculated for the currently defined model.
r2 provides an indication of how well the model fits the variogram data; this value is not as
sensitive or robust as the Residual SS value for best-fit calculations; use RSS to judge the effect of
changes in model parameters.
Model Testing: The reliable result of model selection using appropriate interpolation is
expressed in Table 3 by coefficient of regression, coefficient of correlation and interpolated values,
in addition to the error values as the standard error (SE) and the standard error prediction (SE
Prediction).
Table 3. Testing the model parameters.
Coefficient regression
Coefficient correlation
SE
SE Prediction
0.936
0.205
0.336
1.001
Figure 4. Error testing result of prediction DO.
Fig. 4 shows results of testing of error between real values and the estimated values by the
model by cokriging method with isotropic DO. Coefficients of regressionare close to 1, where the
error values is small (close to 0) indicates that the selected model is a suitable interpolation in
Fig. 5.
From Fig. 6 and Fig. 7, we see that, from 2015 to 2017 at Phu Dinh Port and Vam Co Dong Binh Dien Bridge neighborhood has low pollution levels. Neighborhood of Vam Co have high
173